📑 Chapter Navigation
Foundations
Chart Patterns
Indicators
📖 Complete Course Navigation
Foundation (Ch 1–4)
Analysis (Ch 5–8)
Advanced (Ch 9–15)
Learning Objectives
After studying this chapter, you should be able to:
- Understand the core philosophy and assumptions behind technical analysis
- Differentiate between technical and fundamental analysis
- Identify and interpret common chart types: line, bar, candlestick, and point & figure
- Comprehend the six tenets of Dow Theory and their relevance today
- Analyse primary trends, secondary reactions, and minor movements
- Recognise key reversal patterns (Hanging Man, Hammers, Engulfing, Morning/Evening Star)
- Identify continuation patterns: Triangles, Flags, Pennants, and Rectangles
- Draw and validate trendlines using swing highs and lows
- Apply technical indicators like Moving Averages, MACD, RSI, Bollinger Bands, ADX, OBV
15.1 Introduction to Technical Analysis
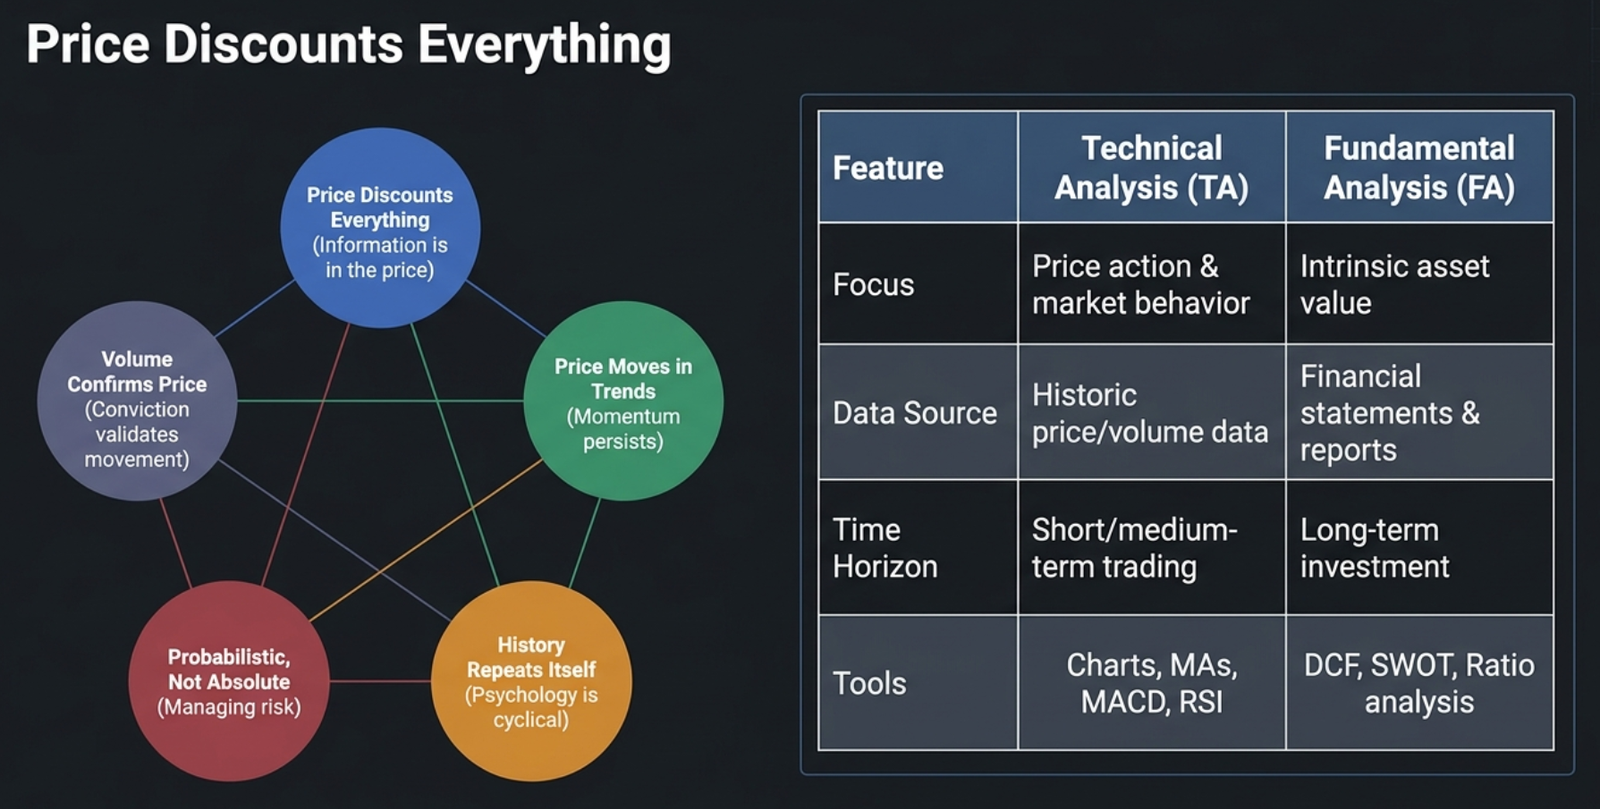
Technical Analysis is a method of evaluating securities by analyzing statistical trends gathered from trading activity, primarily price and volume. Unlike fundamental analysis, which focuses on a company's financial health, technical analysis assumes that all relevant information is already reflected in the price.
Core Philosophy and Assumptions
- Price Discounts Everything – All known and unknown information (economic, political, psychological) is already reflected in the market price. Technical analysts focus solely on price and volume.
- Price Moves in Trends – Markets tend to move in identifiable trends: up, down, or sideways. Once established, a trend is more likely to continue than reverse.
- History Repeats Itself – Market behavior is cyclical and driven by human psychology. Patterns seen in the past tend to recur under similar conditions.
- Market Action is Predictable (to a degree) – Recurring patterns and indicators offer probabilistic insights. TA is about managing risk, not guaranteeing outcomes.
- Volume Confirms Price – Volume trends help validate price movements and signal strength or weakness.
Technical Analysis vs Fundamental Analysis
| Feature | Technical Analysis | Fundamental Analysis |
|---|---|---|
| Focus | Price action and market behavior | Intrinsic value of the asset |
| Data Source | Historic price and volume data | Financial statements, economic reports |
| Time Horizon | Short/medium term trading | Long-term investment decisions |
| Tools | Chart patterns, RSI, MAs, MACD, OBV | DCF, SWOT, ratio analysis |
| Followed by | Traders, chartists, speculators | Fund managers, value investors |
15.2 Introduction to Chart Types
Line Chart
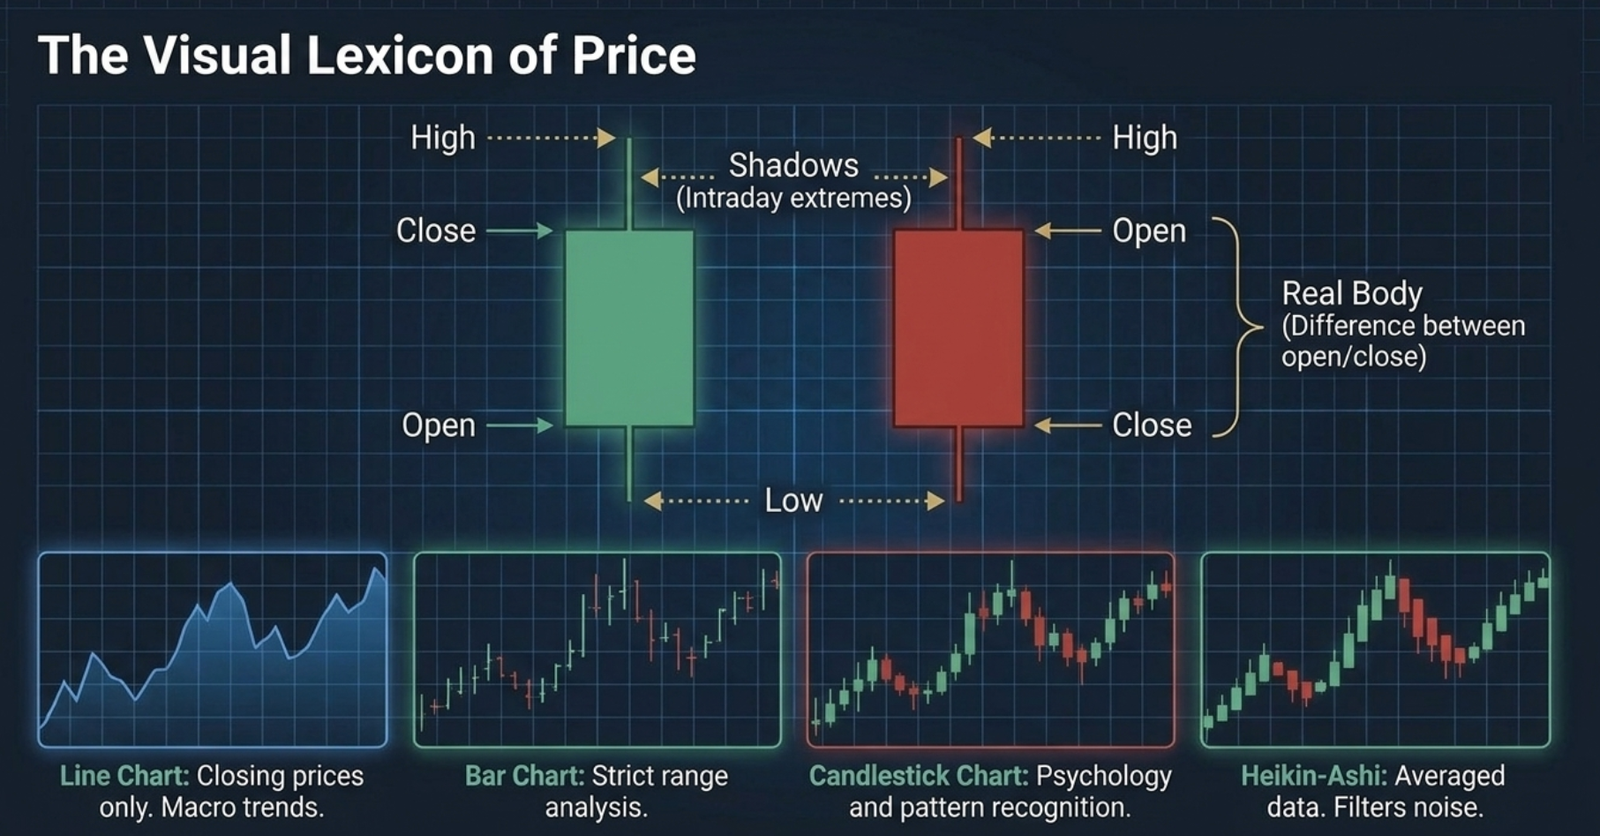
Uses closing prices over time as a continuous line. Best for quick trend visualization and long-term perspective. Does not capture intraday OHLC movements.
Bar Chart (OHLC)
Shows Open, High, Low, Close for each period. Best for detailed price action analysis and identifying volatility. Highlights price range and directional bias.
Candlestick Chart
Similar to bar charts but visually clearer. Uses color-coded bodies to identify trends. Best for identifying patterns like Doji, Hammer, Engulfing and reading market psychology.
Point & Figure Chart
Focuses only on price movements — ignores time and volume. Used for identifying breakout levels and support/resistance zones. Filters out noise; ideal for long-term trend analysis.
Renko Chart
Uses fixed price movements (bricks) rather than time intervals. Clarifies trends and tracks momentum. Smoothens minor fluctuations; good for trailing stop strategies.
Heikin-Ashi Chart
Adjusted candlesticks averaging price data to reduce noise. Ideal for trend-following strategies. Helps the trader remain longer in the trade by filtering whipsaws.
15.3 The Dow Theory
Developed in the early 20th century by Charles Dow through editorials between 1900 and 1902, later organized by William Hamilton and Robert Rhea. It remains a foundational framework in technical analysis.
The Six Tenets of Dow Theory
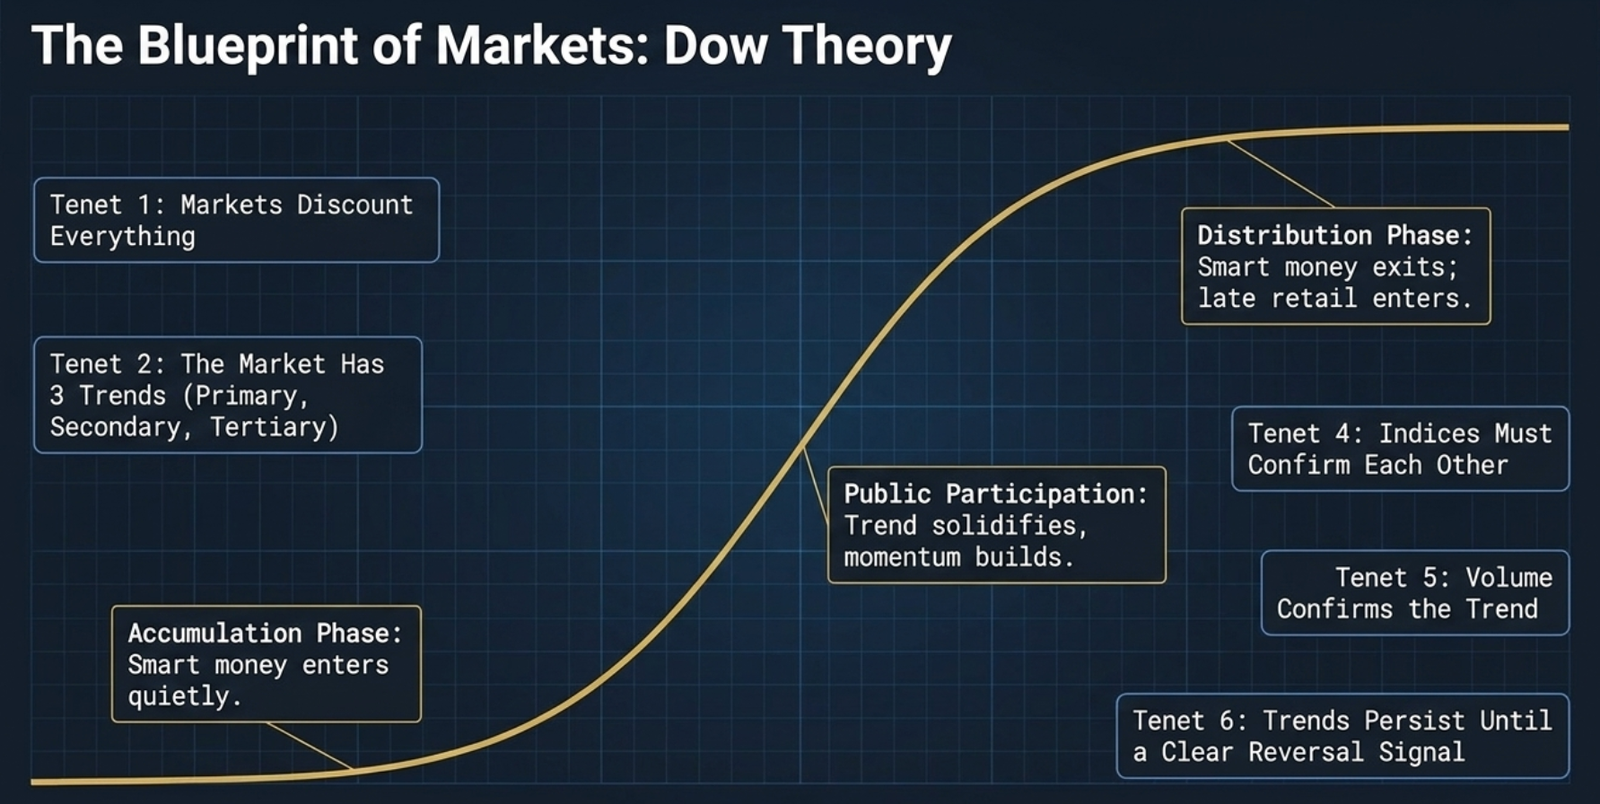
All known information — economic, political, psychological — is already captured in stock prices. Aligns with the Efficient Market Hypothesis (EMH).
- Primary trend – Long-term movement (bull or bear market)
- Secondary trend – Corrections or rallies within the primary trend (weeks to months)
- Tertiary trend – Minor short-term fluctuations (days to weeks)
- Accumulation phase – Smart money enters quietly
- Public participation phase – Broader market joins as momentum builds
- Distribution phase – Smart money exits; retail investors often enter/exit late
For a trend to be valid, major indices must move in the same direction — e.g., Nifty and Sensex should confirm each other.
Volume should increase in the direction of the primary trend. Key for confirming breakouts and momentum analysis (On-Balance Volume, Volume Profile).
A trend is assumed to be in effect until there is a definite reversal signal. Underpins trend-following strategies and use of trailing stops, MA crossovers, and price structure analysis.
15.4 Understanding Market Trends
15.4.1 Primary Trend
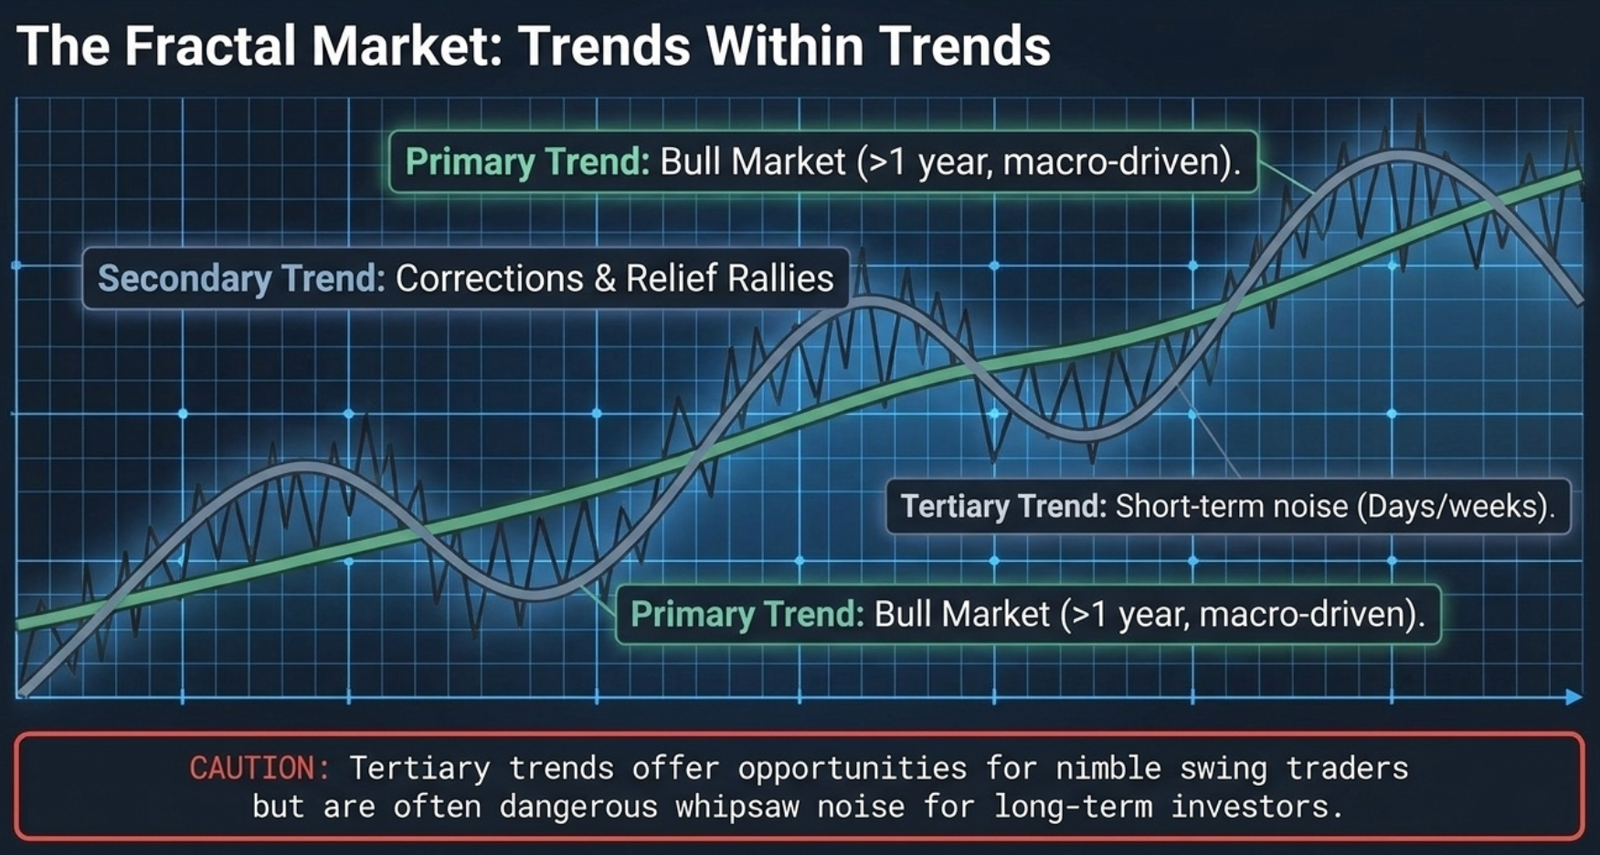
The dominant long-term movement in price, reflecting broad market sentiment and economic fundamentals over typically one year or more.
| Trend Type | Description | Market Sentiment |
|---|---|---|
| Bull Market | Sustained upward movement driven by optimism, growth, and liquidity | Confidence and Expansion |
| Bear Market | Prolonged decline, often triggered by economic contraction or crisis | Fear and Contraction |
| Sideways / Rangebound | Prices fluctuate within a horizontal range — indecision or equilibrium | Neutral or Uncertain |
Technical Indicators for Primary Trends: Moving Averages (50/100 DMA), Trendlines, Dow Theory, MACD, Higher highs/lower lows structure.
15.4.2 Secondary Trend
Intermediate movement correcting or retracing the primary trend. Lasts weeks to several months. These are "pullbacks" in bull markets and "relief rallies" in bear markets.
- Retracement typically ranges from 1/3 to 2/3 of the previous primary move (Dow Theory)
- Volumes typically lower than the primary trend
| Tool | How to Use |
|---|---|
| Fibonacci Retracement | Identifies reversal zones (38.2%, 50%, 61.8%) within a trend |
| Moving Averages (50 DMA) | Price crossing below/above signals secondary move |
| RSI / Stochastic | Detects overbought/oversold conditions that trigger reversals |
| Volume Analysis | Declining volume during correction suggests it is temporary |
15.4.3 Tertiary Trend
Short-term price movements lasting from a few days to a few weeks. They are highly volatile and reactive to news, earnings, or technical triggers. They form building blocks of larger chart patterns (flags, pennants, wedges).
15.5 Chart Reversal Patterns
Bearish Reversal Patterns
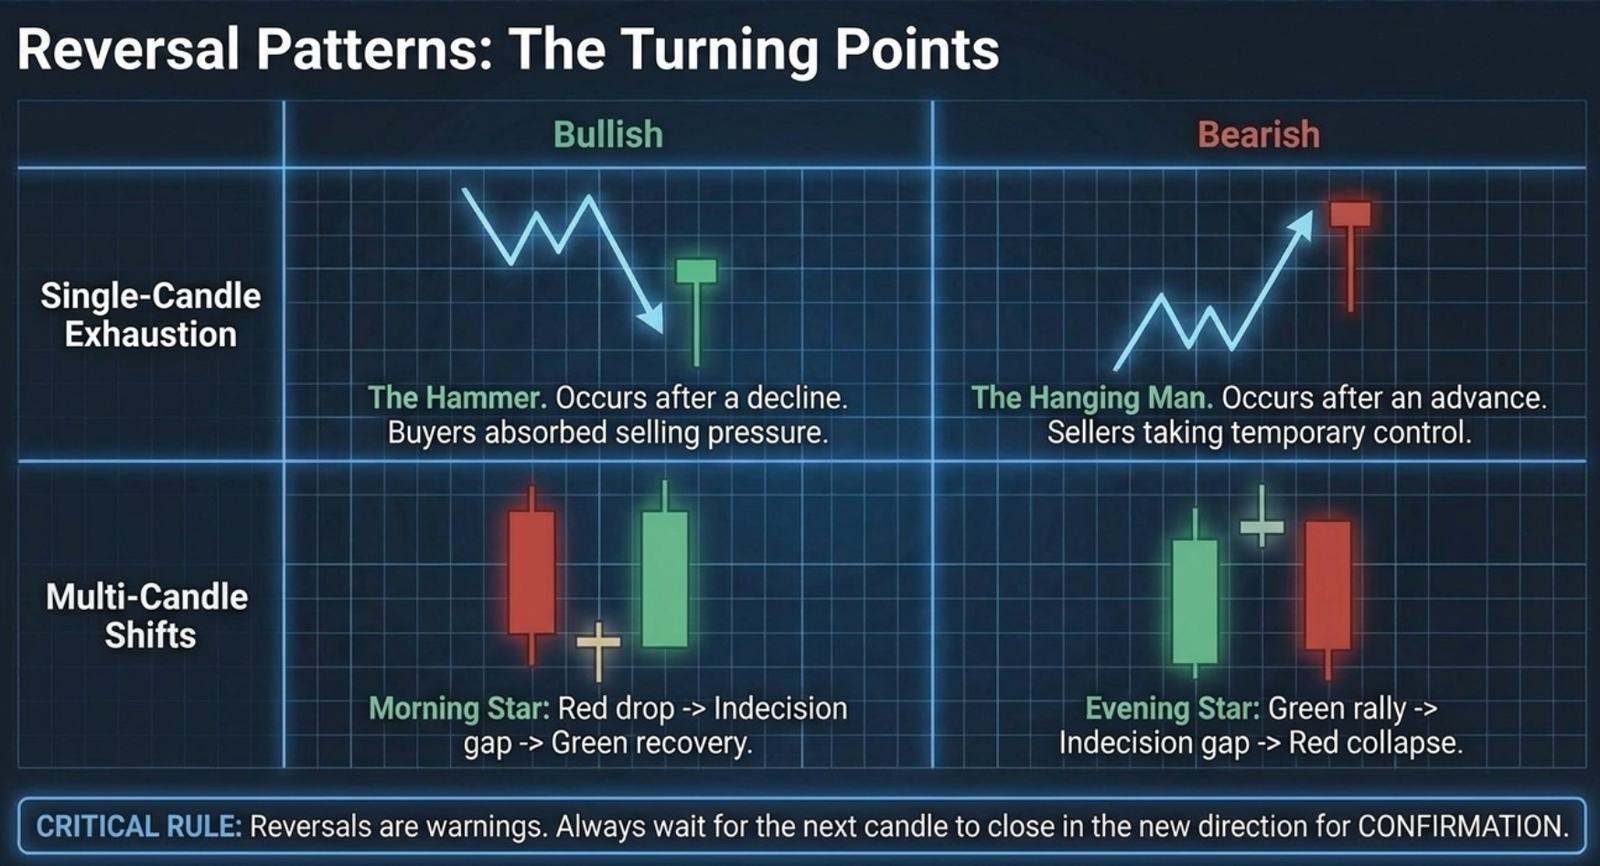
Bearish reversal after an up move. Small real body + long lower shadow (at least 2× the body) + little or no upper shadow. The long lower shadow shows sellers briefly took control. Confirmation: Next candle must close lower.
A large red candle completely engulfs the previous day's green candle. Most significant after a price advance. Both candles should be relatively large. Less significant in choppy markets.
Two-candlestick pattern near the top of a congestion area. In an uptrend, a bullish candle is followed by a gap-up open on the next day that turns bearish. The bearish candle closes below the midpoint of the previous bullish candle.
Three candles: (1) large green candlestick in uptrend, (2) small-bodied candle (doji or spinning top) closing above the first, (3) large red candle opening below the middle and closing near the center of the first bar.
Bullish Reversal Patterns
Similar to Hanging Man but occurs after a price decline. Small real body + long lower shadow (2× the body). Shows buyers absorbed selling pressure and pushed price back to near the open. Confirmation: Next candle must close higher.
A small red candlestick followed the next day by a large green candlestick whose body completely engulfs the previous red candle. Strongest when preceded by four or more red candles.
Two-candlestick pattern near the bottom of a congestion area. First candle is red (down day), second is green (up day) with a significant gap below the first candle's close. The green candle's body must cover at least half of the previous red candle.
Three candles: (1) tall red candlestick, (2) small-bodied candle with long wicks (indecision — bears losing ground), (3) tall green candle confirming the reversal. The third candle marks the start of a new uptrend.
15.6 Chart Consolidation Patterns
Triangle Patterns
| Pattern | Formation | Signal |
|---|---|---|
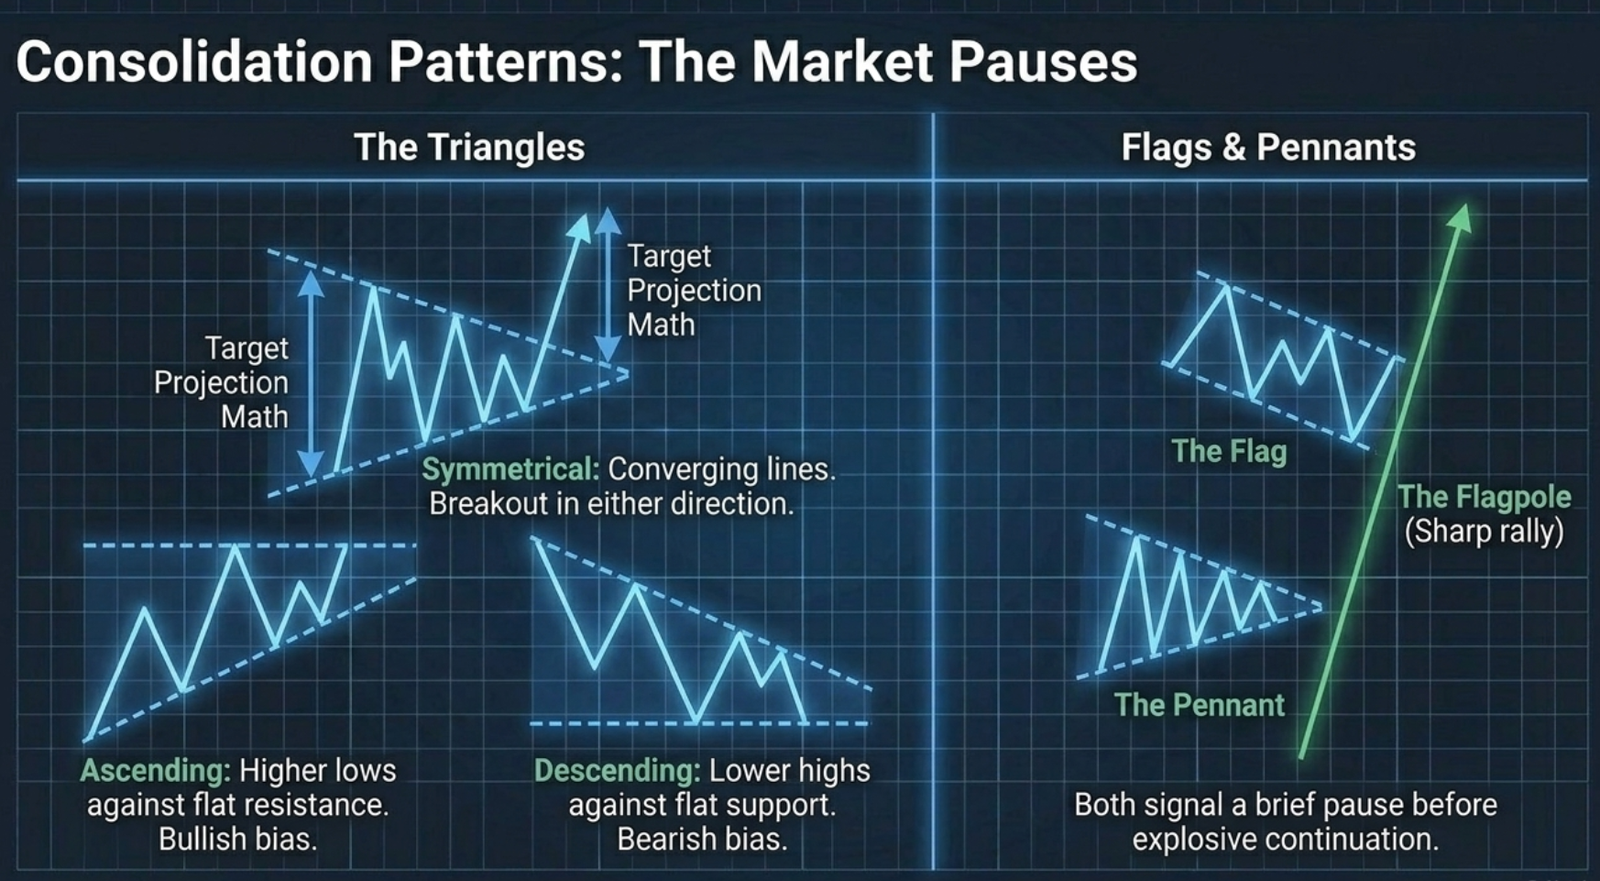
| Symmetrical Triangle | Converging trendlines (lower highs + higher lows) — period of consolidation | Breakout above = bullish; Breakdown below = bearish |
| Ascending Triangle | Series of higher lows + flat resistance — typically in an uptrend | Breakout above resistance = bullish continuation |
| Descending Triangle | Lower highs + flat support — typically in a downtrend | Breakdown below support = bearish continuation |
Flags and Pennants
Continuation patterns formed after a sharp rally (the flagpole) followed by a period of sideways or slightly lower price action.
- Flag – Sideways movement forms a rectangle
- Pennant – Sideways movement forms a small triangle
Watch for price to break above the upper trendline of the flag/pennant, then enter a long trade. The subsequent move is often roughly equal to the flagpole length.
15.7 Support and Resistance
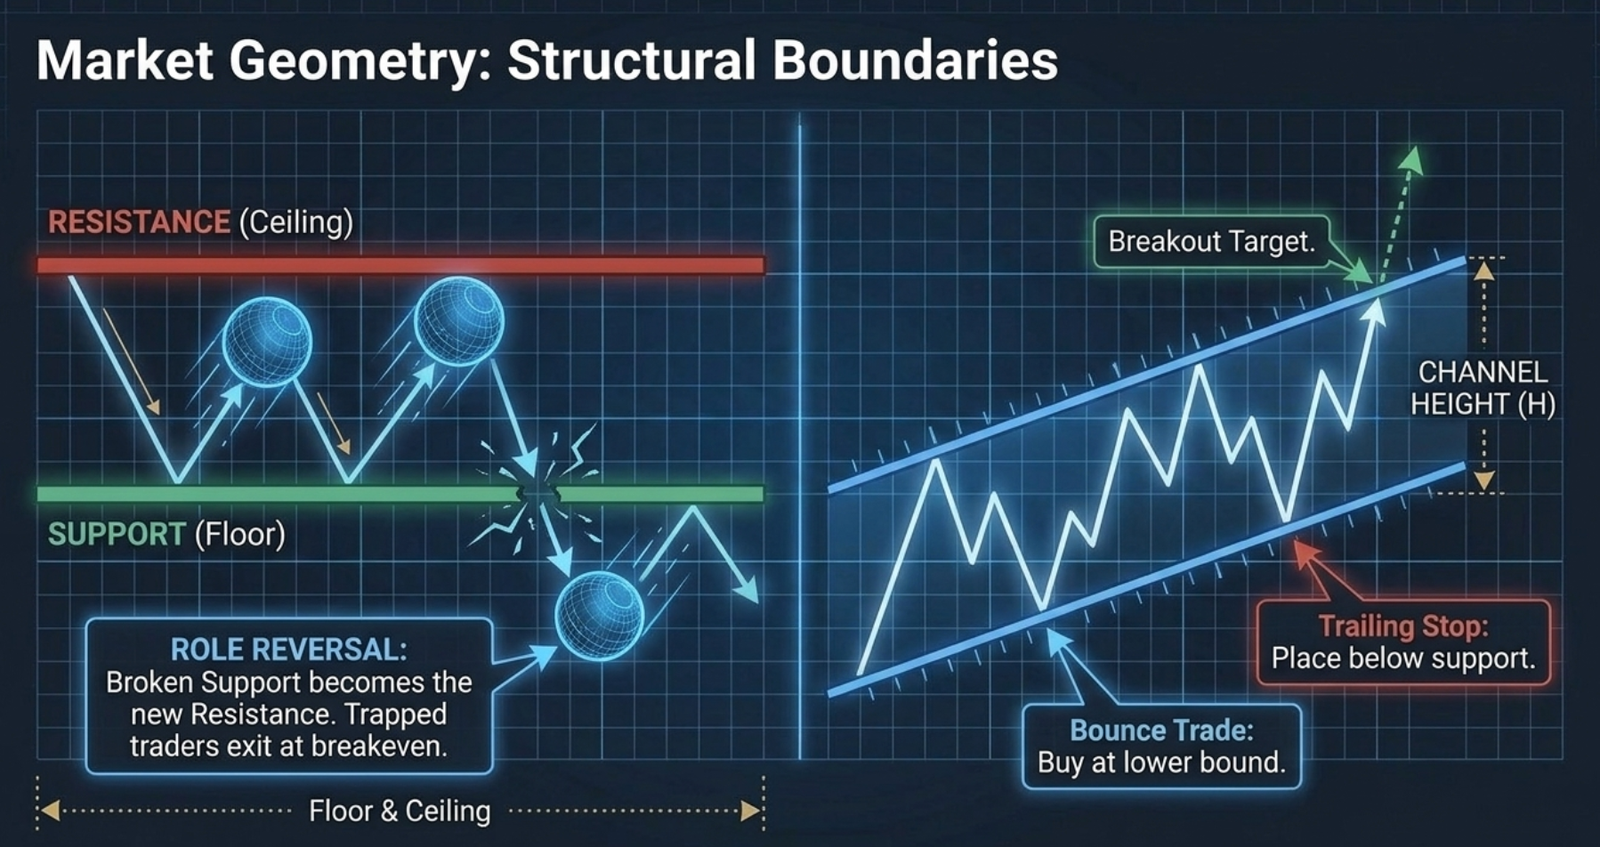
Support: A price level where a downtrend is expected to pause due to a concentration of demand — acts like a "floor".
Resistance: A price level where an uptrend is expected to pause due to a concentration of supply — acts like a "ceiling".
Types of Support and Resistance
| Type | Description | Example |
|---|---|---|
| Horizontal | Flat levels where price repeatedly reverses | Stock resisting around ₹1,950 |
| Trendline | Diagonal lines connecting higher lows (support) or lower highs (resistance) | Upward sloping support in a bull trend |
| Moving Averages | Dynamic support/resistance (e.g., 50-day MA) | Price bouncing off 50 DMA |
| Fibonacci Levels | 23.6%, 38.2%, 61.8% retracement levels | Stock retracing 38.2% from swing high |
| Psychological Levels | Round numbers that act as barriers | Nifty 25,000 as psychological level |
| Pivot Points | Calculated from previous period's high, low, close | Used widely in intraday trading |
Role Reversal
Once a support level is broken, it often becomes new resistance — and vice versa. This happens due to trapped traders exiting at breakeven, shift in market sentiment, and institutional order repositioning.
Quantifying Strength of Levels
| Factor | Implication |
|---|---|
| Number of touches | More touches = stronger level |
| Volume at levels | Higher volume = greater conviction |
| Time spent near level | Longer consolidation = more significant |
| Recency | Recent levels carry more weight |
15.8 Trendlines and Channels
A trendline is a straight line connecting two or more price points, extending into the future to act as support or resistance. Requires at least two points; three or more increases reliability.
| Trendline Direction | Connects | Indicates |
|---|---|---|
| Upward sloping | Higher lows | Bullish momentum |
| Downward sloping | Lower highs | Bearish momentum |
| Horizontal | Equal highs and lows | Consolidation / range-bound |
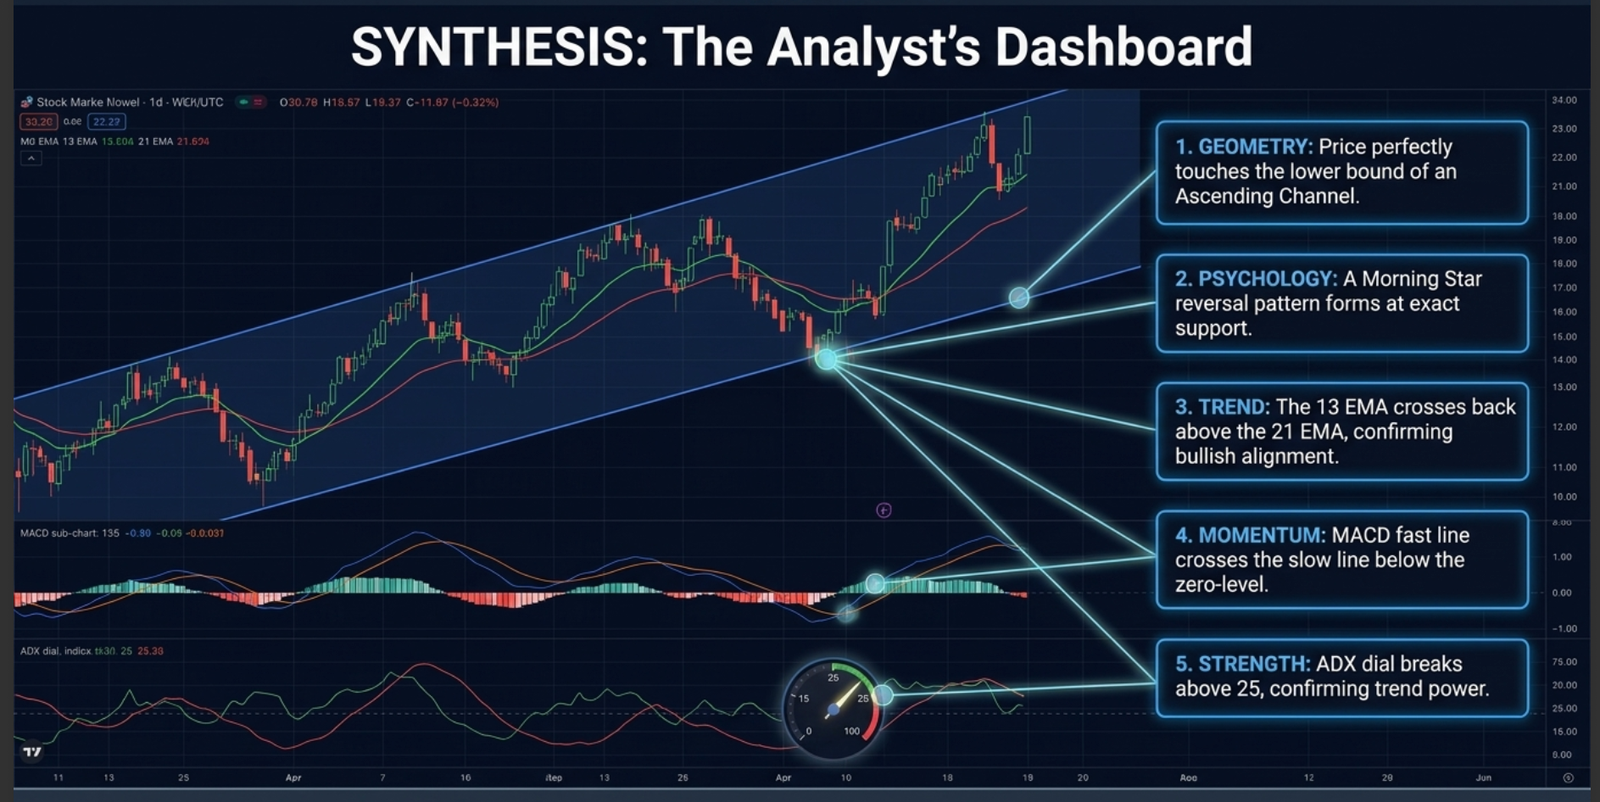
A channel is formed by drawing two parallel trendlines — one connecting highs, the other connecting lows. Trade within the channel (buy at support, sell at resistance). A breakout/breakdown signals a potential new trend.
Strategies
- Bounce Trades: Enter on price touching trendline with confirmation (bullish candle)
- Breakout Trades: Enter on decisive breakout with volume
- Trailing Stop: Use trendline to trail stop-losses in trending markets
- Channel Width Targeting: Project breakout move using channel height
15.9 Technical Indicators
15.9.1 Moving Averages (MA)
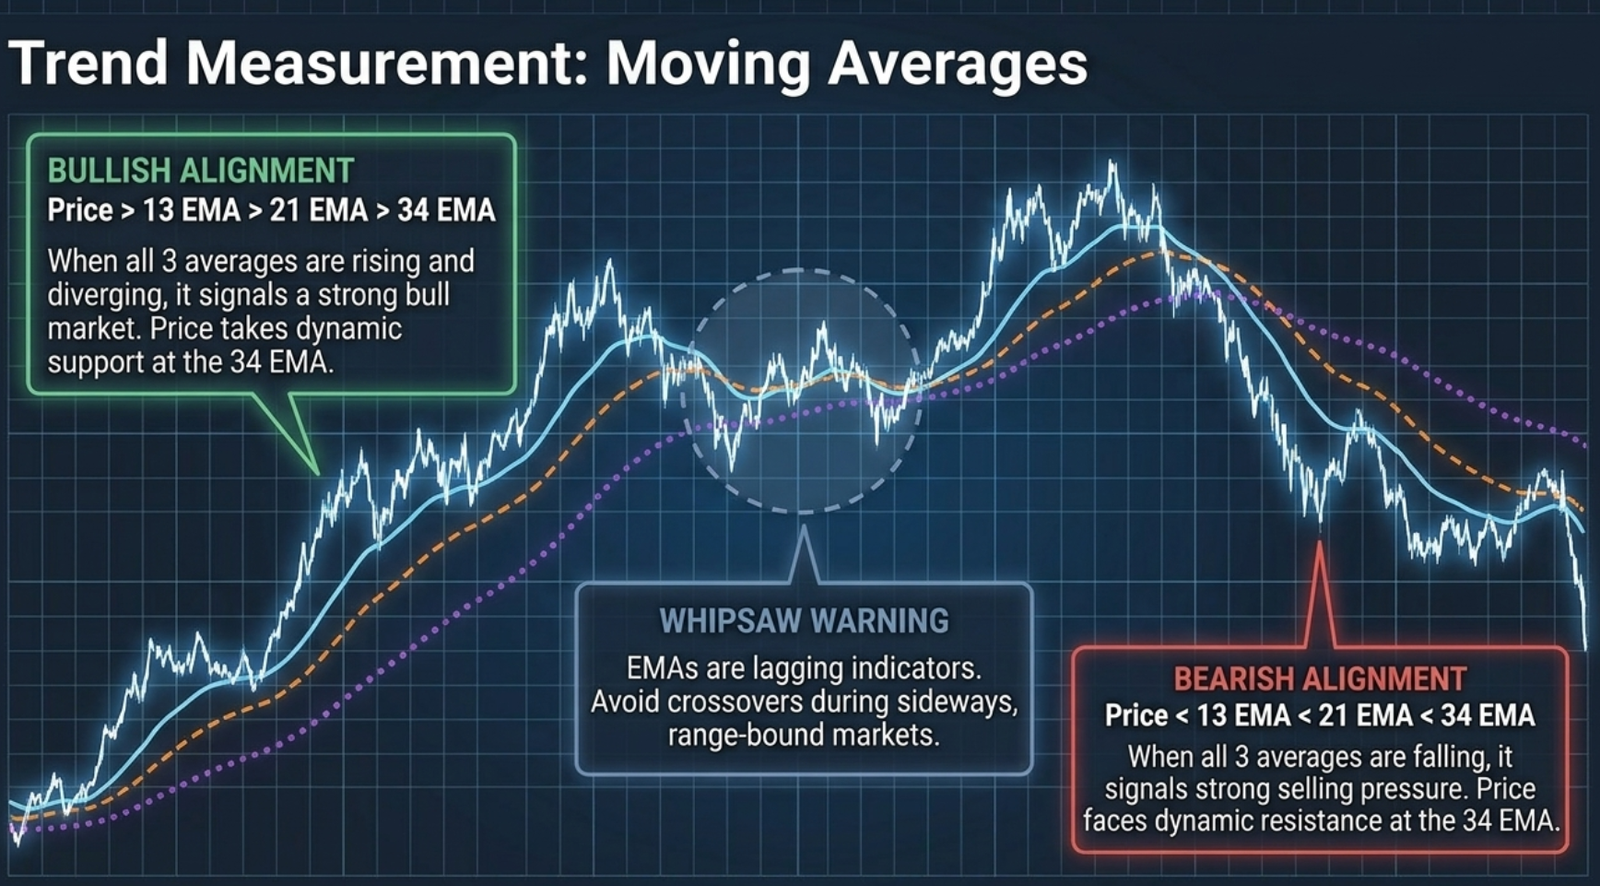
A smoothed version of prices — the average of daily/weekly/monthly closing prices. When MA points up, trend is upward; when MA points down, trend is downward. Lagging indicator but very useful for identifying major trends.
- Uptrend: Price > 13 EMA > 21 EMA > 34 EMA. In a bull market, price takes support around 34 EMA.
- Downtrend: Price < 13 EMA < 21 EMA < 34 EMA. Price resists around 34 EMA.
- When all 3 EMAs are rising and moving apart → strong bull market. When all 3 are falling and moving apart → strong selling pressure.
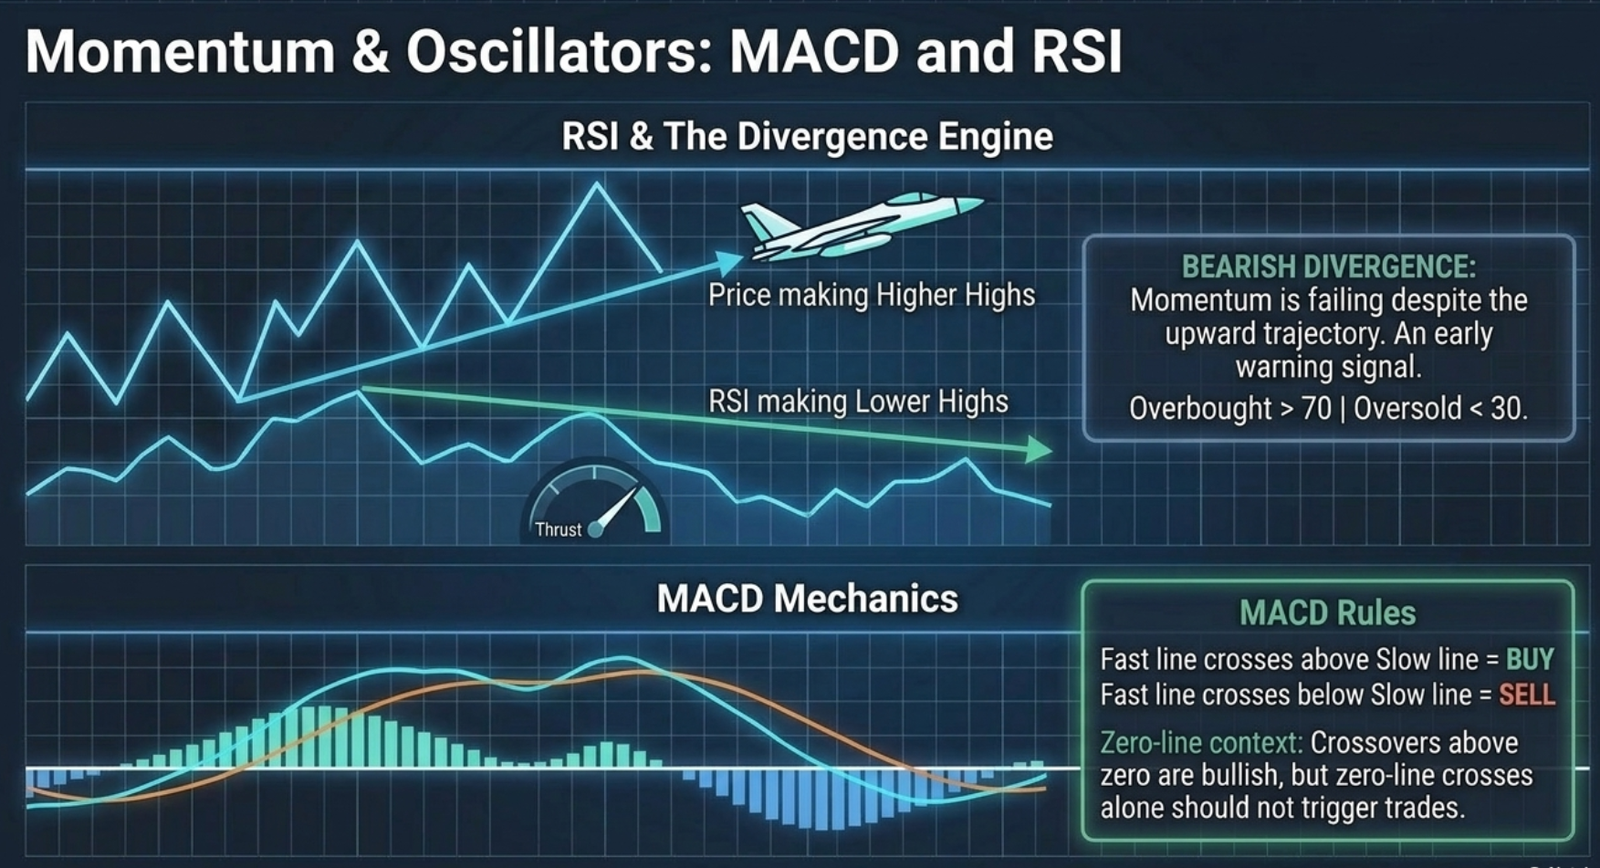
15.9.2 MACD (Moving Average Convergence Divergence)
Shows shift in momentum and confirms trend continuation. The default MACD line = 26 EMA − 12 EMA. The MACD slow line = 9 EMA of the default MACD line.
| Signal | Interpretation |
|---|---|
| Fast MACD crosses above slow MACD (with both rising) | Buy signal |
| Fast MACD crosses below slow MACD | Sell signal |
| Price makes higher high, MACD makes lower high | Bearish divergence — losing upward momentum |
| Price makes new low, MACD makes higher low | Bullish divergence — likely to bottom out |
| MACD makes double top or double bottom | Trend reversal likely |
15.9.3 Relative Strength Index (RSI)
Measures the speed and magnitude of recent price changes on a scale of 0 to 100. Can be a leading indicator; identifies potential reversals.
| RSI Level | Interpretation |
|---|---|
| > 70 | Overbought (can remain overbought for long in a strong bull market) |
| < 30 | Oversold (can remain oversold for long in a strong bear market) |
| Rarely falls below 44–45 | Strong bull market |
| Rarely rises above 50–55 | Bear market |
- Bullish Divergence: Price makes new low, RSI makes higher low → early buy signal
- Bearish Divergence: Price makes new high, RSI makes lower high → early sell signal
15.9.4 Average Directional Index (ADX)
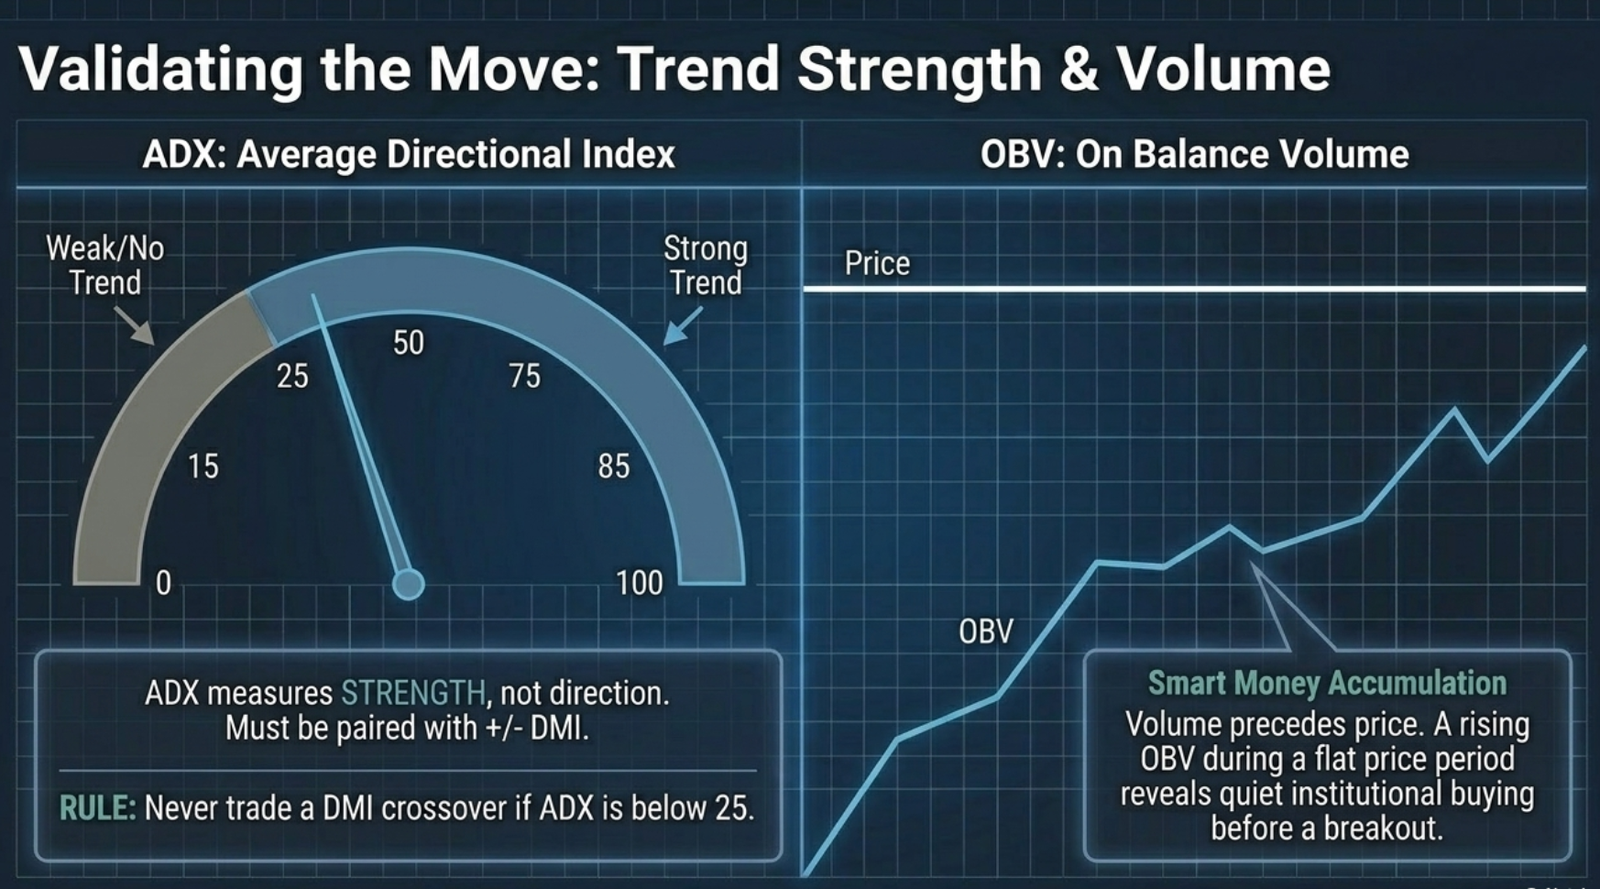
Measures trend strength (not direction). Plotted as a single line 0–100, usually with +DMI and −DMI indicators.
| ADX Value | Trend Strength |
|---|---|
| < 25 | Weak trend or no trend — avoid DMI crossovers |
| > 25 (rising) | Strong trend — DMI crossovers are more reliable |
- +DMI crosses over −DMI + ADX rising → Buy signal
- +DMI crosses below −DMI + ADX rising → Sell signal
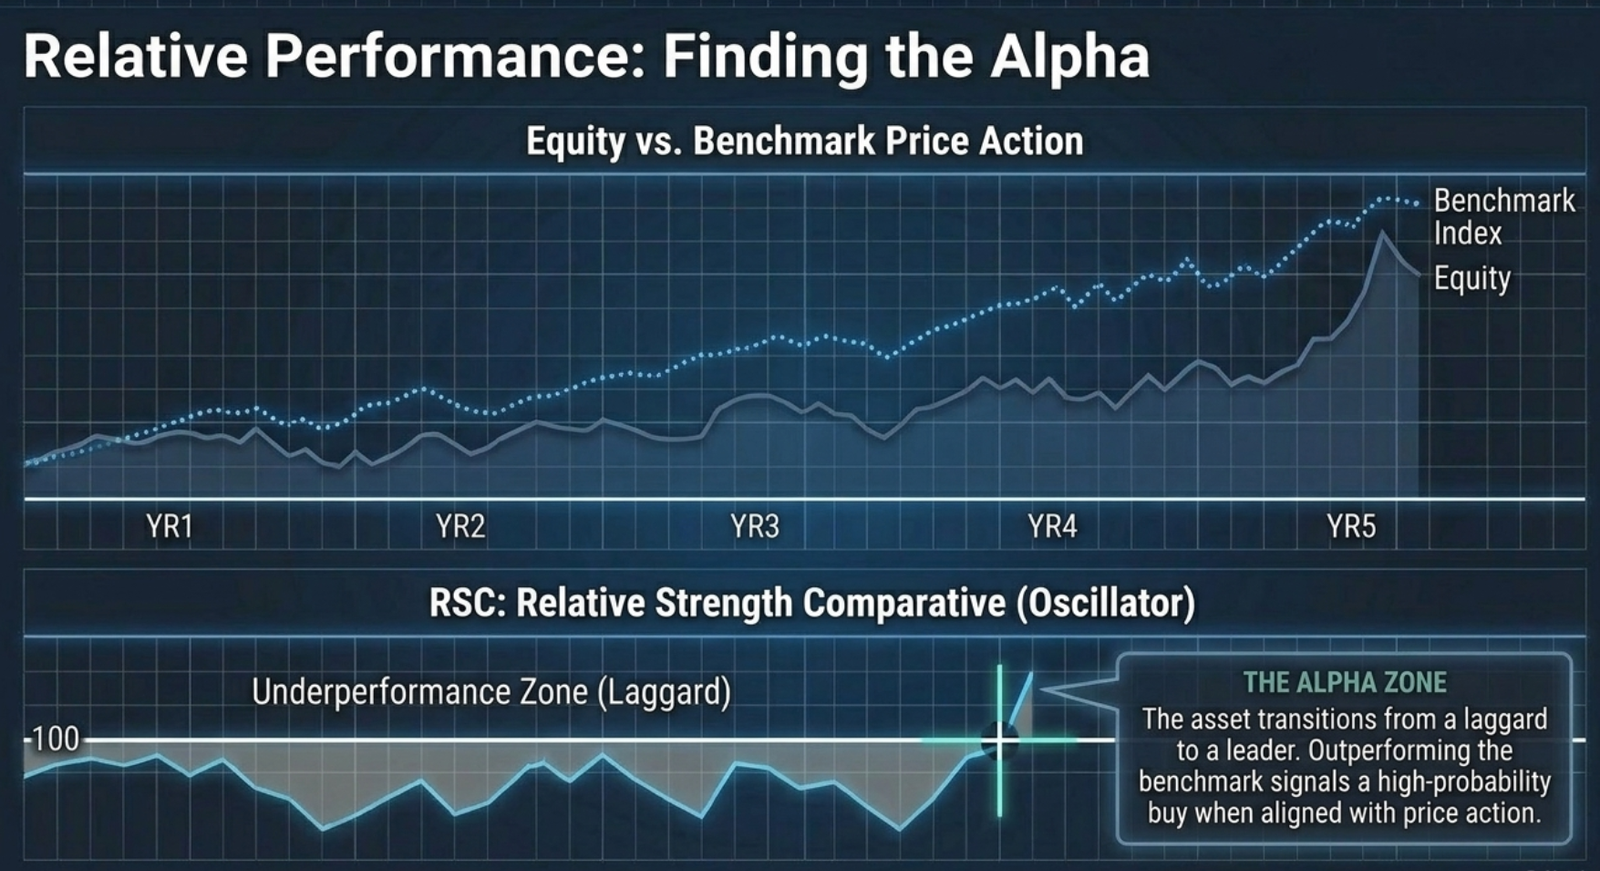
15.9.5 Relative Strength Comparatives (RSC)
Also known as Price Relative Indicator. Uses a ratio chart to compare performance of one security to another (typically a benchmark index like Nifty 50). Normalized to 100.
- RSC > 100 → stock outperforming the benchmark
- RSC < 100 → stock underperforming the benchmark
- Strong buy: RSC remains below 100 for long period then turns up and crosses 100
15.9.6 On Balance Volume (OBV)
Created by adding each day's volume if the closing price is higher than yesterday's, and subtracting if lower. OBV should steadily rise with rising prices and fall with declining prices.
- OBV 1 (actual) + OBV 20 (20-period average): Buy when OBV 1 crosses OBV 20 upward
- Higher high in price not accompanied by higher OBV → buying pressure fading
- Pronounced weakening of OBV on long-term charts → early warning of trend reversal (smart money may be exiting)
Key Takeaways
- Technical analysis assumes price discounts everything — all information is already in the price
- Dow Theory's six tenets remain foundational: markets discount all, have three trends, trends have three phases, indices must confirm, volume confirms, trends persist until clear reversal
- Primary trends last >1 year; secondary trends last weeks to months; tertiary trends last days to weeks
- Reversal patterns (Hammer, Engulfing, Morning Star) signal trend changes; they require confirmation from the next candle
- Triangle breakouts, flag breakouts = continuation signals; measure profit targets from the pattern height
- MACD: 26 EMA − 12 EMA. Fast MACD above slow MACD = buy. Divergence is a powerful signal.
- RSI above 70 = overbought; below 30 = oversold. In strong trends, RSI can remain extreme for extended periods.
- ADX measures trend strength, not direction. ADX > 25 (rising) = trend strong enough to trade.
- OBV divergence from price is an early warning of smart money repositioning
- Support and resistance zones are best confirmed by multiple touches, high volume, and recency
🃏 Flashcards
Click any card to reveal the answer. 74 cards covering the full chapter.
📝 Sample Questions
Questions from the official NISM workbook
Q1. Which of the following is not a tenet of Dow Theory?
- a) The market discounts everything
- b) The market has four trends
- c) The averages must confirm each other
- d) A trend remains in effect until a clear reversal occurs
Dow Theory recognizes three trends: Primary, Secondary, and Tertiary. There is no "four trends" tenet.
Q2. The candlestick pattern in a Hanging Man is unlikely to have which of the following features?
- a) A small real body, a long lower shadow at least twice the size of the real body
- b) Long lower shadow indicating sellers were in control for part of the trading period
- c) It is a bearish reversal candlestick pattern that occurs after an up move
- d) It is a bullish reversal candlestick pattern that occurs after a down move
That description applies to the Hammer. The Hanging Man is a bearish reversal occurring after an up move.
Q3. The Piercing Pattern is most likely to have which of the following features?
- a) A two-candlestick pattern that occurs near the bottom of the congestion area
- b) A three-candlestick pattern that occurs near the top of the congestion area
- c) A two-candlestick pattern that occurs near the top of the congestion area
- d) A three-candlestick pattern that occurs near the bottom of the congestion area
The Piercing Pattern is a two-candlestick bullish reversal pattern occurring near the bottom of a consolidation area.
Q4. The default MACD line is most likely the difference between:
- a) The 12-period EMA and the 9-period EMA
- b) The 26-period EMA and the 9-period EMA
- c) The 26-period EMA and the 12-period EMA
- d) The 26-period EMA and the 21-period EMA
Default MACD = 26 EMA − 12 EMA. The signal (slow) line = 9 EMA of the default MACD line.
Q5. Which of the following regarding the RSI is most likely true?
- a) When the stock makes a new low and RSI doesn't, it is called "bearish divergence"
- b) When the stock makes a new low and RSI doesn't, it is called "bullish divergence"
- c) The RSI is a very good indicator in a strongly trending market
- d) When the stock makes a new high and RSI doesn't, it is called "bullish divergence"
Price making lower lows while RSI makes higher lows = bullish divergence = early buy signal. RSI works best in range-bound, not strongly trending, markets.
Q6. In an uptrend using the 13-21-34 EMA combination, in which order should price and EMAs appear?
- a) 13 EMA > Price > 21 EMA > 34 EMA
- b) Price > 13 EMA > 21 EMA > 34 EMA
- c) 34 EMA > 21 EMA > 13 EMA > Price
- d) Price > 34 EMA > 21 EMA > 13 EMA
In a strong uptrend, the faster (shorter-period) averages are above the slower ones, and price leads them all. The 34 EMA acts as a support level.
✅ Chapter 15 Complete!
You've completed Chapter 15 — the final chapter of the NISM XV syllabus!