📑 Chapter Navigation
Financial Foundations
📖 Complete Course Navigation
Foundation (Ch 1-4)
Analysis (Ch 5-8)
- Ch 5: Economic Analysis
- Ch 6: Industry Analysis
- Ch 7: Company Analysis - Business
- Ch 8: Company Analysis - Financial
Advanced (Ch 9-13)
Annexures (Ch 14-16)
We have so far learnt how to analyse a company based on its internal factors as well as based on external factors such as economic and industry conditions. The next steps involve trying to assess the impact of these factors on the company's future profit, cash flows and, in turn, the fair value of the shares.
This is where financial analysis comes. In fact, financial statement analysis serves us in many ways. In section 6.4, we talked about bottom-up approach to market sizing. That would involve obtaining revenue numbers from financial statement. In section 6.7, we also talked about various industry specific KPIs. Much of the information to calculate such KPIs will have to come from the financial statements. In section 7.5, we discussed about certain financial metrics such as profit margins and financial position that contribute to the strengths or weakness of a company. Information for that also has to come from the financial statement. Finally, when we try to understand the expected profits of a business, we have to understand the interaction between various financial items. This will also involve studying the past financial statements to understand the behaviour of financial data points or line items.
Thus, financial statement analysis plays a very important role in fundamental analysis. In order to be able to do a good financial analysis, an analyst need not be a great accountant. But the analyst should be able to read and interpret the financial statements. However, prior knowledge of accounting will certainly be an added advantage.
LEARNING OBJECTIVES:
After studying this chapter, you should know about:
- Role of financial analysis in fundamental analysis
- Consolidated and stand-alone results of a company
- How to read a balance sheet
- How to read a profit and loss account statement
- How to read a cash flow statement
- Importance of reading audit report and notes to accounts
- Financial statement analysis using ratios and commonly used ratios
- Computation of Dupont analysis
- Importance of peer comparison
- Need to track the equity expansion, dividend and earnings history of the company
- Importance of studying the ownership structure and insider transactions
8.1. Introduction to Financial Statement
In India, the list of financial statements and its format that listed companies need to maintain and publish are governed by Schedule III of the Companies Act 2013 and IndAS 1.
As per IndAS1, a complete set of financial statements that listed companies need to publish include the following:
- Statement of Financial Position or Balance sheet: It provides information on the financial position i.e., assets, liabilities, and equity at the end of the financial reporting period.
- Statement of profit and loss account: It provides information about the company's financial performance i.e., income, expense and profits for a given period. It is also referred to as profit and loss account. IndAS 1 requires the statement to also include other comprehensive income (OCI)
- OCI includes certain gains or losses on account of changes in fair value of assets and liabilities that are required/permitted to be not recognized as part of income and expense
- Statement of changes in shareholder's equity: Shareholder's equity refers to the funds that belong to the shareholders. It can undergo change on account of various factors including profits earned, dividends paid, additional shares issued, buy back and certain income and other comprehensive income. IndAS 1 recognizes this statement as part of balance sheet.
- Cash flow statement: Cash flow statement provides a summary of the various sources and uses of cash.
- Detailed notes explain the accounting policy and break down of information presented in the financial statement.
Key Regulatory Requirement: While presenting the financial information, companies will have to provide comparable information for at least one prior period. Thus, every financial statement needs to contain information for the current period and the prior period. Companies can disclose or provide comparative financials for a longer period, if they prefer.
India vs Global Practice: One of the key departing features of financial statement regulation in India compared to rest of the world is that, in India, financial statements are expected to be meant for general purpose. It is expected to serve different types of audience including shareholders, lenders, employees / trade unions, government, vendors and general public. On the other hand, many other countries insist the financial statements are targeted at their investors.
8.2. Stand-alone Financial Statement and Consolidated Financial Statement
In the eyes of law every company is a separate registered entity. However, often we also come across situation where a company is owned and controlled by another company. For example, Jio Platforms is a separate company, but it is majority owned and controlled by Reliance Industries Limited. Similarly, Toyota Kirloskar Motor Limited is majority owned by Toyota Motor Corporation, Japan.
Since each company is a separate registered entity, each company prepares its own individual financial statement (referred as stand-alone financial statement). However, in case of large groups, these stand-alone financial statements can prove quite misleading. For instance, Toyota Motor Corporation is a Japanese company, but it operates across the world through several of its subsidiary companies. If we look at the stand-alone financial statement of Toyota Motor corporation, it would only show sales of that independent entity i.e., sales in Japan. Thus, sales of Toyota group in rest of the world including China, India or North America or any other part of the world done through the subsidiary will not reflect in their sales.
Therefore, companies are required to present consolidated financial statement. In consolidated financial statement, all companies that are controlled by a company are treated as part of a single group. Thus, it combines the financial performance of all the group companies together and presents it as part of a single financial statement.
Control Definition: It is important that one company can control another company by owning more than 50% of the voting rights or by having the right to appoint majority of the board of directors. Company that controls another company is generally referred as the holding company or the parent company. The company that is being controlled is referred a subsidiary.
In general, while analysing a company from the perspective of an equity analysis, consolidated statements are generally preferred over stand-alone financials. That is because the later provides a more holistic picture of the group performance.
However, sometimes there may be situation that prevents a subsidiary company from distributing dividends to the parent company. This can arise when the subsidiary company is located in geography that has strict capital controls or where the subsidiary company has agreed under a debt covenant to not pay any dividend to its shareholders. In such scenario, it is also important to analyze the stand-alone financial position of the parent company to understand whether it can fend for itself in times of crisis.
SEBI Regulations: SEBI regulations require listed companies to publish consolidated financial statements on an annual basis. Further, it also mandates listed companies to publish stand-alone financial results on a quarterly basis. Even though it is not mandatory, some companies voluntarily publish their consolidated financial statement on quarterly basis.
Equity analysts find it challenging to analyze groups which do not publish consolidated quarterly numbers. Since time gap between two annual reports are almost a year, analysts will have to often contend with dated information if consolidated quarterly numbers are not filed.
8.3. Balance Sheet
The format for balance sheet is prescribed under Schedule 3 of Companies Act 2013. In addition, IndAS 1 requires that companies should also report changes in shareholder's equity, which shows the various movements in shareholder's equity.
The format prescribed by Companies Act is applicable for all industries except those that have separate requirement as per the regulators of the respective industry. Thus, banking, insurance and utility companies follow a different format prescribed by the respective industry regulators. The exhibit below shows the consolidated balance sheet of Bharti Airtel Limited for the financial year ending 31-March-2019.
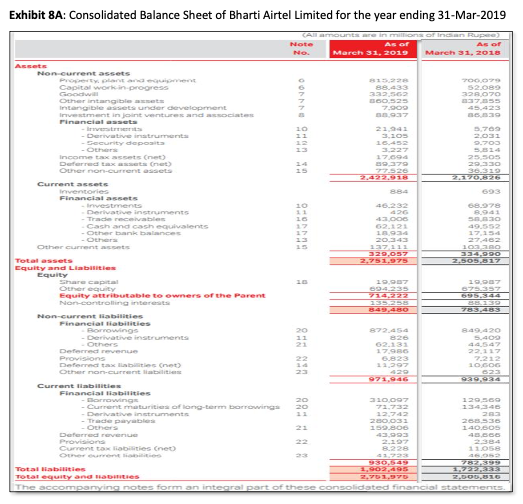
Exhibit 8A: Consolidated Balance Sheet of Bharti Airtel Limited for the year ending 31-Mar-2019
8.3.1 Common Balance Sheet Line Items
Assets:
Assets represents items that are expected to provide future benefits. However, as per the generally accepted accounting principles, a company can recognize only those assets which are quantifiable in monetary terms and have been paid for. In general, an entity cannot recognize self-generated assets such as own brand name.
The assets of a company are classified into current assets and non-current assets:
- Non-current asset represents assets that are likely to give benefits over the long term. In general, all assets other than current assets (explained below) are non-current assets.
- Current asset represents assets that are likely to benefit the organization within one operating cycle. In most cases, the tenure of the operating cycle is taken as one year.
These assets are further broken down as follows:
Non current assets
Property, Plant and Equipment (PPE): These include assets such land, building, machineries, furniture, computers and other similar items. These assets are shown at historical cost (net of accumulated depreciation). IndAS 16 allows a company to use a revaluation-based model, where the assets are periodically revalued and shown at revised value. The choice to apply revaluation method should be applied for an entire asset class. In the above exhibit, the value of PPE as on 31-Mar-2019 was Rs.815.2 billion.
Capital work in progress: These represent PPE that are currently under construction i.e., not ready for operation. When the assets are completed and are ready for operation, it is transferred to PPE.
Goodwill: Goodwill arises when a company acquires another business. It represents the amount of consideration paid by a company over and above the fair value of net assets taken over. For example, in FY 2018, Bharti Airtel acquired 100% stake in Tigo Rwanda Ltd for Rs.3,200 crores. However, the fair value of net assets of Tigo (assets – liability) was only Rs.2,838 crores. The balance was recognized as goodwill. Goodwill is generally considered as a fictitious asset as it cannot be sold independently. It is periodically tested for impairment and if its value in use is lower than its carrying value, the difference is written off as impairment.
In case if a company pays an amount lower than the fair value of asset taken over, that difference is taken to capital reserves.
Intangible assets: Intangible assets refer to assets that are generally in the form of a legal right. Acquired copy rights, patents and brand names are some examples of intangible assets. It is important to note that self-generated assets cannot be shown in the balance sheet. However, internally developed software programs can be recognized as asset. These assets are generally shown at cost minus accumulated amortisation.
Intangible assets under development: These represent intangible assets that are not ready for operation. Once they are ready, they are transferred to intangible assets.
Investment in joint ventures / associates: These represent the value of a strategic investment of a company that it does not control. These are reported under the "equity method" in which the value of investment is measured by multiplying the fair value of equity of such investees by the percentage of stake held. In addition, the value shown would also include the initial goodwill at the time of acquisition less any subsequent impairment. This line item is included only in consolidated financial statement.
Non-current financial asset: These include investments, loans, advances, and financial claims that are likely to be received in the long term. Items in the nature of debt which are held to collect interest and principal are typically recognized at amortised cost. Other assets are shown at their fair market value.
Current Assets:
Inventory: Inventory includes the value of raw material, work-in-progress, and unsold finished goods at the end of the reporting period. These are shown at cost price or market value, whichever is lower.
Current Financial assets: These represent cash, cash equivalents, bank balances, short term investments, receivables and other financial claims that are likely to be received within one year.
- Cash and cash equivalents: It includes cash, balances in current accounts, short-term bank deposits and money market investments.
- Bank balance: Includes balances in all bank accounts other than those included in cash equivalents.
- Receivables: Represents amount receivable from customers. They are shown net off provision for doubtful debts.
- Investments: Represent value of short-term investments and are shown at fair market value.
- Others: Any other claim that is likely to be received within one year.
Other current assets: Represents other assets that are likely to provide benefits within the next one year. These include prepaid expenses or any such assets where the benefit is likely to be received in kind i.e., as goods or service rather than as cash or equivalents.
Equity:
Equity represents the residual interest in a company, which belongs to the owners of the company. It represents the value of assets minus liability. It has several sub-components. The breakdown is not necessarily of significant concern to financial analysts on most occasions. But analysts who are concerned about the company's ability to distribute cash flows to the shareholders would need to observe the break-down.
Share capital: Represents the face value of the paid up share capital of the company
Share premium: Represents the amount received towards paid up capital that is over and above the value of shares.
Retained earnings: Refers to the total amount of profit and other comprehensive income earned by a company that has not been distributed as dividend or set aside for any other purpose.
General reserve: Represents the part of retained earnings which a company has set aside for utilising in future for any specific purpose.
Capital reserve and revaluation reserve: Represents the surplus arising out of recognizing asset at values above its acquisition price. These serves are typically not available for distribution of dividend.
Minority interest or non-controlling interest: Represents the share of equity of a subsidiary company that belongs to third-party shareholders. This line item is present only in consolidated financial statement.
Non-current liabilities:
It represents obligations of the company that have been fulfilled after one year. There are many liabilities that fall under this category.
Long Term Debt: Represents amount repayable towards borrowings, in the form of loans, or in the form of debentures/bonds/notes that are due beyond one year. Some portion of the long term may fall due within one year. Such portion of long term debt is shown separately as current portion of long term debt. In the exhibit shown above, Bharti Airtel has reported Rs.872.45 billion as long term debt. But it has also included another Rs.71.732 billon as current portion of long term debt, which is classified as a current liability. Further, accrued interest is shown separately. More details about the company's debt were included in the notes to accounts.
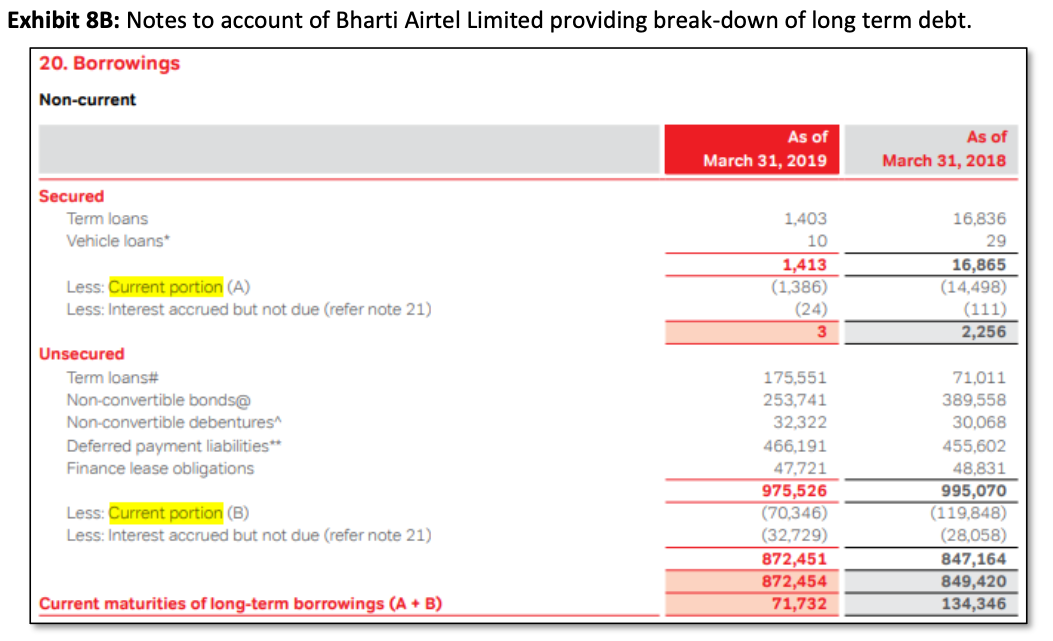
Exhibit 8B: Notes to account of Bharti Airtel Limited providing break-down of long term debt.
Lease liability: Whenever a company signs a lease on any asset for a period that is more than one year, the company has to recognize a lease liability. This represents the fair value of the lease minus the amount repaid (excluding the interest component). In case if it is not possible to determine the fair value of the lease, the company can calculate the same as present value of the lease payments payable.
Analysts often would consider the lease liability on balance sheet as part of Debt obligations.
Derivative instruments: The amount shown on the liability side represents mark to market losses arising on account of derivative contracts. Losses on contracts that have to be settled after a period of one year are included as part of non-current liabilities on the other hand, losses on account of contracts that have to be settled within one year are shown under current liabilities.
Other long-term financial liabilities: Represents any other obligation that has to be paid in monetary terms beyond a period of one year.
Deferred revenue: It represents the value of future obligation to be provided towards a revenue transaction that has already happened. For instance, if a customer buys a 6-month prepaid pack for Rs.1,200 and has another 5-month validity left, then the company should recognize Rs.200 as revenue for the first month and need to show Rs.1,000 (1,200 * 5/6) as deferred revenue. Deferred revenue towards obligation that needs to be performed after one year is classified as non-current liability while those obligations that need to be performed within one year is recognized as current liability.
Provisions: Provision represents amount set aside for a liability which is yet to be fully quantified. Unlike reserves, which are set aside for unknown purpose, provisions are amount set aside to meet a specific obligation. However, company may not be able to fully quantify it. The most common example is provision for retirement benefit obligation payable to their employees at the time of their retirement. Other examples include provision towards warranty obligations, provision towards legal liability that is yet to be adjudicated. Provisions towards obligations that have to be met beyond one year are included under non-current liability.
Current Liabilities:
It represents obligations of a company that it needs to fulfil within one year. A company has several obligations that need to be performed within one year.
Payables: It represents that amount payable to suppliers of goods and services.
Short-term debt: Short term debt are those that are borrowed for a period less than one year. Although, theoretically, short-term debts are due within one year, many of the short-term debts are typically rolled over or refinanced. Thus, companies tend to carry their short-term debts longer into the future.
Some of the other current liability for a company includes the following:
- Short term provisions
- Current portion of long-term liability
- Deferred revenue
- Advanced from customers
- Unpaid expenses and expense accrued but not due
8.3.2 Balance Sheet Metrics
Balance sheets most often fail to properly reflect the fair value of assets on account of certain accounting concepts and conventions such as historical cost concept and money measurement concept. Further, the standard categorisation of balance sheet line items may not be suitable for all types of analysis. Therefore, analysts often compute additional metrics.
Total debt: Debt are obligations that are settled through cash and involve interest that are given as compensation for time value of money. To that extent, debt is different from all other liabilities. Therefore, analysts may need to identify the total value of debt. This is calculated by summing long term debt, current portion of long term debt, short term debt, financial lease obligations and accrued interest. In the case of Bharti Airtel, it had a consolidated debt of Rs.12.87 billion as shown below (Refer Exhibit on balance sheet and notes on borrowings)
| (in INR million) | 31-Mar-19 | 31-Mar-18 |
|---|---|---|
| Secured loans (including accrued interest) | 1,413 | 16,865 |
| Unsecured term loans | 1,75,551 | 71,011 |
| Non-convertible bond | 2,53,741 | 3,89,558 |
| Non-convertible debentures | 32,322 | 30,068 |
| Financial lease obligation | 47,721 | 48,831 |
| Deferred payment obligation | 4,66,191 | 4,55,602 |
| Short term borrowings | 3,10,097 | 1,29,569 |
| Total debt | 12,87,036 | 11,41,504 |
Working capital: Working capital refers to the amount of money that is locked in day to day operations of the business. It is often calculated as currents assets minus current liabilities. As per the balance sheet of Bharti Airtel Ltd shown in Exhibit 8D, its working capital was negative Rs.601.49 billion (Current assets of Rs.329.06 billion and current liability of Rs.930.55 billion)
Core working capital: The current assets of a company often include short term investments, which are not necessarily meant for business operations. Similarly, current liability of a company includes many short-term obligations which do not necessarily arise out of day to day operations (example: current maturity of long-term debt). Therefore, calculating working capital as difference between current assets and current liabilities is misleading. Therefore, analysts compute a core working capital, which only factors in current assets that are used or arises out of core operations. Often, it is calculated as inventory plus trade receivables minus trade payables.
The core working capital for Bharti Airtel at the end of FY 2019 was negative Rs.2.36 billion as shown below.
| 31-Mar-19 | 31-Mar-18 | |
|---|---|---|
| Inventory | 884 | 693 |
| Debtors | 43,006 | 58,830 |
| (-) Payables | -2,80,031 | -2,68,536 |
| Total debt | -2,36,141 | -2,09,013 |
8.4. Basics of Profit and Loss Account (P/L)
Profit and Loss statement (P/L) statement or income statement provides the financial performance of a firm for a given period. In India, the Schedule III of Companies Act, 2013 prescribes the format for P&L account. However, IndAS 1 requires that the profit and loss statement should mandatorily include other comprehensive income. Accordingly, items contributing to other comprehensive income are shown below the net profit.
The format applicable for banking, insurance and utility companies are prescribed by the respective regulators and they need not follow the format given in Schedule III.
The following exhibit shows the consolidated profit and loss account statement of Bharti Airtel Ltd for year ending FY 2019 as an example. Profit and loss statement tend to look different for different industries as the nature of income and expenses may vary.
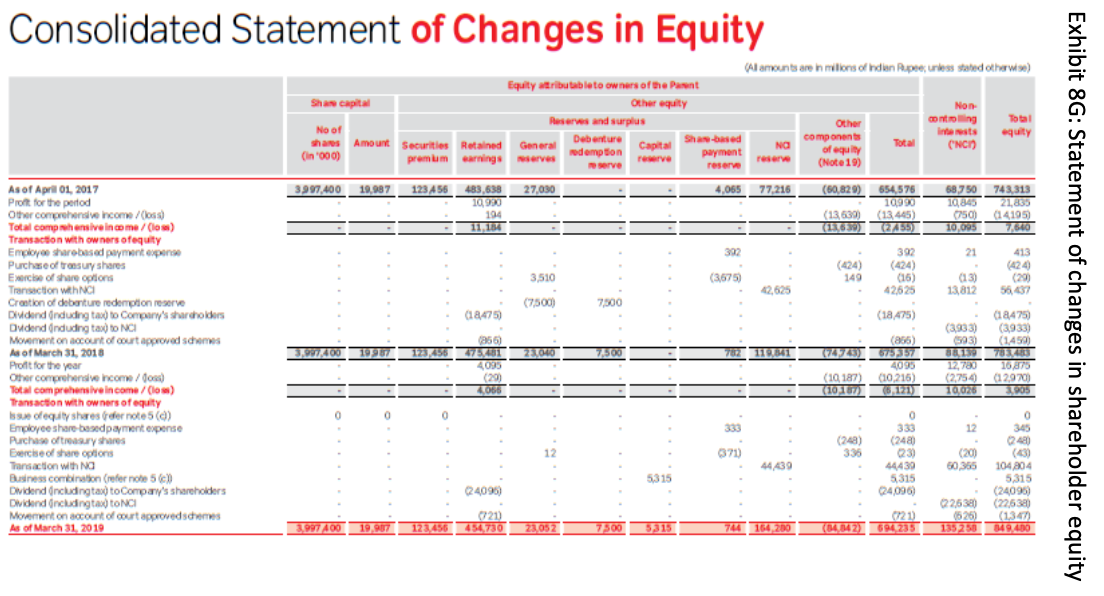
Exhibit 8E: Profit and loss account of Bharti Airtel Ltd for Financial Year ending 31-March-2019
8.4.1 Common profit and loss account line items
Revenue: Revenue represents the amount earned by a company by selling goods and services. It includes income from sources that are part of its core operations or are incidental, thereto. Some companies show income from core operations as revenue and income that are incidental to core operations as other operating income.
Other income: Other income typically include non-operating income such as income from investments or profit or sale of assets. However, in the case of Bharti Airtel, it has reported other income separately below the operating profit line.
Expenses: The expenses reporting varies based on the nature of industry. Common line items that exist irrespective of industry include employee cost, depreciation, and finance charges. In the case of manufacturing industries, companies report three more standard line items being (i) Cost of raw materials (ii) Purchase of stock-in-trade (iii) Change in inventory of finished goods. Expenses that are not separately disclosed are included as part of other expenses.
India vs Global Reporting: An interesting difference in financial reporting between India and rest of the world is that in India are expected to be general purpose statements while many other parts of world expects them to cater primarily to investors. This makes expense reporting in India vary significantly compared to rest of the world. In Indian financial statements, some line items such as raw materials have higher level of disclosures requirement while in some cases, such as other direct expense, the disclosure requirements are lower. This, in turn, creates certain challenges. For example, while raw material costs are disclosed, other components of direct costs are not directly disclosed. This creates challenge in calculating gross profits.
The following provides explanation on various expenses reported in profit and loss account.
Cost of raw materials: This represents the amount of raw material consumed in the production process. For companies that follow periodic inventory accounting system, the same is computed as Purchases plus opening stock of raw materials minus closing stock of raw materials.
Purchase of stock-in-trade: This represents amount spent towards purchase of goods that are sold to customers without any additional processing. Thus, most of the purchases in the retail sector would be shown under this head.
Changes in inventory of WIP and finished goods: As per the generally accepted accounting principles expenditure incurred towards production of goods is retained in inventory until the goods are disposed. This line item represents the difference between opening balance and closing balance of work-in-progress and finished goods.
Employee cost: Employee cost represents salaries, benefits, notional expenses towards stock- based compensation granted and staff welfare expenditure incurred towards employees. The cost includes an annual provision towards retirement benefits earned by employees during that year.
Depreciation and amortisation: Depreciation refers to gradual and permanent reduction in value of assets on account of ageing, use and obsolescence. Depreciation can be accounted under many methods. IndAS 16 requires that the method of depreciation take into consideration the way the asset is used. Thus, a cab operator may depreciate its fleet based on the amount of distance a car can travel in its lifetime while another company may depreciate based on its useful life measured in years.
Amortisation: It refers to gradual write-off of intangible assets over the period of its life. Most companies write-off assets.
Finance cost: Finance charges refer to expenditure incurred towards interest, processing fee and amortisation of expenses incurred towards security issuance.
Other expenses: Expenses that are not independently large are often combined and classified as other expenses. Companies provide notes to accounts that give more detailed disclosure on the same.
Income from equity accounted entities: This refers to the company's share of profit of an entity which is accounted under the equity method (refer to Investment in Joint Ventures / Associates in section 8.3)
Exceptional items / non-recurring items: These refers to income or expenses that do not normally arise under normal course of business. They include loss on account of natural calamities, one-time regulatory charges and such other items.
Tax: Tax expense of an Indian company include three components: (i) Current tax, (ii) MAT and (ii) Deferred tax.
Current tax represents tax payable for a given year, other than MAT. MAT paid can be utilised as credit for future. Thus, in theory, MAT paid should be shown as asset in the balance sheet. However, if a company believes that it may not be able to get credit for the MAT paid within the allowed duration, they expense it in profit and loss account.
Deferred tax income or expense has no cash impact but it arises out of accounting treatment given to recognize future tax benefits or obligations that arises on account of an event that has occurred in the past.
Profit allocated to Non-controlling interest (minority interest): This refers to the amount of profits of a subsidiary company that belongs to external shareholders of the subsidiary.
Earnings per share (EPS): EPS is calculated by dividing the net profit attributable to equity shareholders by the average number of shares outstanding. In terms of EPS, a company discloses Basic EPS and Diluted EPS.
Basic EPS: Basic EPS is calculated by dividend net profit by the weighted average number of shares outstanding.
Diluted EPS: Diluted EPS assumes that any instrument that can be potentially converted into equity shares without payment of full consideration is indeed converted. Thus, it assumes that in the money warrants, ESOPs and convertible instruments are converted into equity. The potential impact of such exercise/conversion on the profit and loss account are also factored. Diluted EPS is then calculated by dividing the adjusted net profit number by the diluted share count. For loss making companies, diluted EPS and basic EPS are one and the same.
Other comprehensive income (OCI): Other comprehensive income refers to income or expense that are required or permitted to by-pass profit and loss account. It mostly comprises of change in value of assets and liabilities on account of non-operating factors. They include the following:
- Changes in revaluation surplus
- Re-measurement gain/(loss) on defined benefit plans
- Gain/(losses) arises on account of translation of financial statement of foreign operations
- Changes in fair value of financial assets or liabilities that are accounted through OCI
- Gain/(loss) on account of derivative contracts that effectively hedge risk
Part of the OCI of subsidiary operations that belong to its external shareholders should be allocated to non-controlling interest (minority interest).
8.4.2 Key metrics from profit and loss account
A detailed analysis of profit and loss account involves calculating several profit metrics in addition to what is profit before tax and net profit.
Most companies present a "single step" profit and loss account. In a single step profit and loss account, companies add all their incomes and from that they reduce all their expenses to calculate profit before tax. However, some companies choose to present a multi-step profit and loss account. In the exhibit shown above, Bharti Airtel has presented multi-step profit and loss account where operating profit before taxes, depreciation and non-operating items (commonly referred as EBITDA) is calculated. Other expenses are reduced from that.
However, even in cases where a company does not present a multi-step statement, analysts tend to convert them into multi-step statement for the purpose of analysis. The following exhibit shows a profit and loss account of Bharti Airtel Limited redrawn by an analyst to capture some more profit metrics. Note that in the below exhibit the analyst has used positive sign to denote income and negative signs to denote expenditures.
| (in INR million) | For financial year 2019 | 2018 |
|---|---|---|
| Revenue | 8,07,802 | 8,26,388 |
| Other operating income | 2,912 | 2,488 |
| Total revenue | 8,10,714 | 8,28,876 |
| Network operating expenses | (2,23,900) | (1,97,520) |
| Access charges | (93,521) | (90,446) |
| Licence fee/ spectrum charges | (69,426) | (75,558) |
| Employee benefit expenses | (37,975) | (39,771) |
| Sales and marketing expenses | (41,277) | (45,275) |
| Other expenses | (83,514) | (77,027) |
| EBITDA | 2,61,101 | 3,03,279 |
| Depreciation and Amortisation | (2,13,475) | (1,92,431) |
| EBIT | 47,626 | 1,10,848 |
| Finance costs | (1,10,134) | (93,255) |
| Finance income | 14,240 | 12,540 |
| Non-operating expenses | (1,894) | (141) |
| Share of profit of associates and JVs | 3,556 | 10,609 |
| Profit before tax and exceptional items | (46,606) | 40,601 |
| (-) Exception items | 29,288 | (7,931) |
| Profit before tax | (17,318) | 32,670 |
| Less: Current tax | (19,391) | (18,230) |
| Less: Deferred tax expense | 53,584 | 7,395 |
| Profit after tax | 16,875 | 21,835 |
| (+) Exception items | (29,288) | 7,931 |
| (-) Tax impact on exception items | - | (2,630) |
| Adjusted profit after tax | (12,413) | 27,136 |
| Effective tax rate | Not meaningful | 33% |
Gross profit: It is calculated by reducing the cost of goods sold from revenue. It is a suitable metric for manufacturing business. It refers to the surplus that a company can use to meet its fixed expenses. In case of Indian companies, since they do not disclose direct costs separately (except cost of raw materials) it is not possible to calculate this metric.
Earnings Before Interest Tax Depreciation and Amortisation (EBITDA): Net profit of a company is affected by interest expense, and depreciation and amortisation. Interest expense is driven by the funding choice of the company while depreciation and amortisation are driven by accounting choices (in terms of methodology and estimates of useful life). Similarly, companies may also earn certain investment income or other non-operating income which are again driven by choice of the treasury management. All these items affect a proper comparison of operating performance between two companies. Further, these items also cause tax impact. Therefore, analysts prefer to compute adjusted EBITDA which is computed without taking any of those line items.
EBITDA also serves a proxy for cash profit earning by operations.
Earnings Before Interest and Taxes (EBIT): Although EBITDA is a useful metric, it omits to factor in impact of capital expenditures completely. Some capital expenditures are recurring in nature (for example, purchase of computers and other assets with short shelf life). Therefore, ignoring such expenditure may give misleading results. Therefore, analysts compute EBIT, which takes into consideration depreciation and amortisation as expenses. Most analysts also refer to EBIT as operating profit. However, since these metrics are not defined by accounting standards, multiple interpretations of operating profit exist.
Adjusted profit after tax: Exceptional items and non-recurring items affect comparability of net profit numbers. Therefore, analysts often tend to calculate adjusted net profit which eliminates the impact of these exceptional items. While calculating the impact of exceptional items on net profit, it is also necessary to factor in their tax impact. This is typically done by multiplying the exceptional item with the effective tax rate (calculated as tax expense divided by net profit).
Often, adjusted profit calculation may involve some arbitrary adjustment that requires an analyst judgement as all the necessary numbers may not be available. For instance, the effective tax rate for Bharti Airtel for FY 2019 is meaningless as the company has paid huge taxes despite reporting losses. Under these circumstances analyst may have to take a judgement call on how to factor in tax impact.
8.5. Statement of changes in shareholder's equity
IndAS 1 requires companies to present a statement of changes in Shareholder's equity to show the impact of various types of transactions on various components of shareholder' equity. The following exhibit shows the statement as presented by Bharti Airtel in its annual report for 2019.
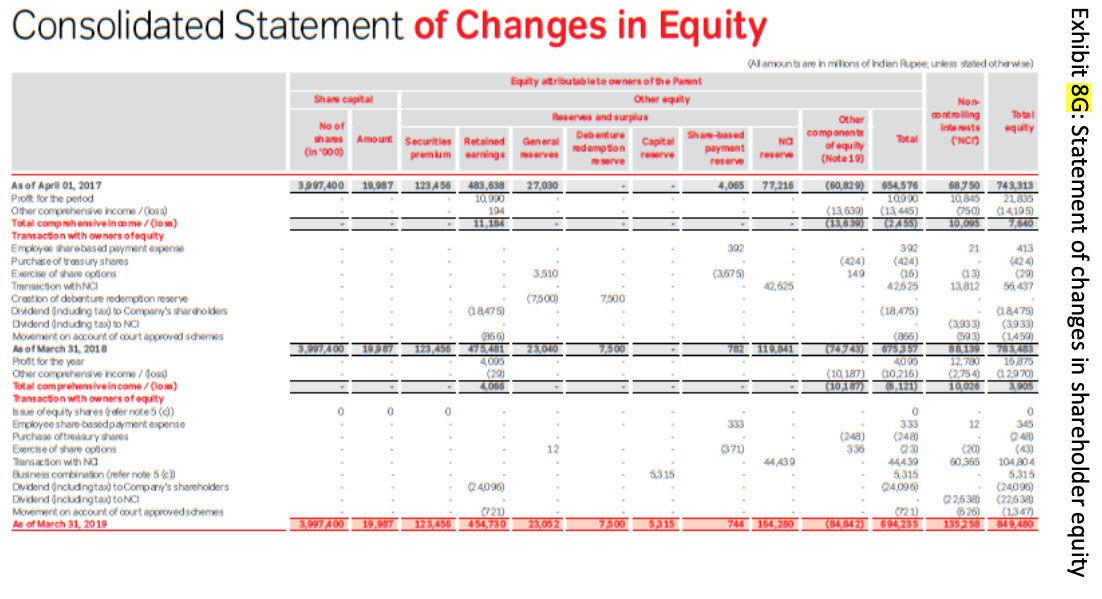
Exhibit 8G: Statement of changes in shareholder equity
8.6. Basics of Cash Flows
Generating cash is critical for a firms' long term survival. Profit and loss statement and Balance Sheet do not focus on cash flows since accounting is on accrual basis. Under accrual basis, income is recognized when it is earned rather than when it is received. Similarly, expenses are recognized when it is incurred rather than when it is paid. This creates difference between the profits shown and the actual cash flow generated.
Cash vs Profit Example: Let us take an example. If a business does all cash purchase of say Rs. 80,000 and cash sales of Rs. 100,000, there would be profit of Rs. 20,000 and business would be able to touch that cash as money has already come in. However, think of this business where purchase is done on cash and sales is done on credit; the P/L statement would show a profit of Rs. 20,000 but the fact is that there is no money. Indeed, if the business is not able to collect the dues from its customers, there will be no profits and even the capital of the company, Rs.80,000 is likely to be lost. Therefore, along with the P/L statement and Balance Sheet, the cash flows generated by a business also need to be assessed. In absence of cash, while there may be profits, they would be more paper profits and not the real profits.
To understand the concept further, there are cash inflows and cash outflows in every business as money comes in and money goes out. For simplicity and understanding purpose, cash flows are broadly divided into following three categories:
- Operating cash flows – Cash flows from business operations (P/L items). Incoming cash is positive and outgoing cash is negative. The net profit of a company can be converted into the operating cash flow number by adding back non-cash expenditures such as depreciation and amortization and changes in account receivables and payables.
- Investing cash flows - Cash flows on account of assets (B/S items). Buying assets is negative cash flow and selling assets is positive cash flow.
- Financing cash flows – Cash flows on account of liabilities (B/S items). Borrowing money or issuing/expanding equity is positive cash flow and redeeming debt and/or equity is negative cash flow.
The following exhibit reproduces cash flow statement of Bharti Airtel Limited as shown in their 2019 annual report.
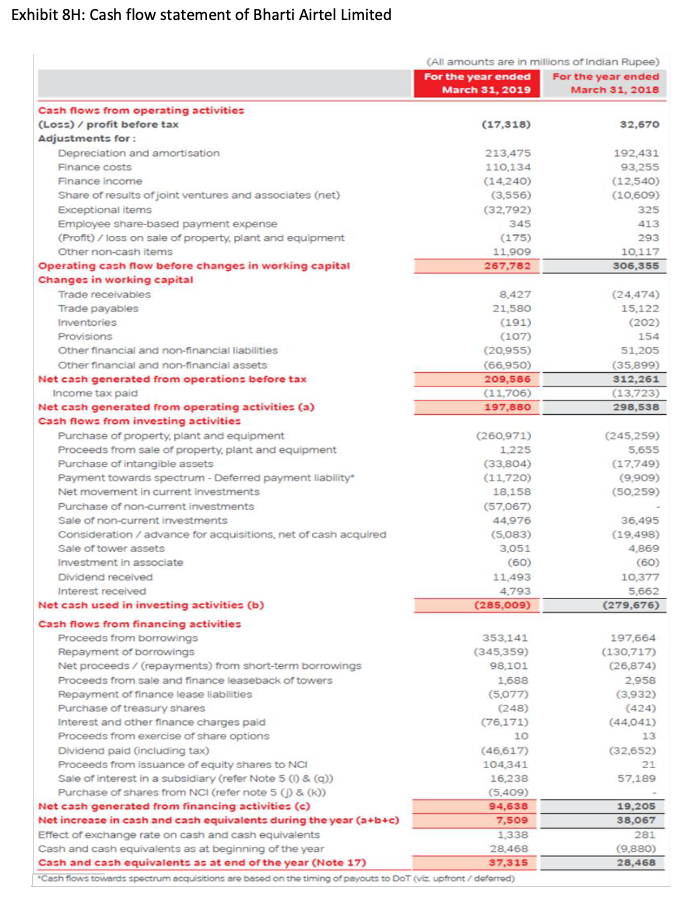
Exhibit 8H: Cash flow statement of Bharti Airtel Limited
Warning Signs in Cash Flows: If a business is continuously running negative operating cash flows for several years, there is an alarming signal of risk. A business, which is continuously running negative operating cash flows would need continuous doses of stimulus in terms of cash (borrowing or equity expansion) to keep going. Needless to state that over a period of time, either it will turn into a positive operating cash flow business or die down in the absence of cash stimulus (when investors and/or lenders refuse to pump in further cash).
Case Study: Kingfisher Airlines - Kingfisher Airlines had negative operating cash flows for years. Here are the financials of Kingfisher Airlines:
| March 2013 12 months |
March 2012 12 months |
March 2011 12 months |
March 2010 12 months |
March 2009 12 months |
|
|---|---|---|---|---|---|
| Net Profit Before Tax | -4301.12 | -3446.09 | -1520.78 | -2417.92 | -2155.21 |
| Net Cash From Operating Activities | -1390.86 | -885.55 | -2.23 | -1665.09 | -645.78 |
Source: moneycontrol.com
The Airline was borrowing money to pay interest as EBIT was much lower than interest obligations for several years in the past. At a point in time, it stopped as lenders refused to pump in further cash and the business did not turn positive operating cash flow even after infusion of capital. It should be clear that no business can run on continuous expansion of borrowed money.
Whenever a business is expanding, it would need cash. Negative investing cash flows are financed through either positive operating cash flows or accumulated positive operation cash flows (bank balance) or positive financing cash flows (borrowing and issuance of equity). Businesses that depend excessively on borrowed funds for expansion have to be seen with caution. The assets that appear in the balance sheet may realize lower than their book value as shown in the B/S but the liabilities have to be met in total.
Some of the points to be kept in mind in case of cash flows are:
- Looking at net cash flows could be deceptive
- Each of the cash flow streams Operating, Investing and Financing have to be analysed independently.
- The objective of cash flow analysis has to be to focus on sustainable and recurring cash flows
- Non-recurring / extraordinary items that impact the cash flows should be recognized and adjusted
8.7. Notes to accounts
In addition to the four statements mentioned above, companies also have to give a detailed notes specifying their accounting policies and providing details of information contained in the four statements.
Among other things, it includes the following:
8.7.1 Significant accounting policies
There are multiple ways to account for an item and it is critical for an analyst to know what methodology the company has adopted to account for an item. For instance, for depreciation, companies may choose between straight line method of depreciation or the written down value method of depreciation. Accounting policies of the company, as defined in the Annual Report, would define how that item is treated by the company.
In other words, accounting policies are the way a company accounts for various items in P/L statement and Balance Sheet. Accounting policies are important for an analyst to understand as there are different ways of accounting for a single item and analysts should know how a particular business is treating that item. Companies are also required to mention clearly if there is any change in the accounting policy in comparison to previous year. If a company is continuously changing its accounting policies, it may be a reason for suspicion and a closer scrutiny of whether that company is trying to manipulate the financials.
8.7.2 Contingent Liabilities
Contingent liabilities are liabilities that may be incurred by an entity depending on the outcome of an uncertain future event. For example, a company may be fighting a court case, which may result into substantial loss for the company, if the case is lost. These liabilities are not recorded in a company's accounts and generally recorded in the notes to accounts. Prominent examples of contingent liabilities are:
- Outstanding lawsuits
- Disputes with Tax Authorities
- Bank Guarantees provided
- Product Warranty Claims
- Pending Investigations or cases
- Change in FX, Govt Policies etc
While most of the managements would always be positive and state that they don't see the liability settling against them, one is always better of looking at the quantum specially in comparison to the size of P/L statement and its Balance Sheet. If size of the contingent liabilities is large in comparison to the P/L statement and Balance Sheet of the business, one needs to exercise caution while analysing the business.
Off-Balance Sheet Items:
Simply stating, any asset or liability that does not appear on a company's balance sheet is an off-balance sheet item. For example, loans taken are part of liability in the books of the company, operating lease, which is an alternative way of financing an asset is an off-balance sheet item. Contingent liabilities, as defined above, are also off-balance sheet items. Similarly, if a company has entered into a derivative contract to trade or hedge its position that will not appear on the Balance Sheet and would be covered as a note to accounts in the Annual Report. Given that existence of so many businesses worldwide has been threatened by the derivative transactions, it is critical for an analyst to analyse all the off-balance sheet items in great details.
While positive surprises in terms of off-balance sheet items are fine, negative ones are the risks and should be dealt with in a great detail by the analysts.
8.8. Important Points to Keep in Mind While Looking at Financials
Key Warnings for Analysts:
Financial statement analysis can be intimidating if the terminologies are not known, however, the same numbers become addictive if the language is understood.
Numbers can be made to look good by making assumptions or by creative accounting. Qualifications of auditors in notes to accounts (the fine print) are a very useful part of the annual report.
Change in accounting period can lead to confusion while comparing previous years' numbers. Similarly, off items can increase or decrease profits and if these are not studied properly, the entire analysis can change.
Consistent performance year after year is what is best for the investors. A company which continues to grow in sales, increase profits, increase Net-worth, reduce debt, improve margins and finally improve Return on Net-worth (RONW) for the investors is one which will create value over the long term.
8.9. Reading audit report to understand the quality of accounting
A company's management is responsible for preparing the accounts. The auditors verify the accounts to ensure that the financial statement presents a true and fair view of the accounting. It is important to note that auditors' opinions are based on the information provided to them.
The nature of the audit engagement is such that auditors would not be able to vouch for the accuracy of the accounting. Several factors are responsible for this. Firstly, the amount of transaction that happens in a company is significantly large. Thus, it is impossible for auditors to check whether all the transactions were completely and accurately accounted.
Therefore, auditors verify whether the company has adequate control systems in place to prevent major issues in correctly and accurately capturing and recording a genuine transaction. Once they are satisfied, they check whether these control systems were properly implemented. After they are satisfied with the working of the control system, they assess whether the company has followed all accounting standards and principles in measuring and disclosing the line items.
Based on their assessment, they provide their report, which can fall under any of the following categories:
- Clean report – A clean opinion is given when auditors have no issues with the report. Typically, the format and content of a clean report is fairly standard and they mostly look the same across companies. Only certain financial information presented in line with Companies (Auditor's Report) Order may vary.
- Disclaimer – Auditors provide disclaimer when they are unable to verify any part of the financials on account of non-availability of information.
- Qualified report – A qualified report is given when the auditors are convinced that whole or part of the financial statements do not reflect true and fair view. These may arise when auditors disagree with the accounting policy being followed by the company or if they believe that there are some other serious discrepancies in the financial statements.
In the case of disclaimer of opinion or qualified reports, auditors would elaborate on the reason for providing such a report.
Critical for Analysts: While reading the financial statements, the analyst should go through the auditor's report to check whether the auditors have had any reservations.
8.10. Financial statement analysis using ratios
Financial statements provide critical information that need to be used for fundamental analysis. However, the information on its own may not mean a lot unless we juxtapose it with some other data.
For instance, Bharti Airtel earned an operating profit (EBIT) of Rs.47.62 billion during FY 2019. This number looks fairly large. However, if we compare this number with their revenue of Rs.807.8 billion, the operating profit looks relatively very small. Similarly, if we compare the operating profit number with their interest expense of over Rs.110 billion, it becomes clear that their profit was way too inadequate to even service the interest expense.
Thus, comparing a financial line item with another related data point can provide better insight than reading the number on its own. This is where ratio analysis becomes useful.
Ratio analysis involves expressing one financial statement line item as a percentage or as a multiple of another related line item.
Ratio analysis is done for the following three purposes:
- Descriptive studies: Ratio analysis helps us add more perspective while describing financial statements. For example, instead of merely saying that Bharti Airtel earned an operating profit of Rs.47 billion, it would be helpful to add that the operating profit is 5.8% of the revenue. It gives the reader the sense of proportion.
- Diagnostic studies: Diagnostic analysis helps us understand what worked or failed to work for a company.
- Predictive analysis: Ratio analysis also helps us study the behaviour of data, which can help us make an assessment of the future.
Example: Diagnostic Analysis of Bharti Airtel
Bharti Airtel experienced a revenue decline of around 2%. However, its EBITDA declined by around 14%. An analyst may need to identify the reason for such a disproportionate fall in revenue. In such cases, ratio analysis can help.
In the exhibit below, the analyst has computed all the expenses as a percentage of revenue. When computed, it is very clear that the biggest reason for the disproportionate fall is that network operating expense as percentage of sales went up significantly, compared to the previous financial year. Thus, we know that the main reason for fall in EBIDTA is the network operating expense which seem to moving up independent of sales.
| (In INR million) | For financial year 2018 | 2019 |
|---|---|---|
| Revenue | 8,26,388 | 8,07,802 |
| Other operating income | 2,488 | 2,912 |
| Total revenue | 8,28,876 | 8,10,714 |
| Network operating expenses | -1,97,520 | -2,23,900 |
| Access charges | -90,446 | -93,521 |
| Licence fee/ spectrum charges | -75,558 | -69,426 |
| Employee benefit expenses | -39,771 | -37,975 |
| Sales and marketing expenses | -45,275 | -41,277 |
| Other expenses | -77,027 | -83,514 |
| EBITDA | 3,03,279 | 2,61,101 |
Growth rates
- Revenue growth: -2.19%
- EBITDA growth: -13.9%
Expense as percentage of revenue
| Expense Item | 2018 | 2019 |
|---|---|---|
| Network operating expense | 23.8% | 27.6% |
| Access charges | 10.9% | 11.5% |
| Licence fee/ spectrum charges | 9.1% | 8.6% |
| Employee benefit expenses | 4.8% | 4.7% |
| Sales and marketing expenses | 5.5% | 5.1% |
| Other expenses | 9.3% | 10.3% |
8.11. Commonly used ratios
An analyst may compute, and study different ratios based on the nature of the company and the objective of the study. Quite often, analysts also study non-financial operating metrics such as capacity utilization rate or occupancy rate. The only thing that an analyst needs to ensure while working with ratios is that the two numbers being compared should be related in some way. Comparing completely unrelated numbers provide little to no insight.
Having said that, there are some common ratios that are often used in financial analysis and they are discussed below.
8.11.1 Profitability Ratios
Profitability ratios define how profitable the operations of the company are on per rupee of sales basis. It is evident that if the industry is very competitive and there are pricing pressures on the business, profitability will suffer. However, if the business is unique with significant entry barriers, or if it is an initial entrant in a sunrise industry profitability of the business would be high. A very high level of profitability will not sustain over a long period. With new entrants and competition, revenues and profits will moderate.
The profitability of a company can be evaluated at each level of P/L statement. The two main parameters of profitability are EBITDA Margin and Net Profit Margin (NPM) or Profit After Tax margin (PAT margin).
EBITDA Margin:
This ratio is useful in finding out the profitability of the company purely based upon its operations and direct costs.
A firm with a higher EBITDA margin, indicates that it is able to operate with greater efficiency than other peer group companies. The EBITDA margins are useful in identifying profitability trends in an industry since it is not affected by the depreciation policies, funding decisions and taxation rates of the companies.
In the case of Bharti Airtel, for FY 2019, the EBITDA margin is 32.2% (= 2,61,101/8,10,714), which is approximately 440 basis points lower than 36.6% for FY 2018.
PAT Margin:
Shareholders of a business get their dues only at the end, i.e. after paying all stakeholders, including the government. Hence, they would like to know how much of the business generated by the company actually comes their way. This is found by calculating PAT Margin.
A firm with a higher ratio is seen as more efficient in managing costs and earning profits. A trend of increasing margins means improving profitability.
In our example, PAT Margin is 2.1% (= 16,875 / 8,10,714) for FY 2019.
8.11.2 Return Ratios
While Profitability ratios give a sense of profitability per rupee of sales by the business, they do not communicate anything on the productivity of each rupee invested in the business. This part of allocation of capital and its productivity is captured through comparing profits with the capital employed in the business. Two important ratios to look at here are Return on Equity (ROE) and Return on Capital Employed (ROCE).
Return on Equity (ROE):
This is the single most important parameter for an investor to start digging for more information about a company. ROE communicates how a business allocates its capital and generates return. An efficient allocator of capital would have high ROE and a poor quality of business would have low ROE.
ROE, sometimes also known as Return on Net-worth (RoNW), is calculated as
Higher the ROE, better the firm.
ROE is further decomposed into 3 steps, known as Du Pont Analysis:
In other words, RoE considers the operating efficiency of the firm, the efficiency with which the assets are used by business to generate revenues and the financial leverage used by the business.
It is important to understand that while sales and net profit is for a given period, net-worth and asset balance are as at a particular date. In order to compare the two metrics, we should use the average net-worth during the period rather than net-worth as at a particular date.
Since daily balance of equity is difficult to obtain, the average balance is often calculated by taking average of opening and closing balances. The opening balance would essentially be the closing balance of previous year.
In our example, the average net-worth of Bharti Airtel for FY 2019 is Rs 8,16,485 [ = (8,49,486 + 7,83,483) / 2] and the ROE = 16,875 (PAT) / 8,16,485 (Net-worth) = 2.1%
Return on Capital Employed (ROCE):
This ratio uses EBIT and calculates it as a percentage of the money employed in the firm by way of both equity and debt.
Higher the ratio, better the firm since it is generating higher returns for every rupee of capital employed. Investors can use this to analyse the returns of companies with different sizes in the same industry.
Here again, for balance sheet items we take average values instead of year ending values.
| FY 2018 | FY 2019 | |
|---|---|---|
| Total equity (A) | 7,83,483 | 8,49,480 |
| Long term borrowings (B) | 8,49,420 | 8,72,454 |
| Short term borrowings (C) | 1,29,569 | 3,10,097 |
| Current maturities of long term borrowings (D) | 1,34,346 | 71,732 |
| Total capital (A+B+C+D) | 18,96,818 | 21,03,763 |
We have already shown its EBIT as Rs 47,626.
Thus, the ROCE for the company for FY 2019 is 2.38% [ =47,626 / Average of (18,96,818 and 21,03,763 )]. This is a pre-tax measure and analysts may want to multiply it with (1 – Tax rate) to arrive at post tax rate of return.
📋 Calculate All Financial Ratios with Live Company Data
You've just learned ROE, ROCE, DuPont Analysis, and profitability ratios. Now calculate these instantly with our professional-grade financial analysis tools!
🧮 Advanced Financial Ratios Analyzer
Calculate all ratios from Chapter 8:
- ROE & ROCE calculations
- DuPont Analysis breakdown
- Profitability Margins (Gross, EBITDA, PAT)
- Activity & Leverage ratios
📊 Complete Financial Reports
Study professional financial analysis:
- 71+ Company Reports with full analysis
- 44+ Financial Ratios per company
- Trend Analysis across years
- Peer Comparison within sectors
Practice with Real Data: Use the same ratios and analysis techniques taught in NISM Chapter 8 with live company financials!
8.11.3 Leverage Ratios
A high level of debt used in funding the operations can be risky for the business, especially in an economic downturn when revenues and profitability reduce. Leverage Ratios can be used to analyse the extent of leverage used by a business and its ability to meet the obligations arising from them. Two important parameters here are Debt/Equity ratio and Interest coverage ratio.
Debt/ Equity (D/E):
As discussed earlier, high levels of debt in a business can prove to be detrimental for a company. In absence of its ability to pay to the lenders, business may have to face bankruptcy. When businesses create assets aggressively out of borrowed money, it could be quite dangerous if the assets are unable to generate the expected revenues and profitability. The liability will still have to be met.
It would be prudent for investors to avoid companies with extremely high levels of debt. On a most conservative basis, a D/E of 1 or less should be considered as the benchmark, and then depending upon the industry, track record of the company, capital required, project details, should a decision be taken.
In our example, the D/E Ratio of Bharti Airtel for FY 2019 would be: 12,87,036 / 8,49,480 = 1.52X.
Interest Coverage Ratio:
Companies having high debt need to pay high interest as well. Whether a company is headed for a trouble can be simply seen by comparing its earnings with the interest (we are not talking about principal repayment yet). This ratio, popularly known as Interest Coverage Ratio, tells us how many times the earnings of the business is, vis a vis its interest obligation.
If this ratio is high, clearly, business is in comfortable zone. The ratio will be less than one or negative in some businesses, which means that earnings are less than interest or earnings are negative and interest obligations exist. As these businesses would be either borrowing money or infusing equity to run the show, these businesses may come into significant problems if they don't turn around soon. Kingfisher Airlines is one such example.
8.11.4 Liquidity Ratios
It is important to see whether a business is able to honour its obligations as and when they arise. Two simple measures for the same are current ratio and quick ratio:
Current Ratio:
This ratio measures the company's liquidity situation by comparing its current assets with its current liabilities. A ratio of more than 1 means that the company has current assets more than its current liabilities. This ratio is also known as Working Capital Ratio.
This ratio measures the ability of the company to meet its short-term liabilities. The elements that constitute the working capital of the company, trade receivables, inventory, trade payables, form an important component of this ratio. A high inventory of finished goods may mean that the sales are slowing down and high raw material inventory may mean poor production planning. High trade receivables will indicate that the company is selling on credit and not able to realize cash from its debtors. On the other hand, high trade payables may indicate the strength of the company in getting best credit terms from its suppliers. There are companies which take cash on sales and make payments on credit. Such a situation will result into a current ration less than 1, however, this is not a red flag. In fact, it is a very good situation in which the company's working is funded by the customers.
A high ratio may indicate poor use of working capital while a very low ratio may point towards deeper analysis.
In our example, Bharti Airtel's current ratio was 0.35 for FY 2019 (= 3,29,057 / 9,30,549).
Although, optically the ratio appears bad for the company, companies that have high bargaining power with customers and suppliers often manage, and in fact prefer, to have negative working capital as it is interest-free obligation.
Quick Ratio:
This is a more stringent version of the liquidity ratio as it does not consider assets, which although current in nature, but cannot be converted into cash immediately. Prominent example of such current assets is inventories.
Accounts receivable, cash, investments in liquid funds, are all included in calculating quick ratio.
Higher the ratio better the liquidity, but lesser will be the returns as cash is not a great source of generating returns.
8.11.5 Efficiency Ratios
It is important to see whether a business is efficient in its operations. Efficiency would also help business improve its capital allocation and so the profitability and return ratios. Some simple parameters of efficiency in a business are defined below.
Accounts Receivable Turnover:
This ratio indicates how fast company converts its sale in to cash. Higher the ratio, better the firm, as it means that very small portion of its revenues are in the form of credit. On the other hand, if the ratio is low, it means that the company is giving too easy credit or may be even facing difficulties in recovering money from its distributors/clients.
Accounts Payable Turnover:
This ratio indicates how much of a company's purchases are on credit.
As can be seen from the formula, if the payable is high (denominator), the ratio will be low. This means that the company is running long credit periods with its suppliers. It is difficult to conclude anything just looking at this number because long credit periods with its suppliers could be because it has good bargaining power with its suppliers or it does not have the money to pay to them. While bargaining power of company may let it take long credits from its suppliers, in long run, it may not be good as suppliers would not like the situation. Indeed, good companies generally focus on paying on timely basis as much as they focus on receiving money on timely basis.
Asset Turnover:
This ratio indicates how many times assets of the business are churned / put to use to generate revenues for the business. Clearly, if assets are lying idle, that is not good for the business as capital is deployed but it is not generating revenue. On the other hand, if asset is continuously churned / put to use to produce goods and services, it would improve the revenues and the profits. Therefore, higher the ratio, better the firm.
This ratio is also used in Du Pont Analysis, which is used to decompose the ROE to get even better understanding of the company's drivers.
Inventory Turnover:
This ratio gives the number of times inventory is rolled over by a company. Hence, higher the ratio, better is the business. Inventory, if not converted into sales fast, would mean money is locked in the business. Also, perishable goods may start deteriorating if inventory is not turned into sales fast. This ratio would be high for FMCG companies whereas low for capital goods companies.
8.12. Dupont analysis
When studying ratios, analyst often try to synthesise by reading various ratios together to see if it provides any additional insight. For instance, if sales are growing but the collection period is increasing along with it, it probably indicates that the company is being very lenient with its credit terms in order to boost sales.
One of the popular frameworks that synthesizes ratios is the Dupont analysis. It breaks return on equity into multiple components in order to understand how various factor contribute to ROE. It can also be used to do diagnostic study to understand fall or rise in ROE.
Dupont analysis breaks ROE as follows:
As you can see, the above equation expresses return on equity as a product of three factors: (i) Net profit margin, (ii) Asset turnover ratio and (iii) Leverage.
Thus, ROE can go up either if profit margin increases, or the asset turnover ratio (i.e., efficiency) goes up or because of higher leverage. If ROE goes up on account of higher margin or higher efficiency, it would certainly be a reason to cheer. However, if it increases on account of higher leverage, it need not be a reason to cheer as higher leverage also brings in higher risk.
DuPont Analysis Example: Let us use the following example to understand the relevance of this analysis.
| HighLevCo | LowLevCo | |
|---|---|---|
| Revenue | 12,000.0 | 11,800.0 |
| Net profit | 2,400.0 | 2,620.0 |
| Assets | 5,200.0 | 5,000.0 |
| Equity | 2,600.0 | 5,000.0 |
| Liability | 2,600.0 | - |
| ROE | 92.3% | 52.4% |
| Asset Turnover ratio | 2.3x | 2.4x |
| Net profit margin | 20% | 22% |
| Asset/Equity | 2.0x | 1.0x |
In the above, two companies, HighLevCo and LowLevCo, are of similar size. However, the former has a very high ROE compared to the later. Thus, on the face of it HighLevCo seems to be the better performer among the two. However, when we break the ROE into three parts, it gives a different picture. LowLevCo seems to be doing marginally better in terms of asset turnover ratio and reasonably better in terms of the profit margin. The only reason it seems to have lower ROE is because of low leverage.
Thus, it appears that LowLevCo is a better performer in terms of operations and it is lower ROE is only on account of lower levels of debt, which also reduces the risk the company faces.
8.13. Forecasting using ratio analysis
As mentioned elsewhere above, analysing ratios can help us understand how various financial metrics including income and expenditure behave and their inter relationship. Analysts then use that insight to forecast the future.
However, it is important to understand that when we do forecast or projection based on historical data, we often assume that past behaviour is a fair representation of the future. In reality this need not hold good.
Therefore, while doing forecasts, analysts may often apply their judgment and make certain adjustments to factor in changes in the scenario, if any.
Warning on Forecasting: Analysts must appreciate that future of the businesses could be significantly different from their past. For example, Suzlon faced tremendous competition from both domestic and offshore competitors starting middle of 2000 while it was the only wind turbine manufacturer before that and had great pricing power. Projecting financials of Suzlon in the middle of 2000 purely based on its historical exploration would have been a blunder.
Analysts must spend time thinking and analysing how the future of business is going to be different from its past in view of changing dimensions of the business. Then, based on assumptions, projections may be drawn.
While on this topic of projections, it may be interesting to quote some great minds - Warren Buffett, Charlie Munger and Graham and Dodd on the subject.
Warren Buffett: "I have no use whatsoever for projections or forecasts. They create an illusion of apparent precision. The more meticulous they are, the more concerned you should be. We never look at projections but we care very much about, and look very deeply, at track records. If a company has a lousy track record but a very bright future, we will miss the opportunity."
Charlie Munger: "In my opinion, projections do more harm than good. They are put together by people who have an interest in a particular outcome, have a subconscious bias, and its apparent precision makes it fallacious. They remind me of Mark Twain's saying, 'A mine is a hole in the ground owned by a liar."
Graham and Dodd: "While a trend shown in the past is a fact, a 'future trend' is only an assumption. The past, or even careful projections, can be seen as only a 'rough index' to the future."
8.14. Peer Comparison
Looking into a company's financials helps to understand the past performance of the company. It may also be interesting to see a company's performance vis-à-vis other participants/peers in the industry to understand its competitive position. All the ratios as defined above and in other units on valuation, when compared across companies of the same sector, can give a good idea of where the company stands vis-à-vis its peers. Various databases provide us a quick snapshot of all these numbers of a company vis a vis its peers. Peer comparison is critical for analysts to look into while making any research report.
8.15. Other aspects to study from financial reports
History of Equity Expansion
In addition to a company's business performance, there are also other corporate finance actions that affect shareholder's value. One such corporate finance action that is critical in shareholder value creation is fund raising.
When a company raises fresh funds, the cost of funds has to be borne by the business. Thus, raising these funds at competitive pricing is critical in value creation. When a company raises funds at higher cost, it has to be eventually borne by existing investors.
While it is easy to understand the impact of a debt as the cash flows around it is contractual in nature, understand the impact of equity issuance can be more challenging.
Companies may periodically need to issue additional equity shares either to raise funds or to meet other obligations such as issuing shares under sweat equity or ESOPs.
It may issue shares through any of the following models
- Rights issue (Issue of shares to existing shareholders in proportion to their holding)
- Public issue (IPO or Further public offering)
- Private placement
- Preferential issue
- Qualified institutional placements
- Issue of share upon exercise of warrant
- Issue of shares upon exercise of ESOPs or under sweat equity program
When a company issues such additional equity shares, other than through rights issue, it reduces the ownership stake of existing shareholders. This is simply because there are now, more shares outstanding. Since the ownership stake gets affected, such transaction can also have a bearing on the shareholder's wealth.
Therefore, investors should factor in the potential for dilution in their stake while evaluating an investment. While the future dilution events are less predictable, an analysis of the history of equity expansion by the company can give the investor some idea about how the company may conduct itself in future.
Companies that finance their growth with strong internal accruals create very little concern for investors in terms of equity dilution. If a company relies on fresh issuance of equity to raise funds, investors should check whether such activities have been undertaken without diluting the value for existing shareholders.
Raising money through rights issue does not cause major dilution as the fresh shares are offered to existing shareholders in proportion to their holdings. It causes dilution only to those shareholders who do not exercise their rights.
Preferential allotment (shares allotted to one or more selected set of investors) increases the ownership stake of the preferential investor while reducing it for all others. There are two perspectives in which one can view a company's tendency to go for preferential allotment. On one hand, it indicates a risk for potential dilution. On the other hand, it may also indicate that there are certain investors who may be able to bail out the company through equity infusion in case of crisis. Thus, while analysing historical preferential allotments, it is necessary to take into consideration the situations under which such issues were carried out. Further, the valuation of such issues should also be considered. While regulators set rules for minimum price for private placements, some companies may carry out such transactions at a premium. Premium pricing or preferential allotment is value accretive to minority shareholders and thus poses lesser dilution risk to them.
Similarly, while qualified institutional placements also dilute ownership stake, it likely points towards the confidence among institutional investors in the company's fundamentals.
Dividend and Earnings History
Shareholder's value is also affected by a company's dividend policy. Dividends are the way a company returns money to its shareholders and is one of the components of the total returns earned by the investor (in addition to the capital gains).
Thus, it is important that an analyst studies a company's dividend policy and history of profit distribution.
However, while studying the dividend history, one should also take into consideration the business phase of the company at different points in time. In general, companies are likely to pay less or no dividends during the growth phase as they are likely to need funds to fuel growth. Shareholders may also not bother about dividends for high growth companies, as the company is likely to be able to generate higher returns on its funds as compared to shareholders' expected return. However, as its business matures and incremental returns decline, shareholders are likely to expect the company to pay timely dividends.
While dividend yield is important for matured companies, another factor that needs to be looked at is the predictability or stability of dividend. Companies with high dividend yield are likely to attract long term investors who seek periodic investment income to supplement their annual income.
Matured companies in defensive industry offer more predictability in terms of dividends as the business, per se, is likely to be more predictable. Most of such companies also offer interim dividends. For example, companies such as Colgate Palmolive or Britannia regularly offer interim dividends.
In other industries, some companies try to offer predictability by actively managing the dividends. They endeavor to build reserves during periods of good performance and use such reserves to pay dividend during periods of bad performance.
Analysts can understand these by reading the company's dividend policy or by observing historical data of the company.
While studying dividend history, an analyst should also take into consideration share buy backs (other than those to meet stock-based compensation) as it is also a means to distribute profits to shareholders. Companies may prefer share buy-back over dividend if it is likely to have favorable tax treatment in the hands of investors and / or the company. Further, buy back also provide opportunity to the investors to decide between en-cashing the offer or to increase their stake.
Dividends and share buy backs may also provide signal to the market in terms of outlook and strategy. However, this task is not simple and would involve analyst to take into consideration other circumstances and the context.
For example, when a company with good performance begins to retain more profit than usual, it may be an indicator of the company's intention to make a major investment. However, it may also indicate that the company is expecting challenging environment in the future.
Similarly, when a high growth company increases its dividend, it may indicate that the company is foreseeing reduced growth opportunities.
When a company's dividend announcement deviates significantly from its past, it is better to understand the reason for the same from the company management.
History of Corporate Actions
Corporate actions such as dividends, bonuses, splits and rights issues affect the company's share price in various ways. Much more to this subject is covered in the dedicated unit dealing with corporate actions.
Ownership and Insiders' Sales and Purchase of Stocks in The Past
Owners, being closest to the business, have most information about the nuances of the business. They are better informed of the performance of the company. They also act in the market (buy/sell shares of the company) under the defined guidelines of SEBI.
While analysing a business, analysts may get good insight by looking at the actions of the promoters/insiders in the market. It is interesting to quote Peter Lynch on the subject – "insiders can sell for a variety of reasons and it not necessarily ring alarm bells, but if insiders are buying, then there can be only one reason that the company is likely to make huge profits in future".
Sample Questions
1. Which of the following items are found in an income statement?
a. Change in accounts Receivables
b. Changes in long term debt
c. Changes in inventory of finished goods and work in progress
d. None of the above
2. Which section in the Cash Flow statement will provide the information about the amount of funds that a company borrowed during the preceding year?
a. Operating Cash Flows
b. Investment Cash Flows
c. Financing Cash Flows
d. Total Net Cash Flows
3. Which of the following measures the ability of the company to satisfy its short term obligations as and when they come due?
a. Current Ratio
b. High Return on Equity
c. High Return on Capital Employed
d. Inventory Turn Over Ratio
4. Price to earnings ratio of a business is 10, price to book value ratio of this business is 5, book value per share is Rs. 15 and outstanding number of shares are 10,000, what would be the return on equity of this business?
a. 25%
b. 75%
c. 50%
d. 20%
Case Studies
5. You have been given comparative financials of two companies for the past two years. Both the companies are in the same industry and are of reasonably similar sizes. Answer the subsequent questions based on the information in the table.
| Company A | Company B | |||
|---|---|---|---|---|
| 2XX8 | 2XX9 | 2XX8 | 2XX9 | |
| Income statement summary | ||||
| Operating revenue | 8,642.0 | 9,100.0 | 6,427.0 | 7,524.0 |
| Cost of raw materials | 3,024.7 | 3,003.0 | 2,185.2 | 2,558.2 |
| Changes in inventory of finished goods and WIP | 120.0 | -35.0 | 160.0 | 140.0 |
| Employee cost | 976.5 | 1,055.6 | 687.7 | 880.3 |
| Depreciation and amortisation | 240.7 | 241.2 | 213.3 | 218.6 |
| Finance cost | 175.8 | 180.4 | 184.8 | 195.2 |
| Other expenses | 557.2 | 561.7 | 596.3 | 602.1 |
| Profit before tax | 3,547.1 | 4,093.1 | 2,399.7 | 2,929.6 |
| (-) Tax expense | 1,170.5 | 1,330.0 | 791.9 | 966.8 |
| Profit after tax | 2,376.5 | 2,763.1 | 1,607.8 | 1,962.8 |
| Balance sheet summary | ||||
| Fixed assets | 2,407.0 | 2,412.0 | 2,133.0 | 2,186.0 |
| Net working capital | 2,160.5 | 2,275.0 | 1,606.8 | 1,881.0 |
| Total Assets | 4,567.5 | 4,687.0 | 3,739.8 | 4,067.0 |
| Debt | 1,598.6 | 1,640.5 | 1,540.0 | 1,626.8 |
| Equity | 2,968.9 | 3,046.6 | 2,199.8 | 2,440.2 |
| Total debt and equity | 4,567.5 | 4,687.0 | 3,739.8 | 4,067.0 |
(i) Company A had Rs. 320 lakhs worth of finished goods and WIP in its inventory at the end of financial year 2XX8. Which of the following is closest to its inventory of finished goods and WIP at end of 2XX9?
a. Rs.220 lakhs
b. Rs.285 lakhs
c. Rs.355 lakhs
d. Rs.440 lakhs
(ii) You have information that companies in the industry increased selling price of their output. However, different companies increased their prices at different rates. Which of two company is likely to have increased their price at a higher rate and why?
a. Company B is likely to have increased the price more as its sales grew faster than that of A.
b. Company A is likely to have increased the price more as its cost of materials to sales ratio decreased year over year, while it remained constant for company B
c. Company B is likely to have increased the price more as its net profit margin increased by 23% compared to only 15% growth for Company A
d. Company A is likely to have increased the price more as it earned higher net profit
(iii) Which of the following is closest to the difference between EBITDA margin ratios for Company A and Company B for the 2XX9? (1 basis point or bps equals 0.01%)
a. Both the companies have very similar margins
b. Company A's EBITDA margin is 427 bps higher than Company B's EBITDA margin
c. Company B's EBITDA margin is 450 bps higher than Company A's EBITDA margin
d. Company A's EBITDA margin is 518 bps higher than Company B's EBITDA margin
(iv) Which of the two companies have higher level of financial leverage?
a. Company A has higher financial leverage as it has higher level of debt
b. Company A has higher financial leverage as it has higher Debt / Asset ratio
c. Company B has higher financial leverage as it has higher Debt / Asset ratio
d. Company B has higher financial leverage as it has higher finance cost
(v) Which of the following is closest to operating profit of Company B for the year ending 2XX9?
a. Rs.2,929.6 lakhs
b. Rs.3,124.8 lakhs
c. Rs.3,343.4 lakhs
d. Rs.3,945.5 lakhs
(vi) Company A has a higher return on equity (ROE) compared to Company B. Which of the following combination of factors have favourably contributed to the higher ROE?
a. Higher net profit margin and higher activity ratio
b. Higher net profit margin, higher activity ratio and lower financial leverage
c. Higher net profit margin, higher activity ratio and higher financial leverage
d. Higher net profit margin
Chapter 8 Summary: Key Takeaways
- Financial Statement Components: Balance Sheet, P&L, Cash Flow Statement, Statement of Changes in Equity, and Notes to Accounts are governed by IndAS 1 and Companies Act 2013
- Consolidated vs Standalone: Consolidated statements provide holistic view of group performance; control defined as >50% voting rights
- Balance Sheet Analysis: Assets (current/non-current), liabilities, equity components; key metrics include total debt, working capital, core working capital
- P&L Statement: Revenue recognition, expense classification, EBITDA, EBIT, exceptional items, OCI components
- Cash Flow Importance: Operating, Investing, Financing activities; negative operating cash flows signal distress
- Notes to Accounts: Accounting policies, contingent liabilities, off-balance sheet items critical for analysis
- Audit Report Quality: Clean vs Qualified vs Disclaimer opinions indicate accounting quality
- Ratio Analysis: Profitability, Return, Leverage, Liquidity, Efficiency ratios provide different analytical perspectives
- DuPont Analysis: ROE = Net Profit Margin × Asset Turnover × Equity Multiplier; helps identify ROE drivers
- Forecasting Limitations: Historical data may not predict future; qualitative factors equally important
- Peer Comparison: Industry context essential for meaningful ratio interpretation
- Equity History & Ownership: Track dilution events, dividend policy, insider transactions for complete picture