📑 Chapter Navigation
Risk Fundamentals
Portfolio Theory
📖 Complete Course Navigation
Foundation (Ch 1-4)
Analysis (Ch 5-8)
Advanced (Ch 9-13)
Annexures (Ch 14-16)
LEARNING OBJECTIVES:
After studying this chapter, you should know about:
- Concept of Return on Investment
- Calculating returns - simple, annualized and compounded
- Risks in Investment and measuring market risk
- Sensitivity analysis and Concept of Margin of Safety
- Comparative analysis of equity and bond returns
- Calculating risk adjusted returns
- Behavioral biases that influence investment returns
12.1 Concept of Return of Investment and Return on Investment
Investment means putting up capital in an identified investment product to earn returns from it. The investor expects two things from the investment: to earn a return and, more importantly to get back the capital invested. The preservation or safety of the capital invested is as important a parameter in evaluating an investment as is the return that it is expected to provide. The return from an investment needs to be evaluated in terms of the level of the return, the volatility in the return and the nature of return: periodic or capital appreciation.
The return that an investment generates in money terms is not a correct representation of its level of return. The return has to be seen in conjunction with the capital invested to earn it.
Return on Capital/investment (ROI) is the comparison of returns with the investment and can be defined for single period as:
Return on investment (%) = (Net profit / Investment) × 100
Higher the potential ROI, better for the investors. As a decision tool, it is simple to understand. However, one has to be careful while using the ROI numbers for those investments, where the returns are not known in advance, such as equity and mutual funds. In all such investments, estimates are based on past returns and assumptions are made for future returns.
12.2 Calculation of Simple, Annualized and Compounded Returns
The return on an investment can be calculated in different ways. The returns calculated must enable the following:
- Help the investors decide if the return is adequate to meet their goals and to compensate for the risk in the investment
- Help the investors compare different investments on the basis of returns
- Help the investors evaluate the performance of an investment relative to benchmark
The returns from an investment can be in the form of periodic payouts such as interest, dividends and rent, or in the form of appreciation in the value of the investments. An increase in the price of the investment forms part of the returns to the investor and used in the calculation of the RoI, whether it is realized or not. Together, they form the total returns from the investment.
Example:
An investor purchased 150 shares of company ABC. Each share costs Rs.25. The investor paid Rs.20 commission to the broker. The shares were sold at Rs.30 per share. The investor also paid Rs.20 commission fee to the broker for the transaction. The investor received dividends amounting to Rs.1 per share during the holding period.
Total Cost:
Total Cost = shares × price per share + commission fee
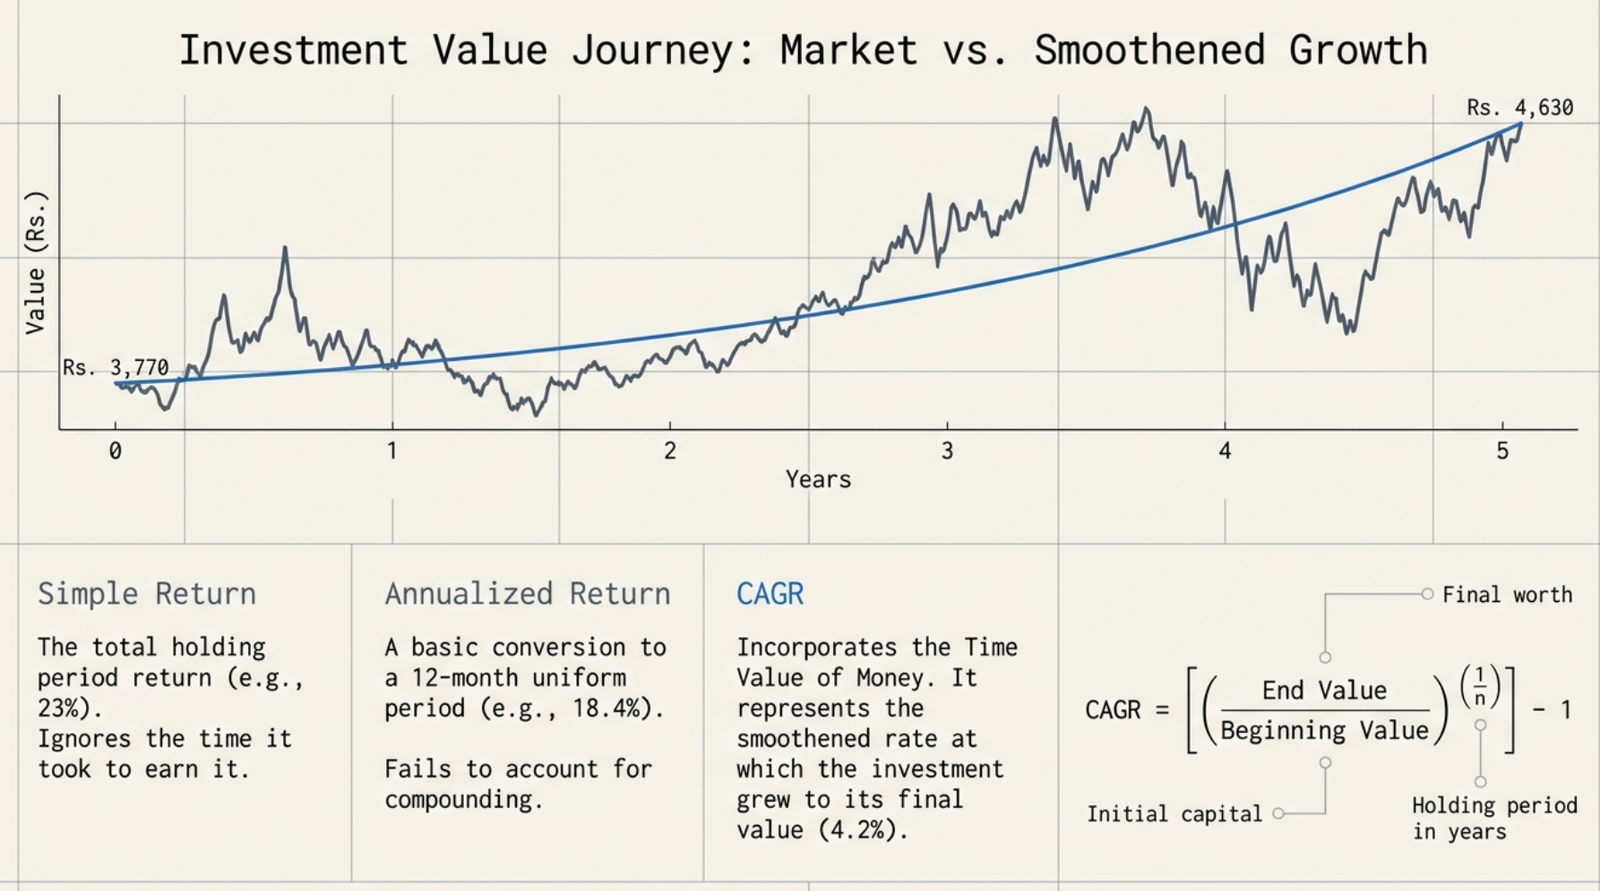
Total Cost = 150 × Rs.25 + Rs.20 = Rs.3,770
Total Returns:
Total Returns = Dividends + Sales Proceeds
Dividends = 150 × Re.1 = Rs.150
Sales Proceeds = 150 × Rs.30 - Rs.20 = Rs.4,480
Simple Return:
Simple Return = (Rs.4,480 + Rs.150) / Rs.3,770 - 1 = 1.23 - 1 = 0.23
The simple return on the investments is 23%. This is called single period return or absolute return.
However, this computation does not take the period over which the return was earned into consideration. A 23% return earned over a one year is not the same as a 23% return earned over a longer or shorter investment period.
Annualized Return
The absolute return is converted into annualized return by dividing it by the number of months/days that the investment was held and multiplying it by 12 months/365 days.
If the investor had held the investment for 15 months over which the 23% was earned, then the simple annualized return for the investment would be:
(23%/15) × 12 = 18.4%
Compounded Annual Growth Rate (CAGR)
The annualized return calculation does not take the time value of money into consideration. Time value of money is the concept that money has the ability to be invested to earn more money. Therefore, money received earlier is worth more than money received later.
CAGR is computed as:
{(End Value/Beginning Value)^(1/n)}-1, where n is the holding period in years.
If the investment in the previous example was held for 5 years, the CAGR is calculated as:
3770 × (1+r)^5 = 4630
(1+r)^5 = 4630/3770 = 1.23
And, r = 1.23^(0.2) - 1 = 0.04227
Therefore, the compound annual growth rate on the investment comes to 4.2%.
Compound annual growth rate allows for making a clearer evaluation of the performance of the stock as it takes both holding period of investment and time value of money into consideration. CAGR is the smoothened rate of return at which the return grew to the final value over the investment period. The actual return in each year of the holding period may be different from the CAGR.
CAGR for multiple cash flows
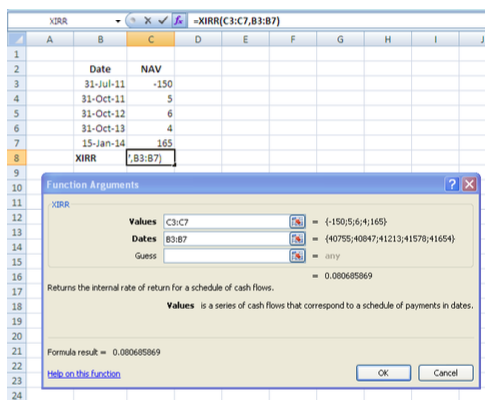
An investor buys an equity share on 31 Jul 2011 for Rs.150. He receives a dividend of Rs.5 on 31 Oct 2011; Rs.6 on 31 Oct 2012; Rs.4 on 31 Oct 2013. He sells the share on 15 Jan 2014 for Rs.165. What is the CAGR of his investment?
This problem cannot be solved using the direct CAGR formula. The underlying CAGR for these multiple flows has to be calculated by using XIRR function in Excel.
12.3 Risks in Investments
Risk and return are an integral part of investing. The return that an investment generates cannot be seen in isolation from the risk that has to be assumed to earn it. A high return can be earned only if the investor is willing to take higher risk. Risk in an investment is the volatility and uncertainty in the returns and in the extreme case, the loss of capital invested.
Types of Investment Risks
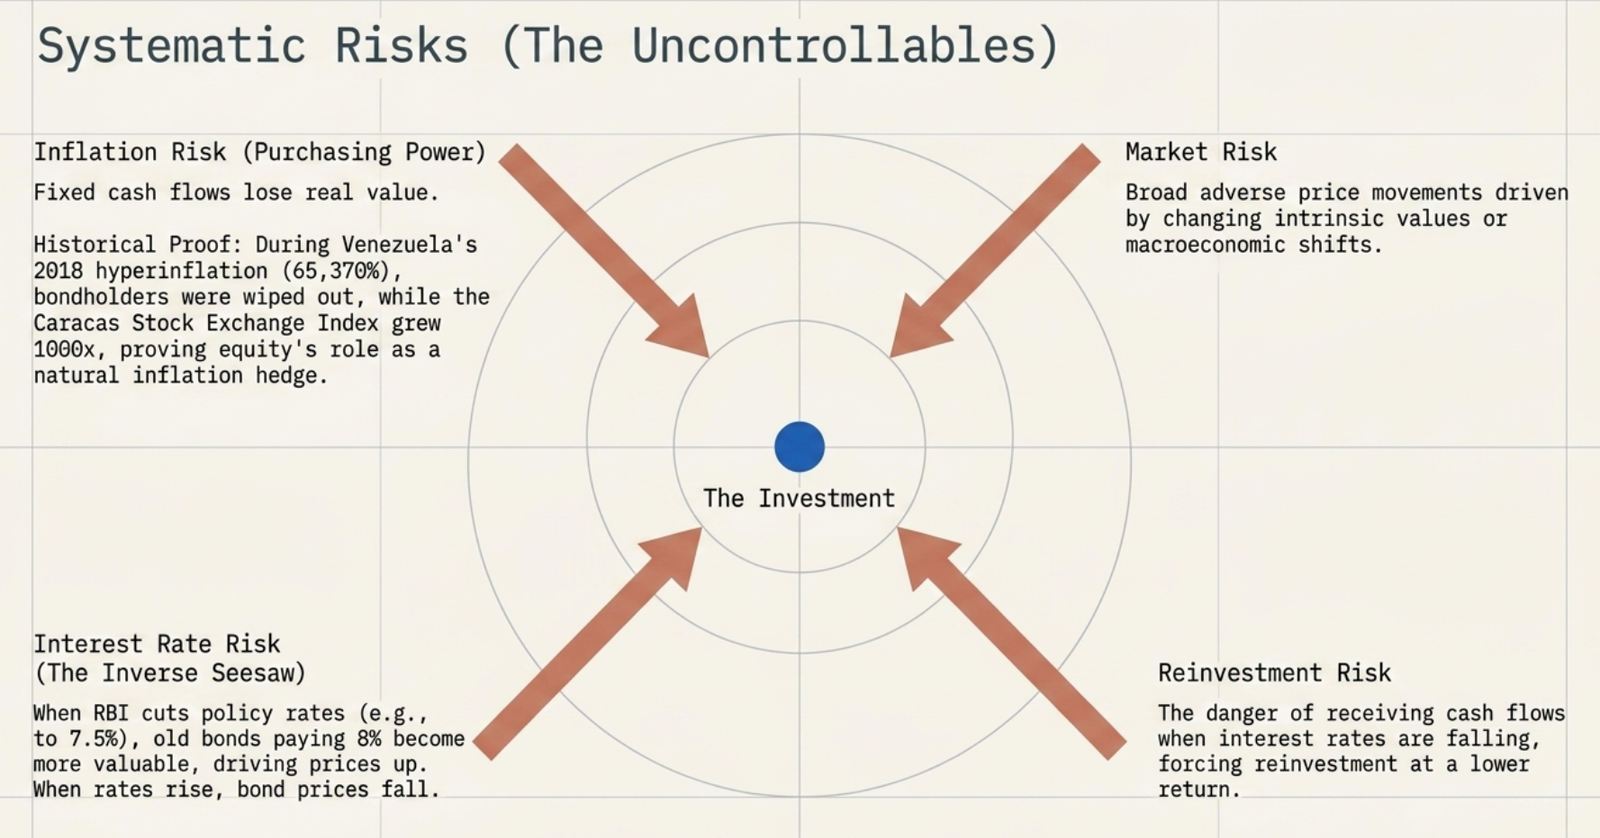
Inflation Risk
Inflation risk represents the risk that the money received on an investment may be worth less when adjusted for inflation. It is a risk that arises from the decline in value of security's cash flows due to the falling purchasing power of money.
Asha has invested a lump sum in bank fixed deposits that yield her about Rs.5000 per month. This is adequate to cover the cost of her household provisions. Suppose that inflation rises by 10%, meaning that there is a general rise in prices of goods by about 10%. Then, Rs.5000 will no longer be enough to cover Asha's monthly provisions costs, she would need 10% more, or Rs.5500.
Inflation risk is highest in fixed return instruments, such as bonds, fixed deposits and debentures, where both interest payments and principal repayment are fixed in absolute terms. Suppose a bond pays a coupon of 8% while the inflation rate is 7%, the real rate of return is just 1%. If inflation goes up to 9%, the bond returns a negative real rate of return.
Inflation risk is lower for equity shares. If prices rise because of inflation, businesses see higher selling prices and profits in nominal terms, which typically reflects as higher stock prices. Example: Venezuela's hyperinflation peaked at 65,370% in 2018. While bond investors suffered as investments became nearly worthless, the Caracas Stock Exchange Index increased by over 1,000× in the same year — demonstrating equity's natural inflation hedge.
Interest Rate Risk
Interest rate risk refers to the risk that bond prices will fall in response to rising interest rates, and rise in response to declining interest rates. Bond prices and interest rates have an inverse relationship.
Worked Example: An investor holds a 5-year bond at Rs. 100 face value paying 8% annual interest. After one year, RBI cuts rates and new 5-year bonds are issued at 7.5%. Old bondholders have a 0.5% advantage, so investors rush to buy old bonds, pushing their price up until the old bond's IRR matches 7.5%.
Conversely, if rates rise to 9%, new bonds pay more than old bonds. Old bond holders try to sell, pushing old bond prices down until old bond's IRR matches 9%.
The relationship between rates and bond prices:
- If interest rates fall, or are expected to fall, bond prices go up.
- If interest rates rise, or are expected to rise, bond prices decline.
Interest rate risk also impacts equity: higher interest rates increase the cost of capital, reduce the present value of cash flows, constrain borrowing, reduce capex and profits — all pushing equity prices down.
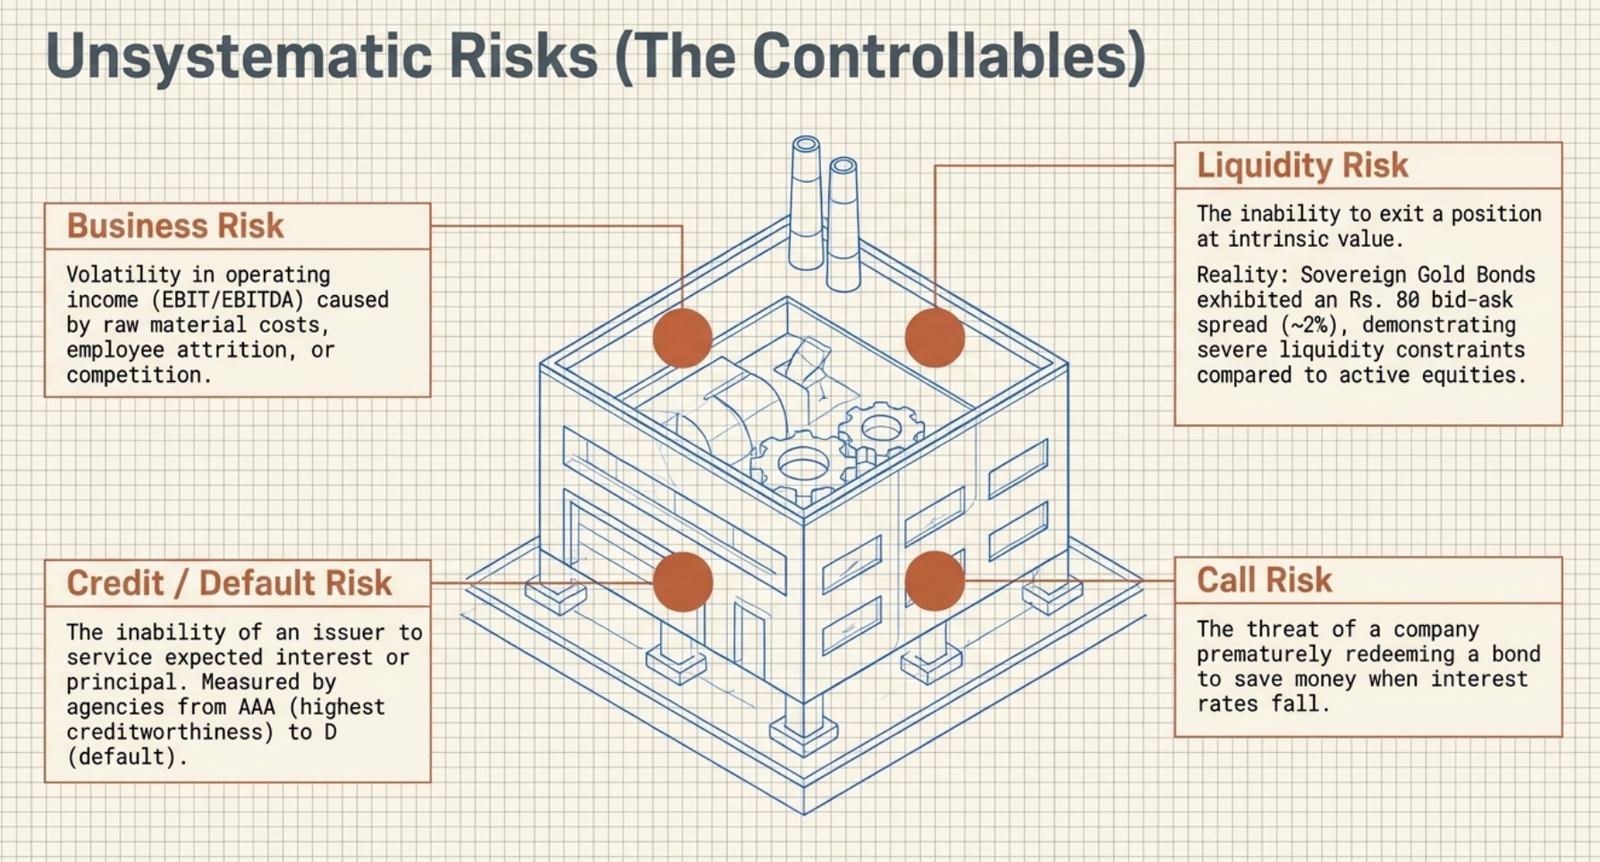
Business Risk
Business risk is the risk inherent in the operations of a company, usually measured as the standard deviation of EBIT or EBITDA. Any factor creating volatility in operating income is business risk. Sources include: commodity risk (raw material cost fluctuations), operations risk (employee cost volatility), competition risk (new products), supply chain risks, and currency risk (for international businesses). Holding a diversified portfolio across businesses efficiently reduces this risk.
Market Risk
Market risk refers to the risk of loss in an investment due to adverse price movements in the market. The price of an asset responds to information affecting its intrinsic value — rising interest rates reduce bond values (interest rate risk), currency appreciation reduces earnings of export-oriented companies (currency risk). Market risk affects investments with an active secondary market (equity, bonds, gold, real estate). Fixed deposits and small savings schemes have no market risk but cannot appreciate due to market factors.
Credit Risk
Credit Risk or default risk refers to the possibility that a bond issuer will not be able to make expected interest payments and/or principal repayment. The ability to service debt can change over time. Credit rating agencies quantify this risk using alpha-numeric symbols: AAA/A1 = highest creditworthiness, D = default status. Lower ratings imply higher credit risk and higher interest cost for the borrower. A sovereign government borrowing in local currency has no default risk — it can tax or print currency. Holding a diversified portfolio of bonds reduces default risk.
Liquidity Risk
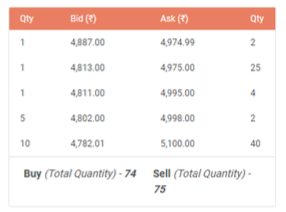
Liquidity risk refers to absence of liquidity in an investment — the investor cannot sell when desired, must sell below intrinsic value, or faces high transaction costs. "Liquidity" has three meanings: (1) a company's ability to meet short-term obligations; (2) an asset's ease of conversion to cash (shares are liquid; gold and real estate are relatively illiquid); (3) market liquidity — the presence of ready buyers and sellers who can transact significant quantities without large price impact. The corporate bond market in India is not liquid for retail investors. Investments in property and art are also subject to liquidity risk due to the lengthy process of finding buyers.
Call Risk
Call risk is specific to bond issues and refers to the possibility that a debt security will be called prior to its maturity. Call risk usually goes hand in hand with reinvestment risk. Call risk is most prevalent when interest rates are falling.
Reinvestment Risk
Re-investment risk arises from the probability that income flows received from an investment may not be able to earn the same interest as the original interest rate.
- If Interest rate rises, reinvestment risk reduces or is eliminated
- If Interest rate falls, reinvestment risk increases
Political Risk
Risk associated with unfavourable government actions - possibility of nationalization, change in tax structures, licensing etc. is called political risk.
Country Risk
Country risk refers to the risk related to a country as a whole. There is a possibility that it will not be able to honour its financial commitments.
Systematic vs. Unsystematic Risk
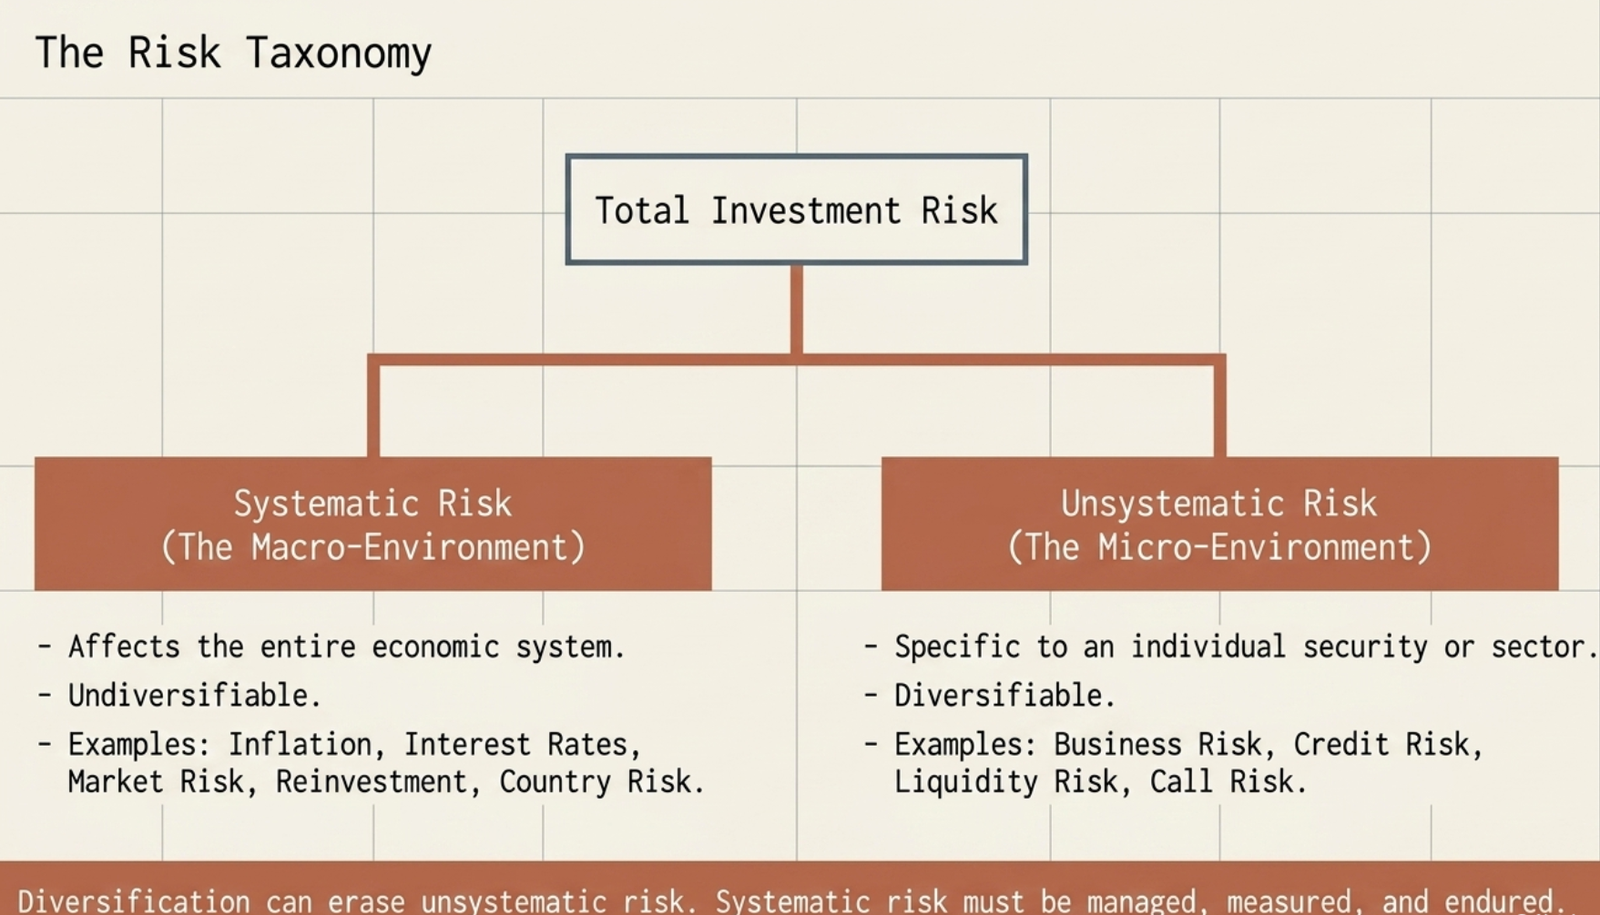
Systematic risk refers to those risks whose impact is felt across investment categories. These risks are also known as undiversifiable risks, because they cannot be eliminated through diversification. Inflation risk, exchange rate risk, interest rate risk and reinvestment risk are systematic risks.
Unsystematic risk is the risk specific to individual securities or a small class of investments. Hence it can be diversified away by including other assets in the portfolio. Credit risk, business risk, and liquidity risks are unsystematic risks.
12.4 Measuring risk
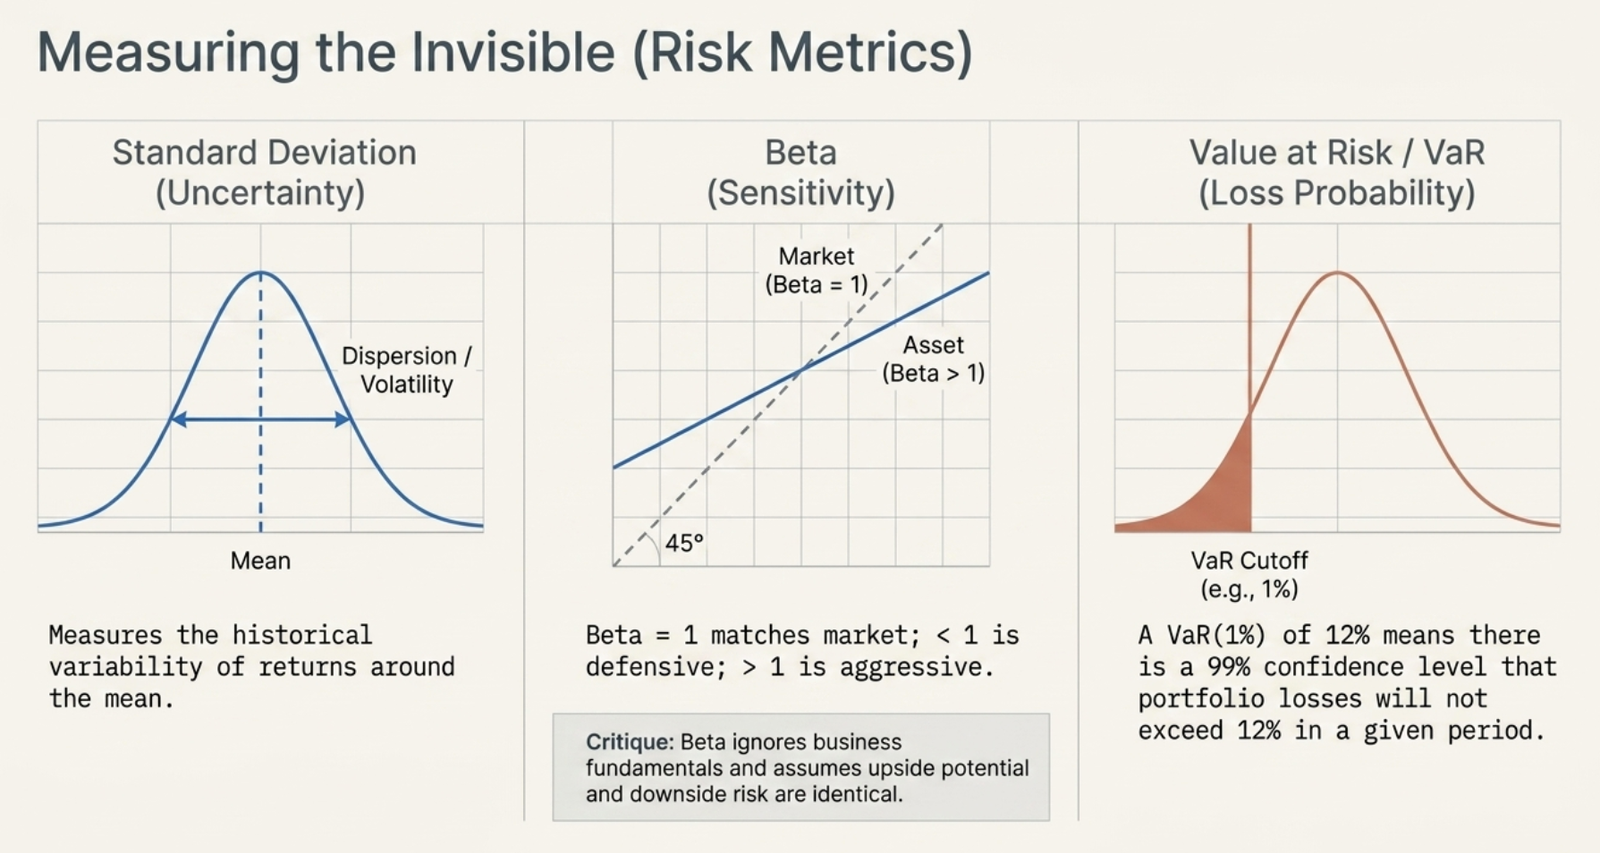
There are three ways in which risks are defined:
(i) Measure of uncertainty
This is calculated as standard deviation of the return of the assets.
s = √[Σ(X - X̄)² / (n - 1)]
Where X̄ refers to the average rate of returns of the asset and n represents the numbers of observation in the sample
(ii) Measure of sensitivity
This approach measures risk based on the sensitivity of the asset's prices to various risk factors:
- Beta: Measures the sensitivity of the stock's performance to overall market performance. Used largely for equities.
- Duration: Measures the sensitivities of a bond's price to small change in interest rates.
- Delta: Measures the sensitivity of the price of an option for a small change in price of the underlying asset.
(iii) Measure of loss
Risk can be defined as probability of losing a sum of amount; alternatively, it can be defined as the amount of loss one may sustain given probable scenario.
Value at Risk (VaR): It measures the maximum loss one may suffer, given a particular level of confidence. For instance if VaR(1%) of a portfolio is 12%, it indicates that there is 99% (= 100% - 1%) chance the loss in the portfolio would exceed 12%.
⚠️ Calculate Risk Metrics with Professional Tools
You've learned about Standard Deviation, Beta, VaR, and risk types. Now calculate these metrics with live portfolio data using our advanced risk tools!
🎲 Monte Carlo Risk Simulator
Calculate VaR & risk metrics like NISM teaches:
- Value at Risk (VaR) calculations
- Standard Deviation analysis
- Portfolio Risk simulation
- Confidence Intervals modeling
📊 Risk Calculator & Analyzer
Measure all risk types covered in Chapter 11:
- Beta & Market Risk analysis
- Systematic vs Unsystematic risk
- Correlation & Diversification
- Risk-Return optimization
Risk Management: Use professional-grade tools to quantify and manage investment risks exactly as taught in NISM!
12.5 Concepts of Market Risk (Beta)
Beta is a measure of the systematic risk of a security by comparing the volatility in the investment relative to the market, as represented by a market index.
- Beta of 1 indicates that the security's price will move with the market.
- Beta of less than 1 means that the security will be less volatile than the market.
- Beta of greater than 1 indicates that the security's price will be more volatile than the market.
Beta is used in the capital asset pricing model (CAPM), a model that calculates the expected return of an asset based on its beta and expected market returns.
"I find it preposterous that a single number reflecting past price fluctuations could be thought to completely describe the risk in a security... Beta fails to allow for the influence that investors themselves can exert on the riskiness of their holdings... Beta also assumes that the upside potential and downside risk of any investment are essentially equal..."
- Seth Klarman
12.6 Sensitivity Analysis to Assumptions
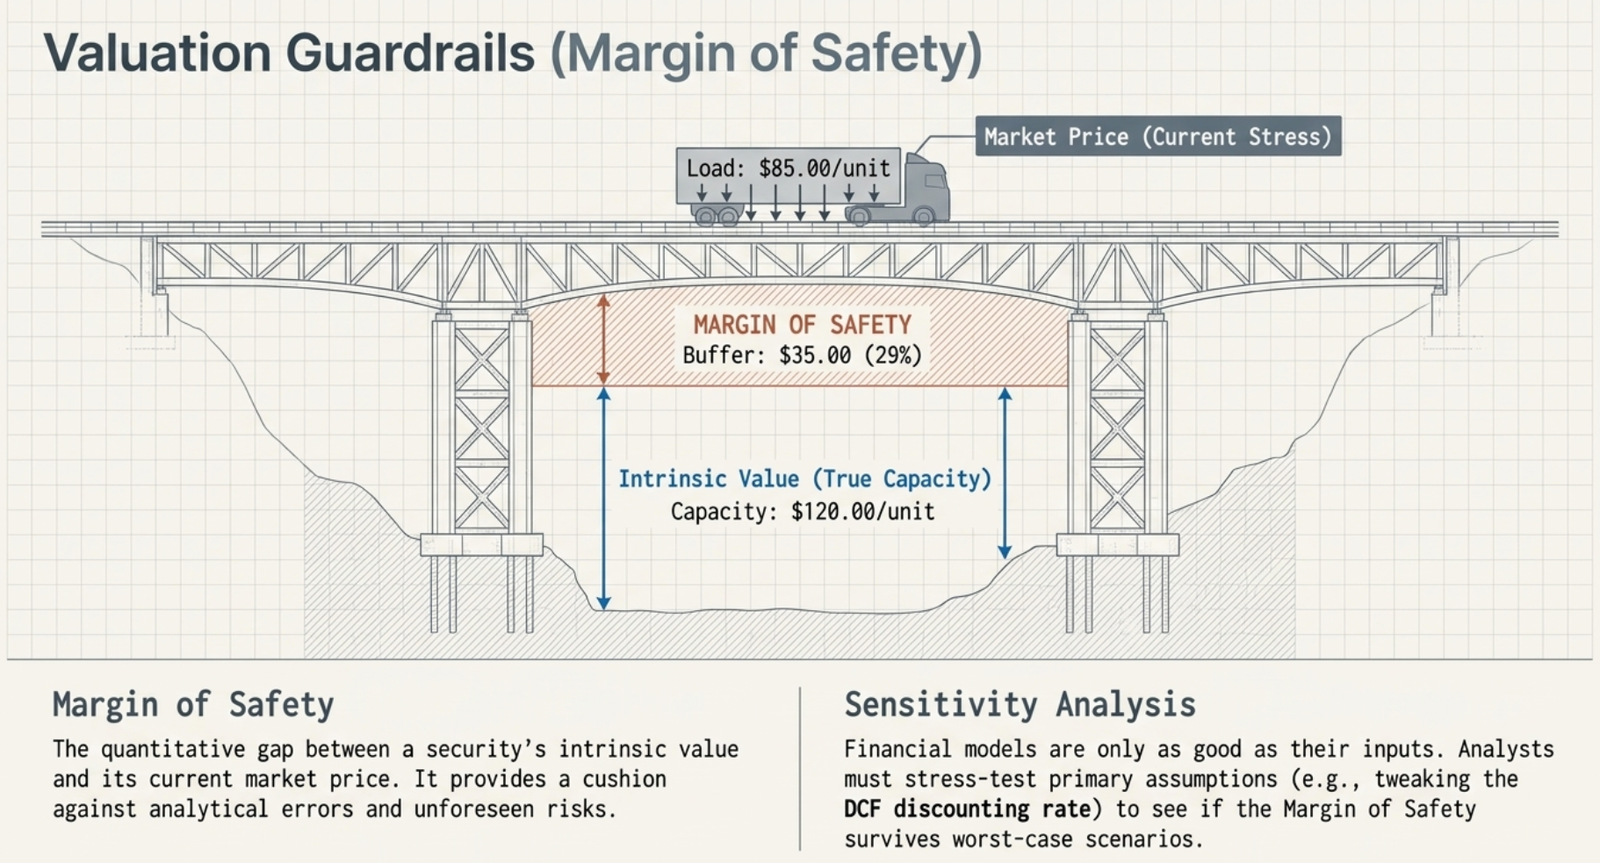
Securities analysts use financial models to value securities of different kinds. These valuations are based on several inputs/assumptions about future aspects of the business and some of these assumptions may be critical ones. It is important to identify the critical variables in a valuation model and do an analysis of how the output will vary under different scenarios for the primary or critical variables. This is known as sensitivity analysis.
12.7 Concept of Margin of Safety
Margin of Safety is the term popularized by Mr. Benjamin Graham and his followers, most notably Mr. Warren Buffett. In simple words, margin of safety refers to the difference between value and prices, when securities are bought at a price significantly below their intrinsic value. Higher the difference between value and price (i.e., value higher than price), higher the margin of safety.
While Margin of safety allows an investment to be made with minimal downside risk, it doesn't guarantee a successful investment. However, it does provide room for error/cushion against an analyst's judgment on valuation of securities.
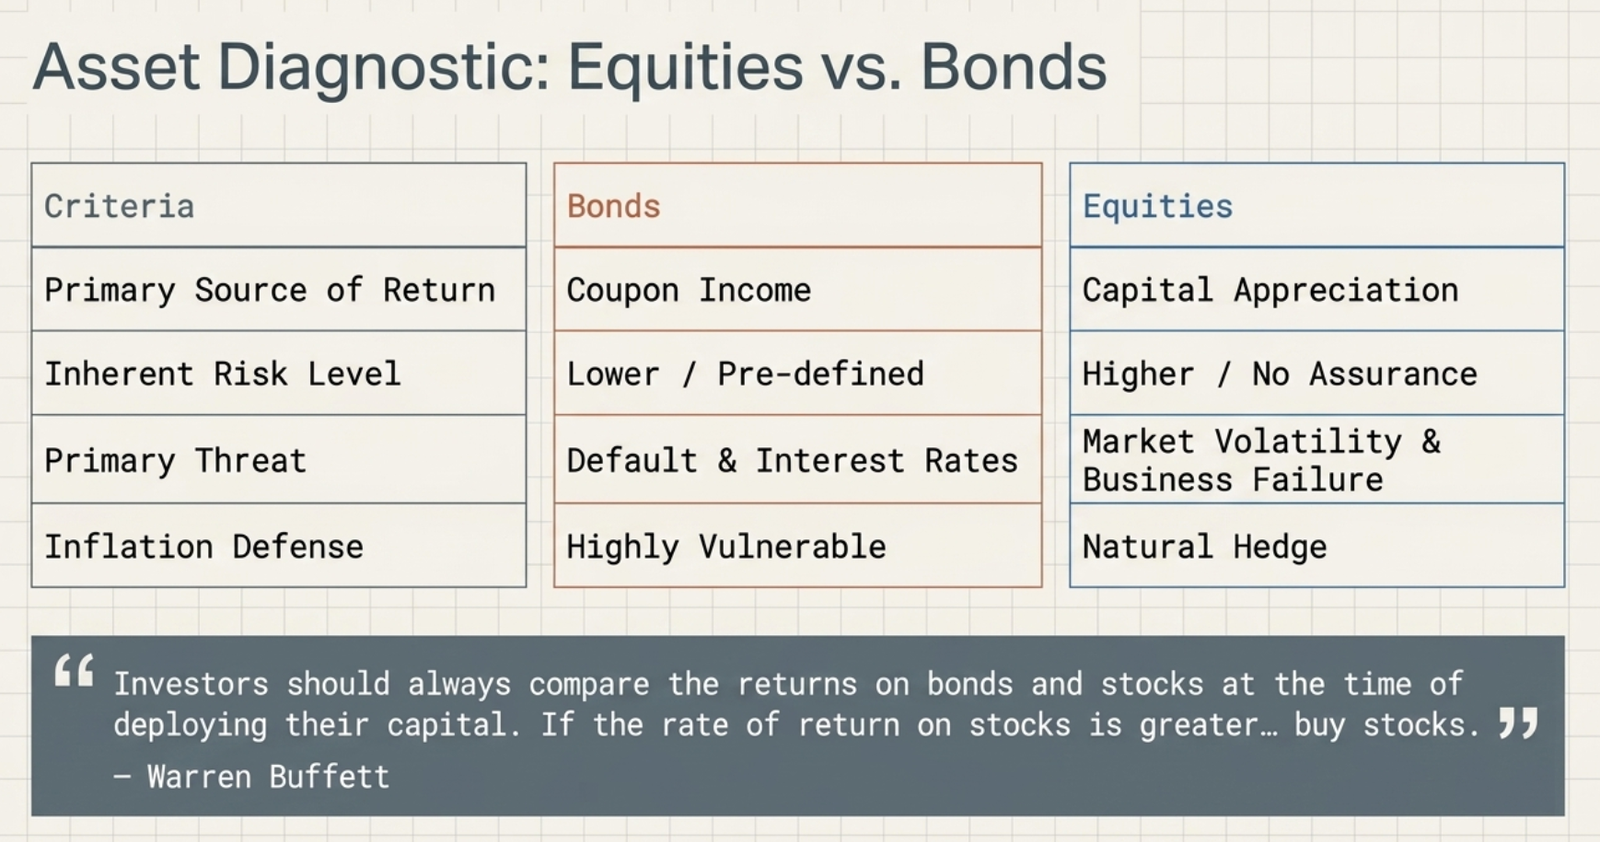
12.8 Comparison of Equity Returns with Bond Returns
Bond and equity returns vary as to the nature of return, the level of returns and the composition of the returns.
| Aspect | Bond Returns | Equity Returns |
|---|---|---|
| Primary Source | Coupon income | Capital appreciation |
| Risk Level | Lower (pre-defined return) | Higher (no assurance) |
| Main Risk | Default risk | Market volatility |
| Return Level | Lower | Higher potential |
"Investors should always compare the returns on bonds and stocks at the time of deploying their capital. If the Rate of Return on stocks is greater than the Rate of Return on bonds, one should buy stocks. And, if Rate of Return on bonds is greater than the Rate of Return on stocks, one should deploy capital in bonds."
- Warren Buffett
12.9 Calculating risk adjusted returns
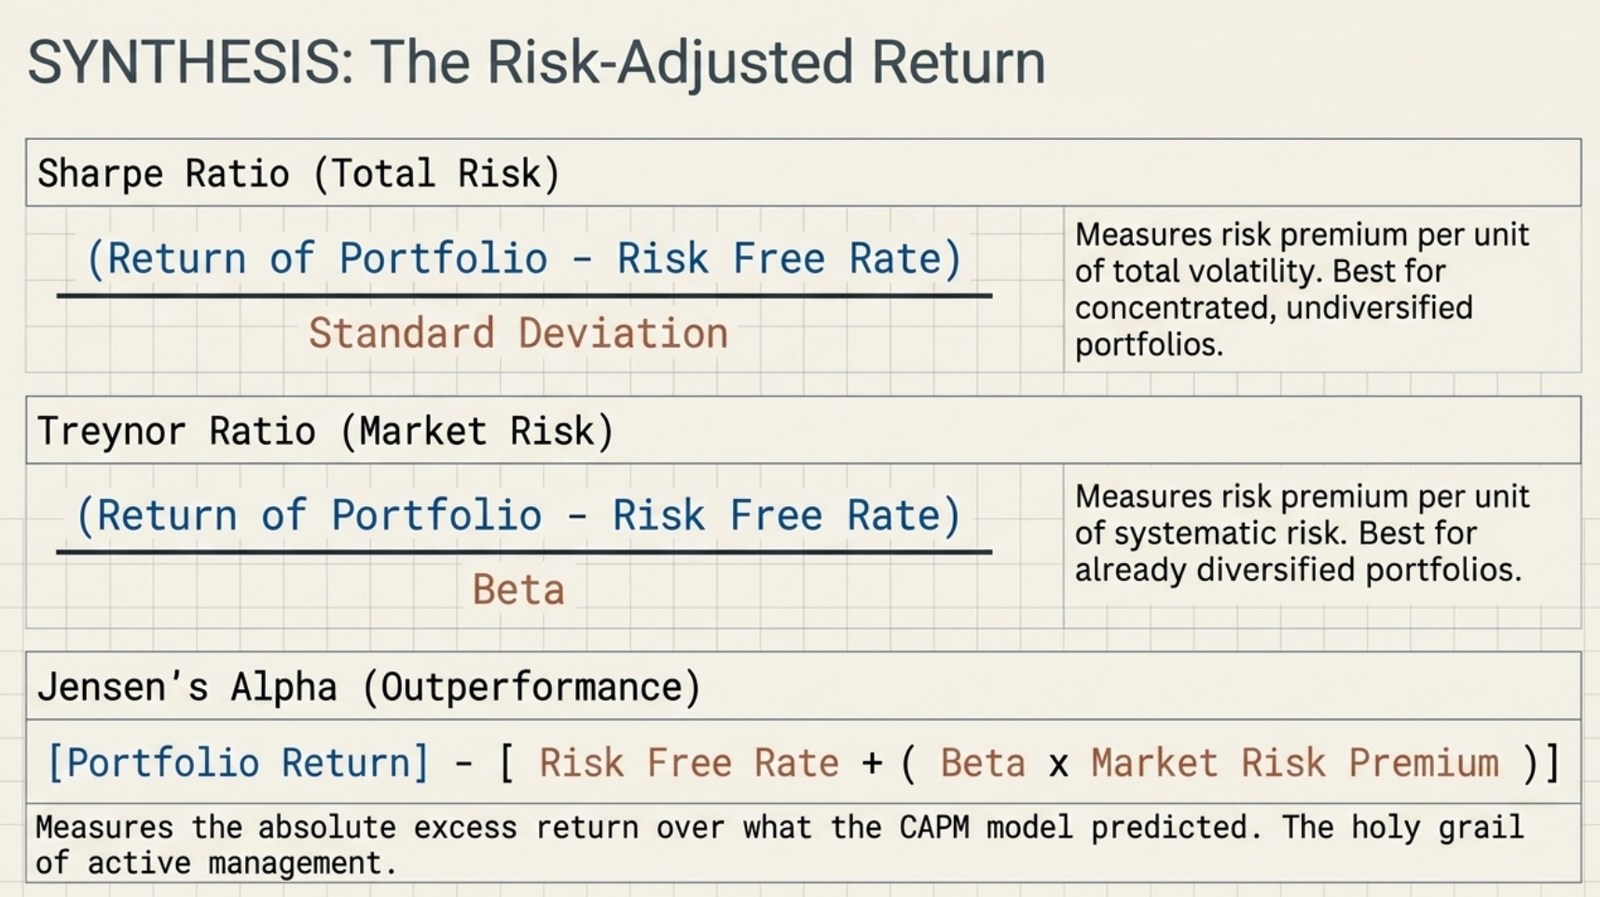
In general, high risk investment strategy would produce higher returns. Therefore, when comparing two investment portfolios or strategy, it may not be appropriate to compare their absolute returns. Some risk adjusted measures are as follows:
Jensen's Alpha
Jensen's Alpha = Return on portfolio – (Risk free rate + β × market risk premium)
Higher the Jensen's Alpha, the better it is.
Sharpe Ratio
Sharpe ratio measures the risk premium earned per unit of standard deviation.
Sharpe ratio = (Return on portfolio − Risk free rate) / Standard deviation
Higher ratio indicates superior performance.
Treynor Ratio
Treynor ratio measures the risk premium earned per unit of Beta.
Treynor ratio = (Return on portfolio − Risk free rate) / Beta
Higher ratio indicates superior performance.
12.10 Basic Behavioral Biases Influencing Investments
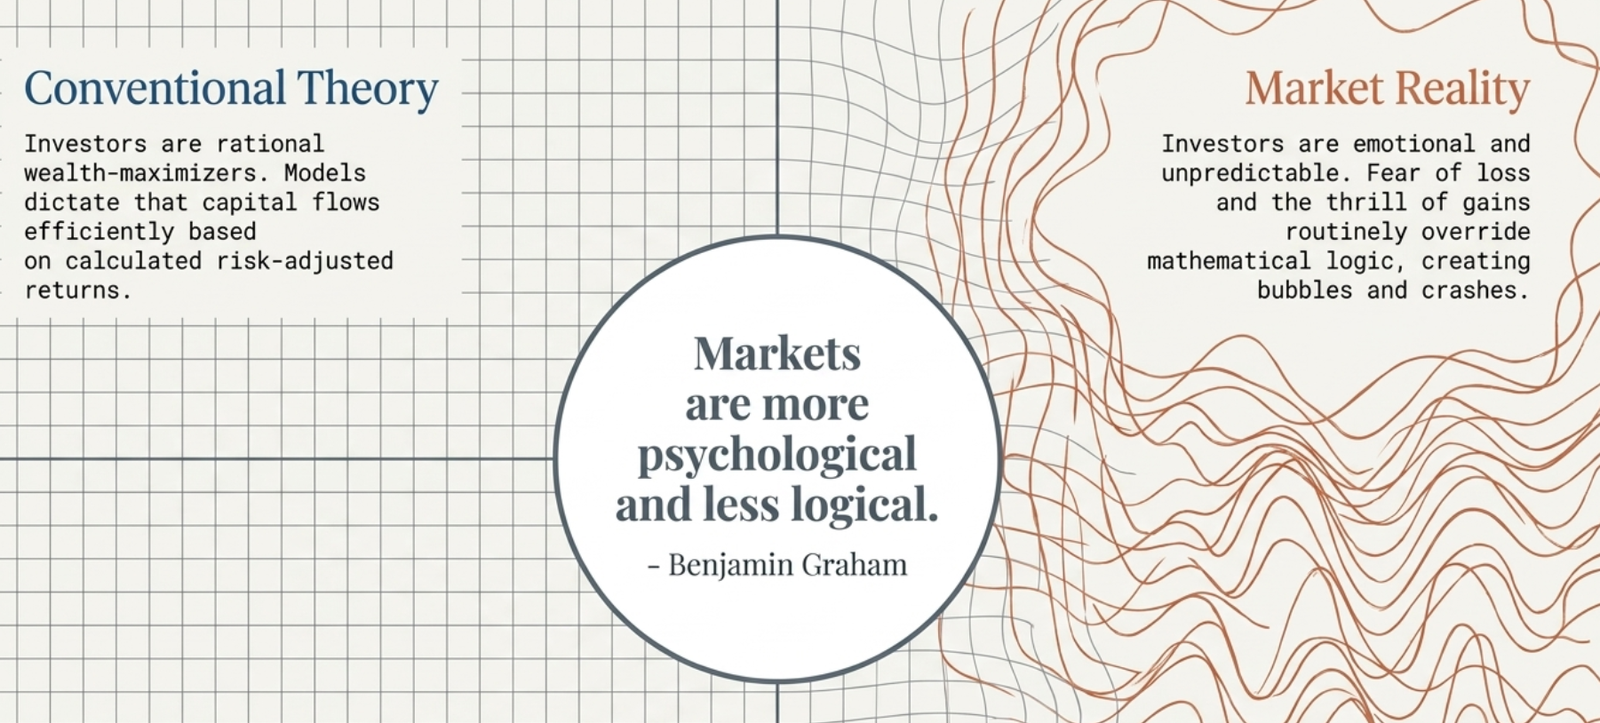
According to conventional financial theory, the world and its participants are rational human beings. However, there are many instances where emotion and psychology influence our decisions, causing us to behave in unpredictable or irrational ways.
"Markets are more psychological and less logical."
- Benjamin Graham, "The Intelligent Investor"
Common Behavioral Biases:
Loss-aversion bias
Loss aversion refers to investor's tendency to strongly prefer avoiding losses to acquiring gains. The fear of loss leads to inaction. Studies show that the pain of loss is twice as strong as the pleasure of gain of a similar magnitude.
Confirmation bias
The tendency to search for, interpret, or prioritize information in a way that confirms one's beliefs or hypotheses. For example, when a trader buys a stock for a reason and that reason doesn't work out so the trader makes up another one for owning the position.
Ownership bias
Things owned by us appear most valuable to us. Sometimes known as the endowment effect, it reflects the tendency to place a higher value on a position than others would.
Gambler's fallacy
Predicting absolutely random events on the basis of what happened in the past or making trends when there exists none. It is the mistaken belief that if something happens more frequently than normal during some period, then it will happen less frequently in the future.
Winner's curse
Tendency to make sure that a competitive bid is won even after overpaying for the asset. While behaviourally it is a win, financially, it may be a loss.
Herd mentality
This is a common behaviour disorder in investing community. This bias leads investors to follow the investment choices that others make. Small investors keep watching other participants for confirmation and then end up entering when the markets are over heated and poised for correction.
"It is better for reputations to fail conventionally than to succeed unconventionally."
- John Maynard Keynes
Anchoring
Anchoring is a cognitive bias that describes the common human tendency to rely too heavily on the first piece of information offered when making decisions. Investors hold on to some information that may no longer be relevant, and make their decisions based on that.
Projection bias
We project recent past to the distance future completely ignoring the distant past.

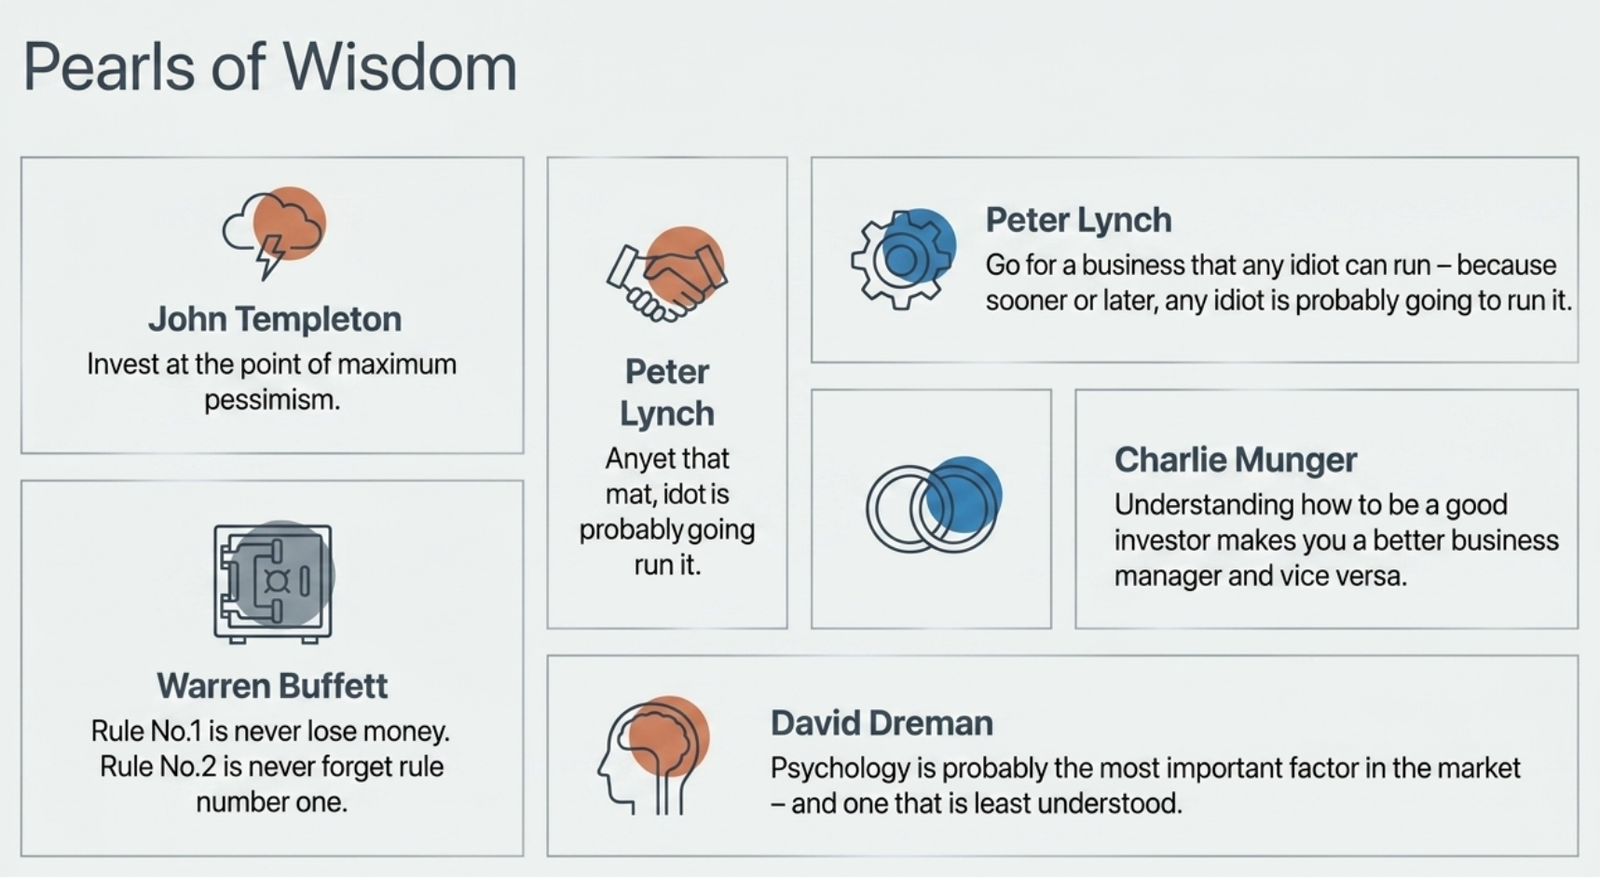
12.11 Some Pearls of Wisdom from Investment Gurus across the World
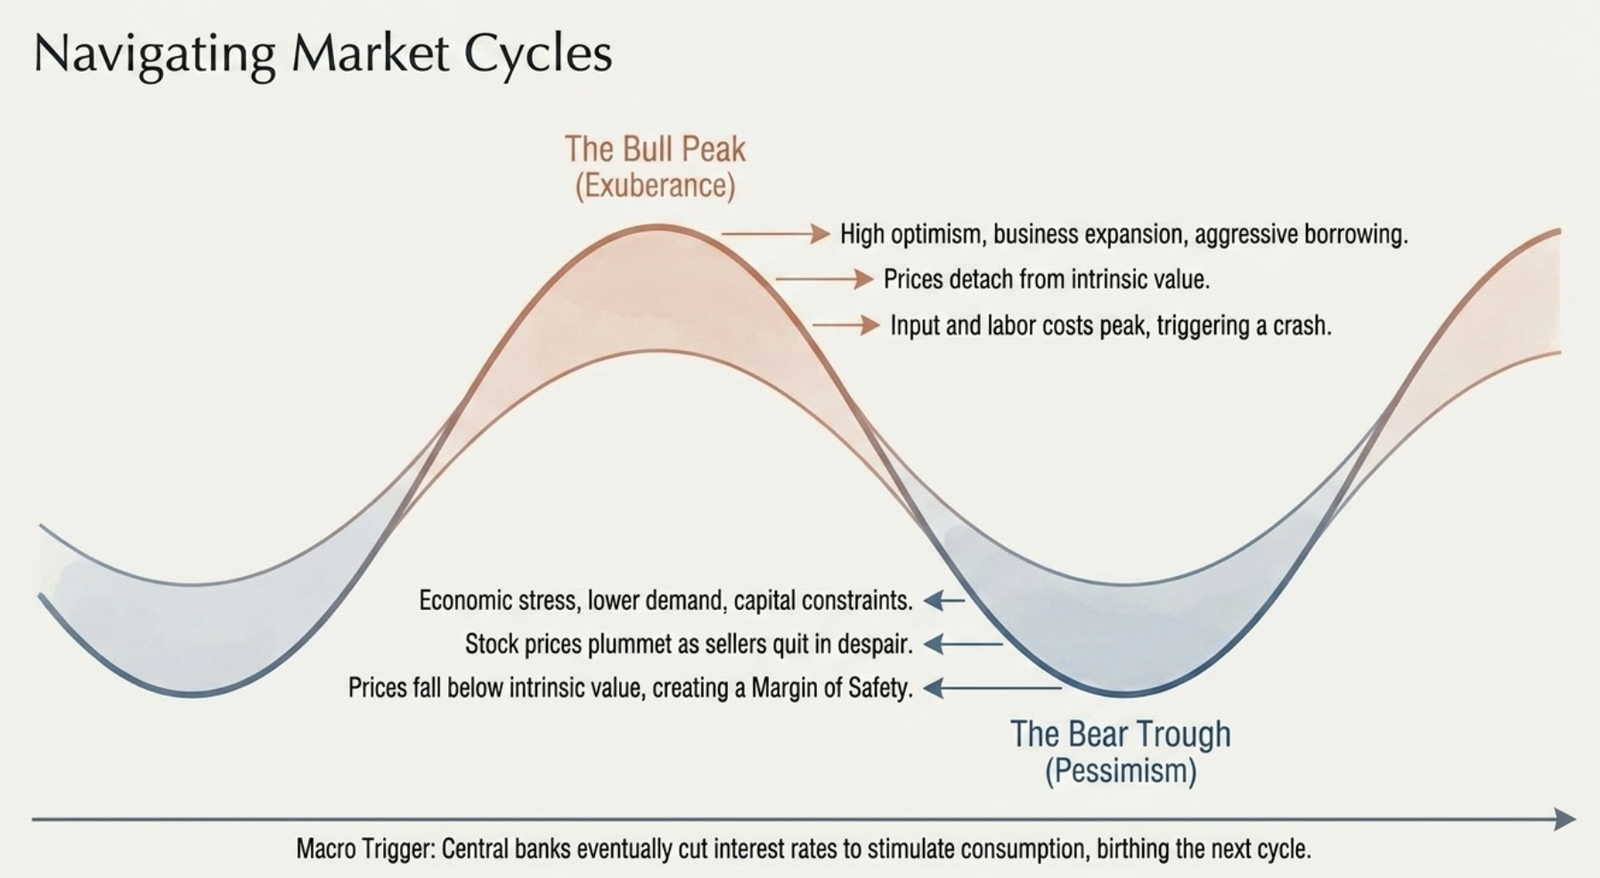
Stock markets are subject to bull and bear cycles. A bull market occurs when buyers are willing to pay higher and higher prices, as optimism about future performance is high — businesses are expanding, demand is growing, and they can price profitably. However, a bull market can overdo its exuberance: prices move beyond intrinsic values, businesses overborrow on optimistic forecasts, and input/labour costs rise until the market corrects with a crash.
A bear market follows when stock prices fall and correct themselves. Economic downturns create stress — lower demand, higher input costs, capital constraints, risk of business failure. Stocks may fall well below intrinsic values, attracting buyers who find valuations attractive. Central banks reduce interest rates to stimulate consumption and investment, slowly transitioning back to a bull cycle.
Benjamin Graham's "Mr. Market" Parable
An investor has invested $1,000 in a business along with a partner, Mr. Market. Mr. Market does a daily assessment of the firm's value and offers to increase or decrease the investor's share based on that assessment. While Mr. Market's assessments are sometimes based on actual business events, they are often swayed by his own emotions.
Graham's insight: The investor should not let Mr. Market's personal emotions drive their own. Rather, look for opportunities to exploit when Mr. Market misprices the business because of his emotions — buying when Mr. Market is pessimistic, selling when he is exuberant.

Quotes from Investment Masters:
Benjamin Graham:
"To achieve satisfactory investment results is easier than most people realize; to achieve superior results is harder than it looks."
"In the short run, market is a voting machine but in the long run, it is a weighing machine"
Charlie Munger:
"Understanding how to be a good investor makes you a better business manager and vice versa."
David Dreman:
"Psychology is probably the most important factor in the market – and one that is least understood."
John Tempelton:
"Invest at the point of maximum pessimism."
Peter Lynch:
"Go for a business that any idiot can run – because sooner or later, any idiot is probably going to run it."
Walter Schloss:
"If you can't find good value investing positions, park your money in cash."
Warren Buffett:
"Rule No.1 is never lose money. Rule No.2 is never forget rule number one."
12.12 Measuring liquidity of equity shares
One of the main objectives of stock exchanges is to provide liquidity i.e., the ease of buying and selling. However, not all shares are liquid. Liquidity can be achieved when there are large number of buyers and sellers for a given stock.
Liquidity of a stock can be measured using the following metrics:
(i) Stock turnover ratio
Stock turnover ratio = Number of shares traded during a given period / Number of outstanding free float shares
Free float shares refers to number of shares held by non-promoter group shareholders.
(ii) Traded value turnover ratio
Traded value turnover ratio = Traded value of the shares / Market capitalisation of the company
🃏 Flashcards
70 cards · click to reveal the answer · use search to focus on a topic
Sample Questions
1. Calling feature in bonds _____.
- Is most prevalent when interest rates are expected to fall
- Favours investors
- Is against the interest of issuers
- Is most prevalent when interest rates are expected to rise
2. ____________ bias can prevent investors from benefiting from market corrections.
- Projection
- Herd Mentality
- Anchoring
- Confirmation
3. Business risk is also known as operating risk, because this risk is caused by factors that affect the operations of the company. State whether True or False.
- True
- False
4. Dividend is a small component of the total returns from the equity. State whether True or False.
- True
- False
Continue Your Learning Journey
You've completed Chapter 12! Here's what comes next: