See it in action
Per-Broker Stop-Loss Discipline for Indian Investors
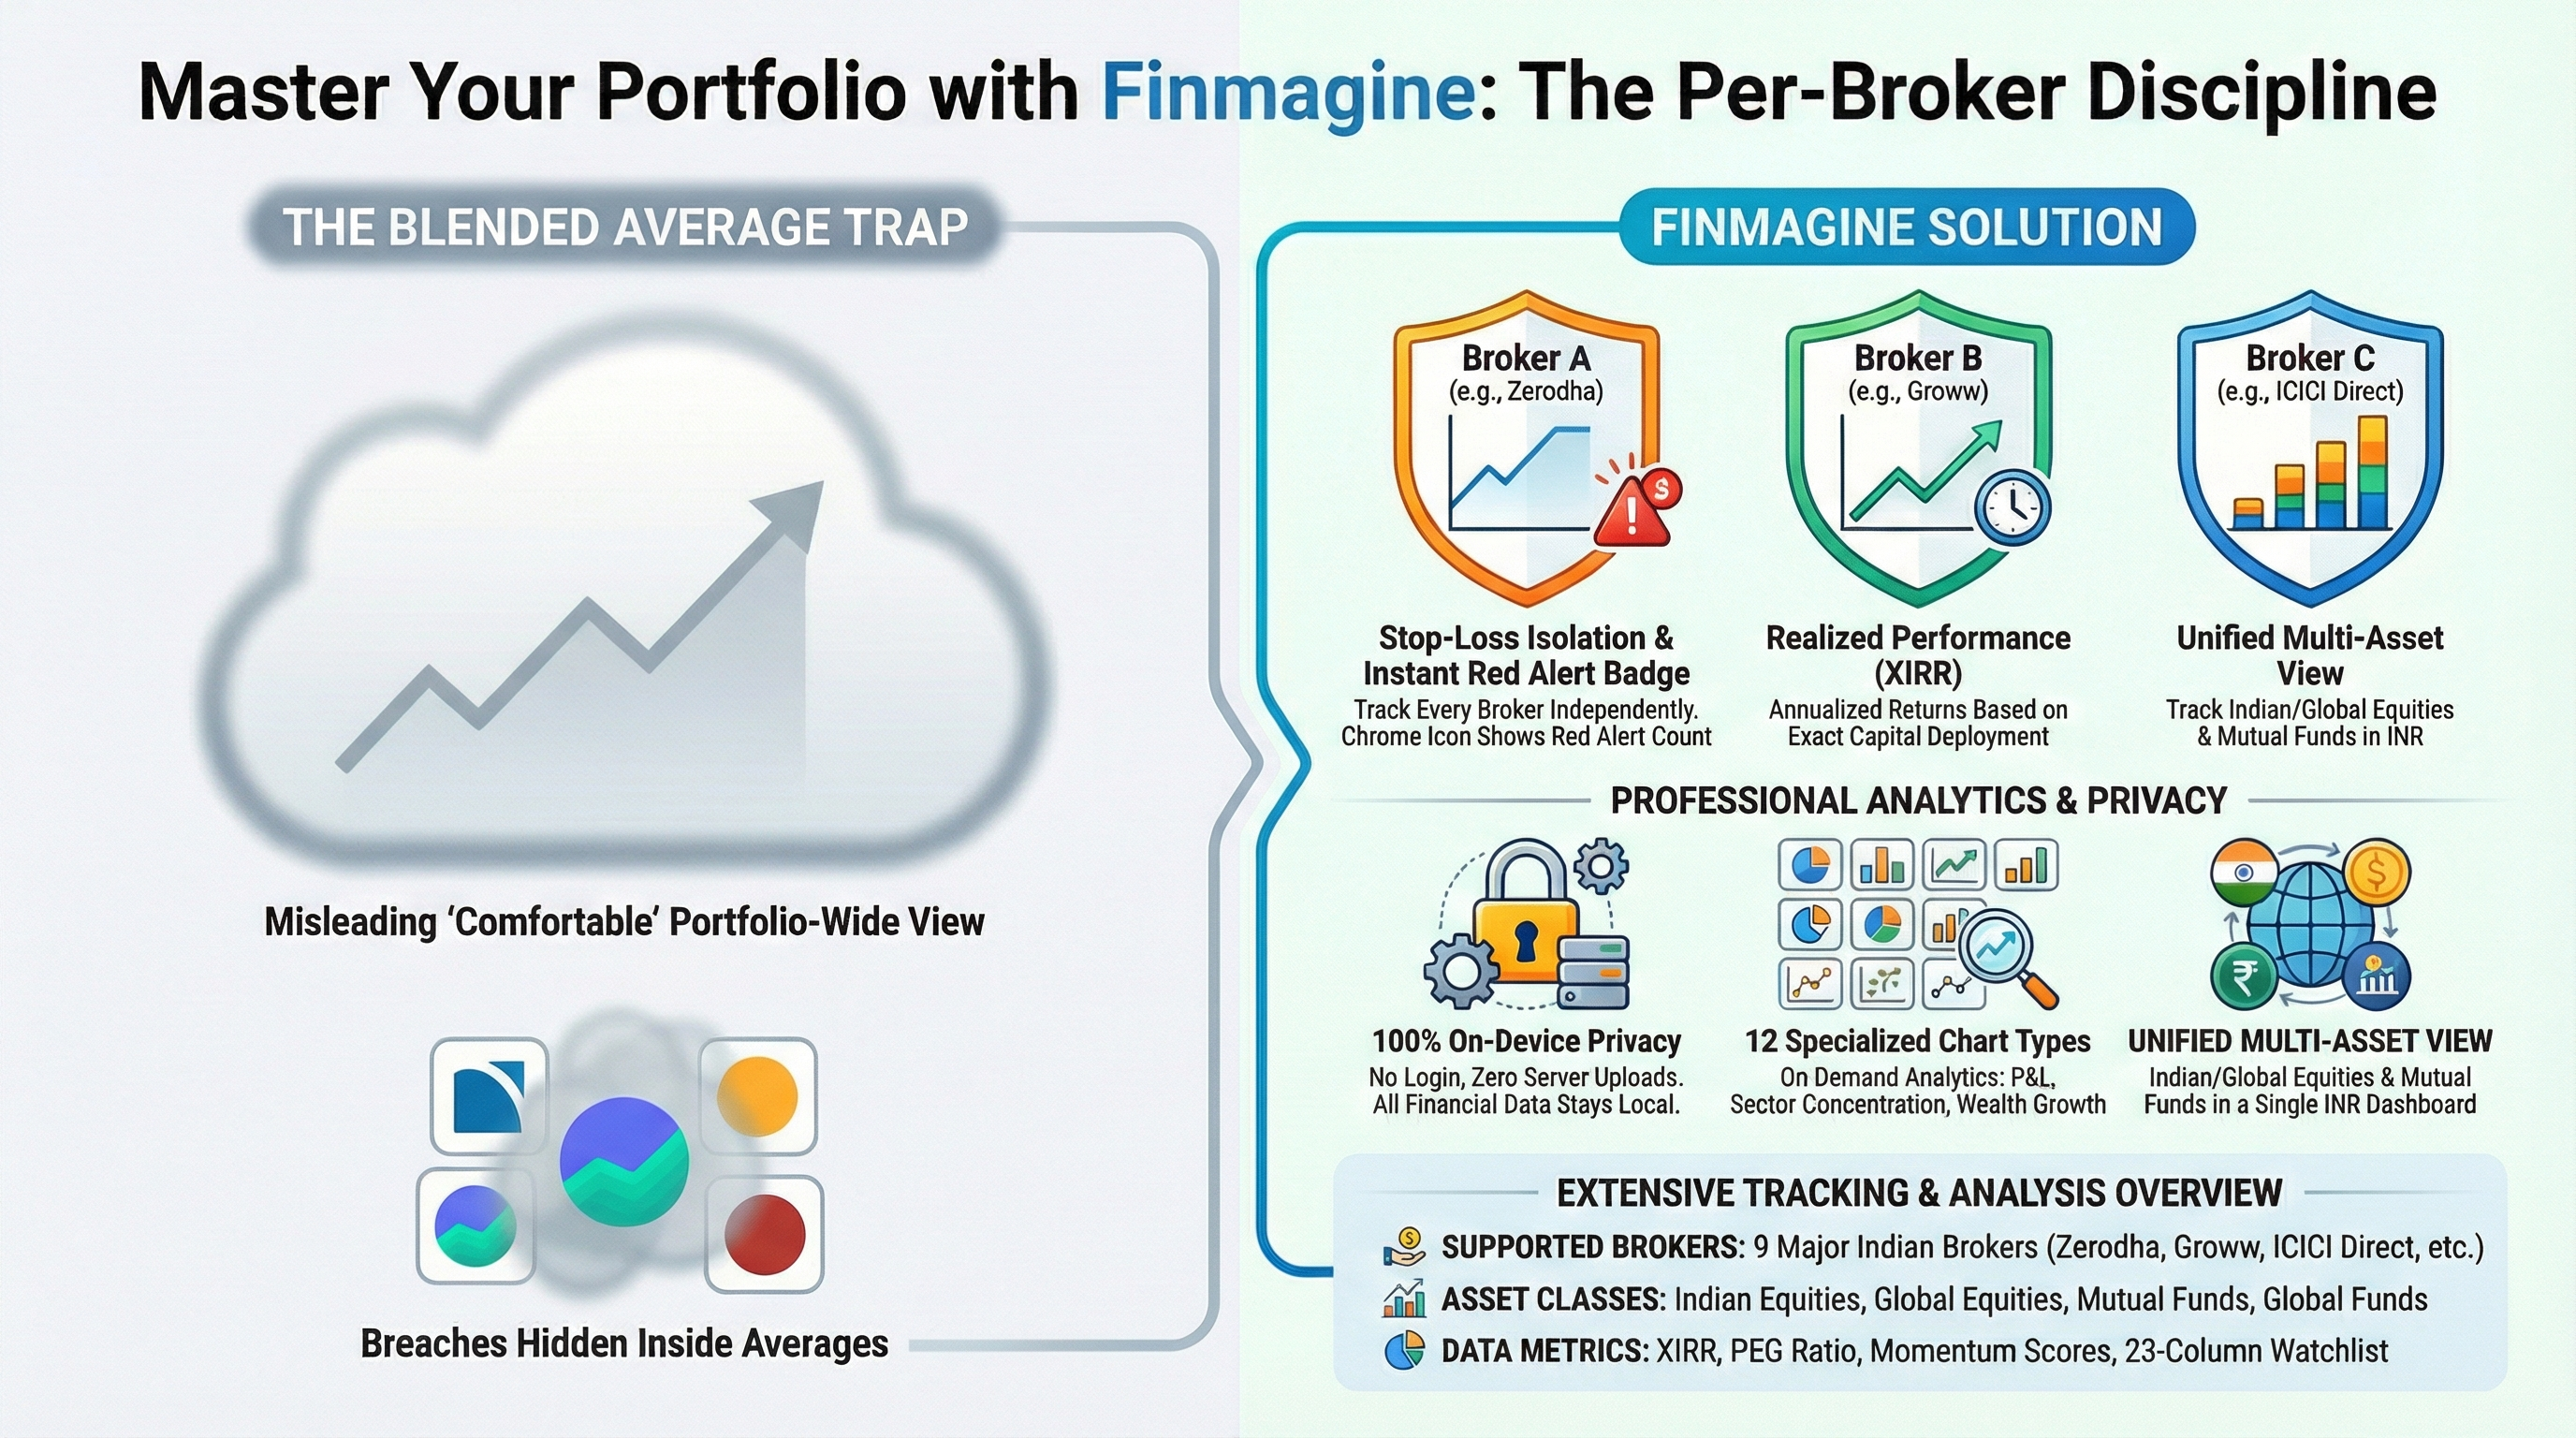
You hold SRF in Zerodha and Sharekhan. The blended average looks fine. But your Zerodha position is at −5.23% — past your stop-loss. Finmagine Portfolio Manager tracks every broker independently, so you never miss a breach hiding inside a comfortable average.
See it in action
Most portfolio apps show you a single blended P&L across brokers. That hides the most important signal: which specific broker position has breached your stop-loss.
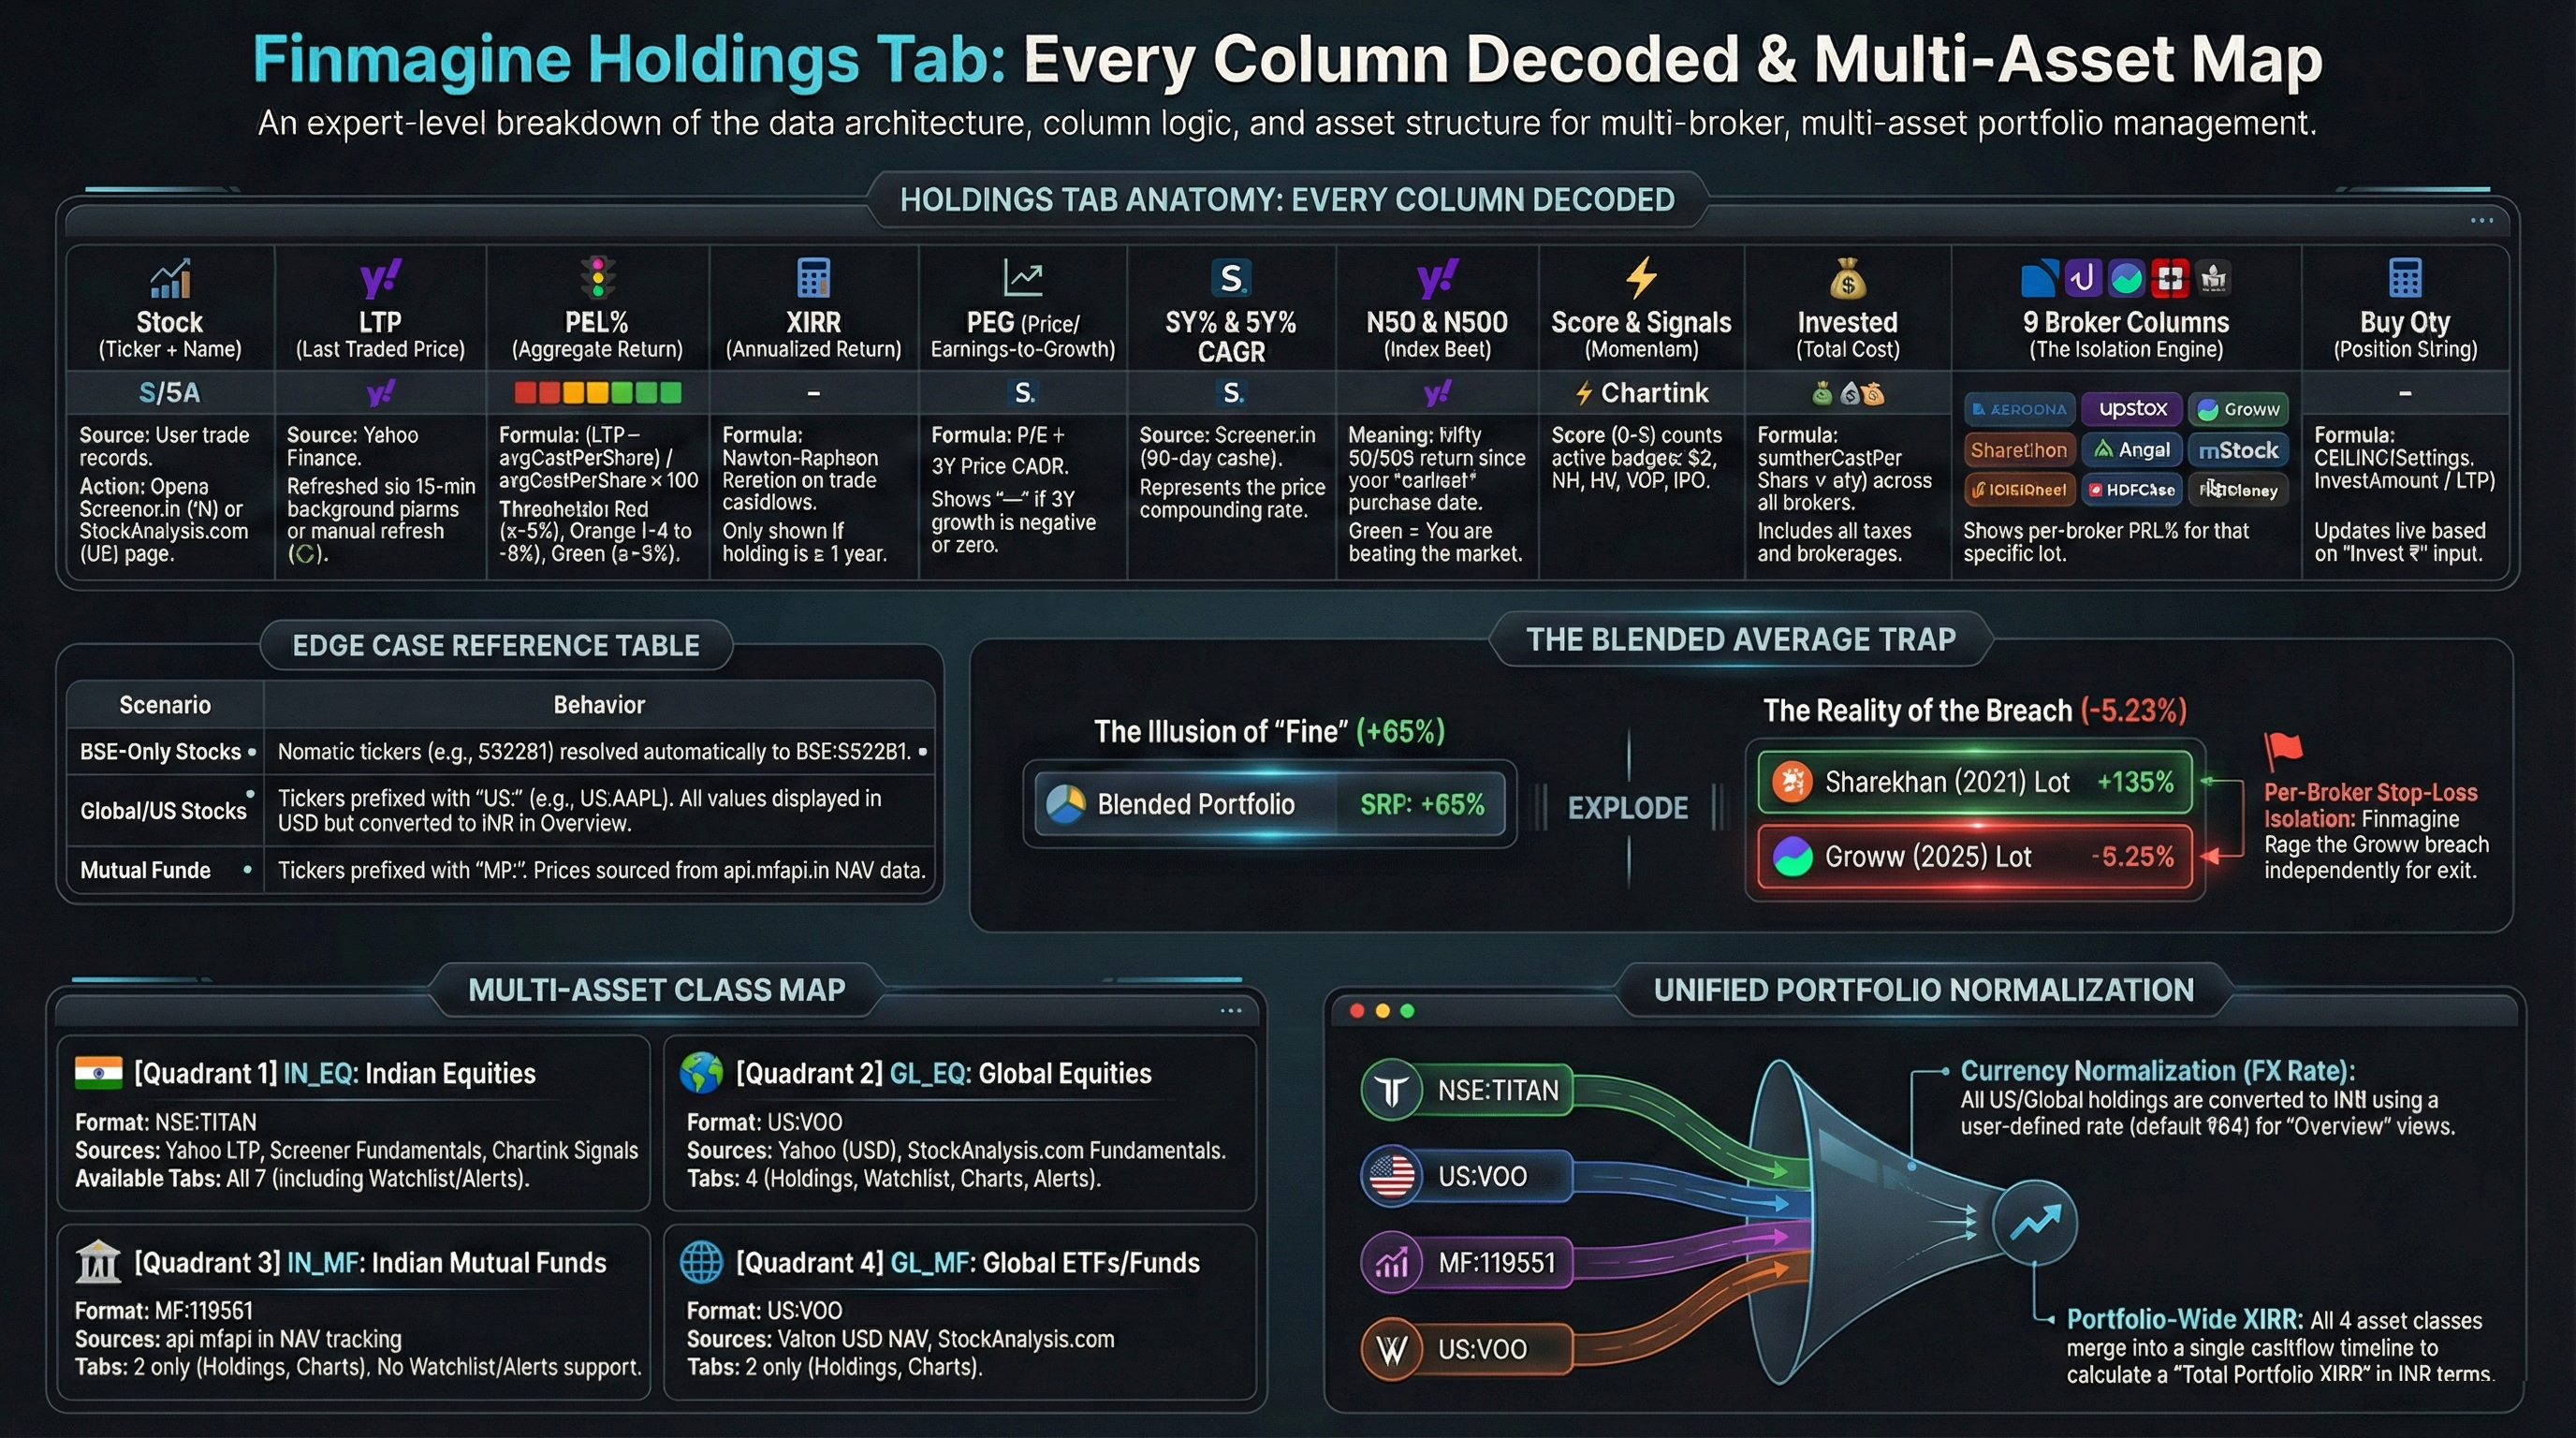
You bought SRF in Sharekhan in 2021 at ₹1,080 (+135% today) and in Groww in April 2025 at ₹2,700 (−5.23% today). The blended average looks like +65%. You feel fine. But your Groww position is past your −5% stop-loss and needs action now. Finmagine Portfolio Manager shows this immediately — per broker, per position.
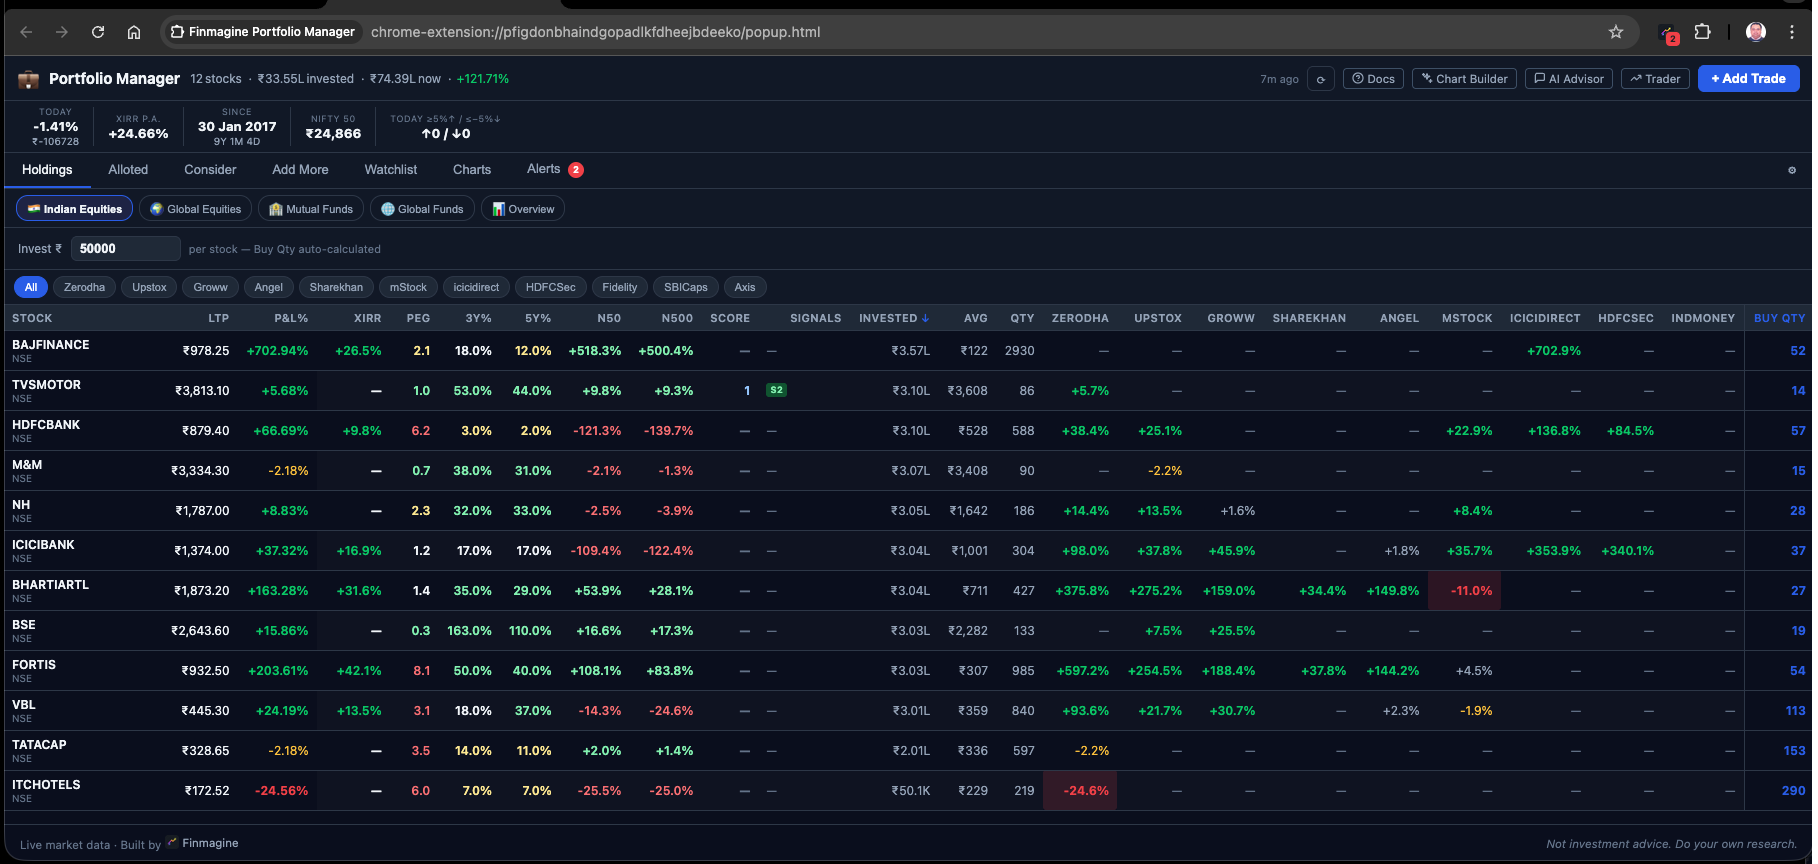
The Holdings tab with SRF held across two brokers. The Sharekhan position — bought in 2021 — is up +135%. The Groww position, bought in April 2025, is at −5.23%, past the stop-loss. The blended average column reads +65% and looks fine. Without per-broker columns, the breach is completely invisible.
The extension also counts exactly how many per-broker positions have breached your stop-loss and shows the number on the Chrome extension icon badge — without opening the app.
The extension is not connected to any broker — you enter trades manually using CSV import or the Add Trade form. Nine Indian brokers are pre-configured with accurate charge structures: Zerodha, Upstox, Groww, Sharekhan, Angel, mStock, icicidirect, HDFCSec, INDMoney. Each gets its own P&L% column in the Holdings table. Any unrecognised broker name defaults to zero-brokerage treatment.
Every tab filters your holdings differently so the right stocks surface at the right time.
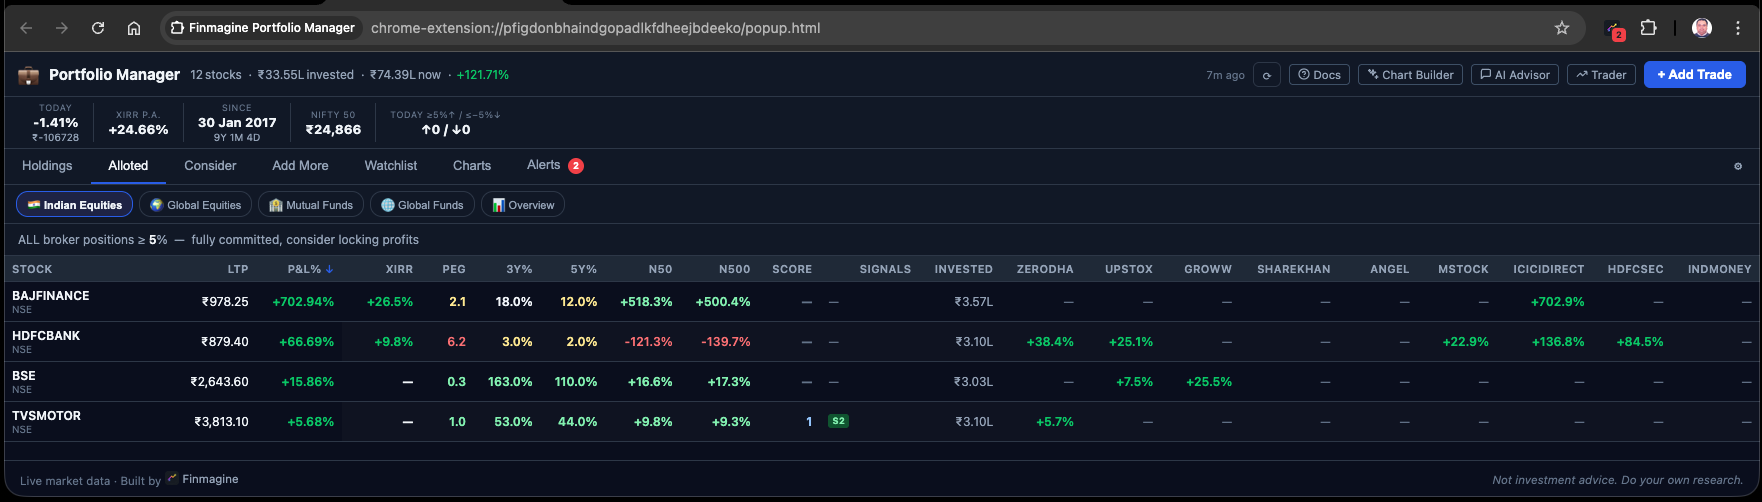
All positions. Live LTP, aggregate P&L%, XIRR p.a., invested amount, and one column per broker side by side. Sortable by any column.
Stocks where every broker position is above your alloted threshold. Fully committed — consider locking profits.
Stocks where total invested is below your target allocation. Under-allocated — worth adding more across brokers.
Stocks where any broker position is below your add-more threshold. Room to accumulate at that specific broker.
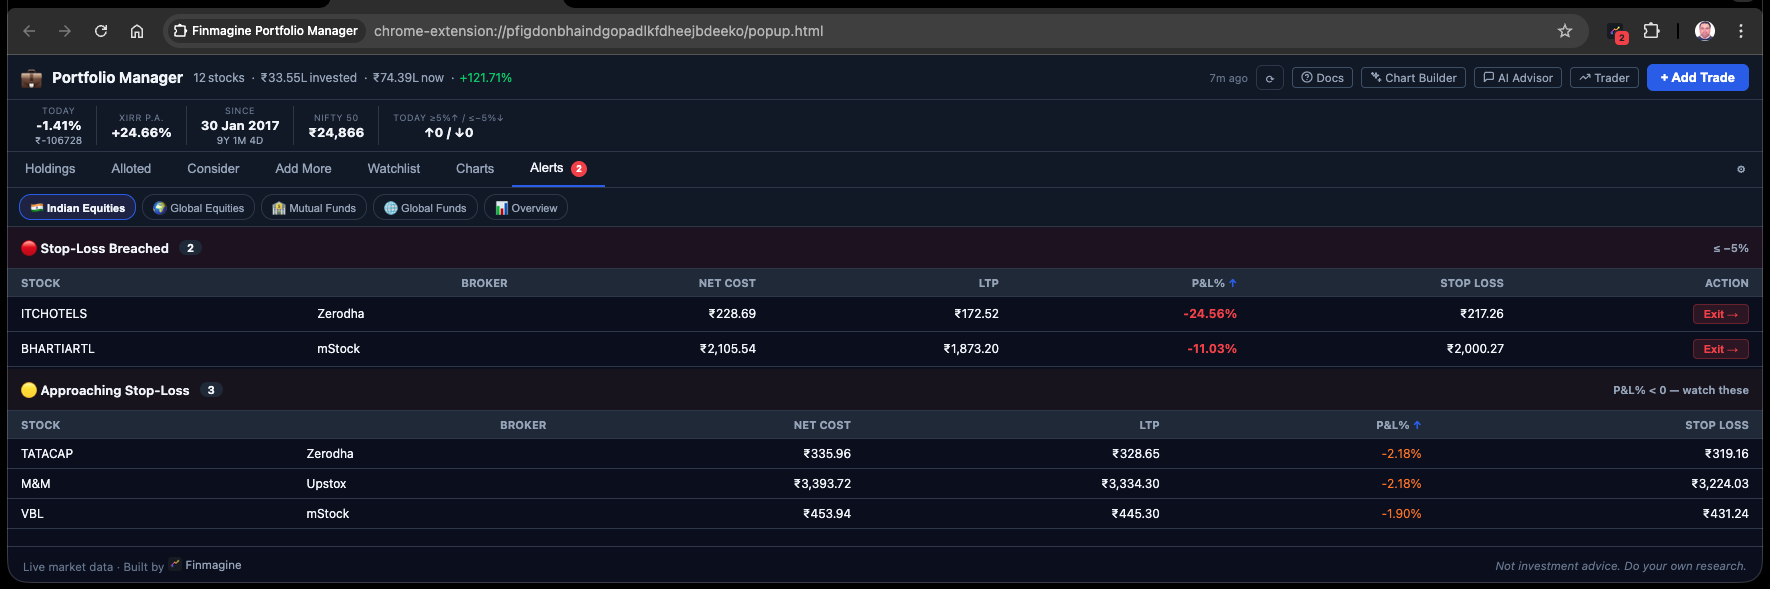
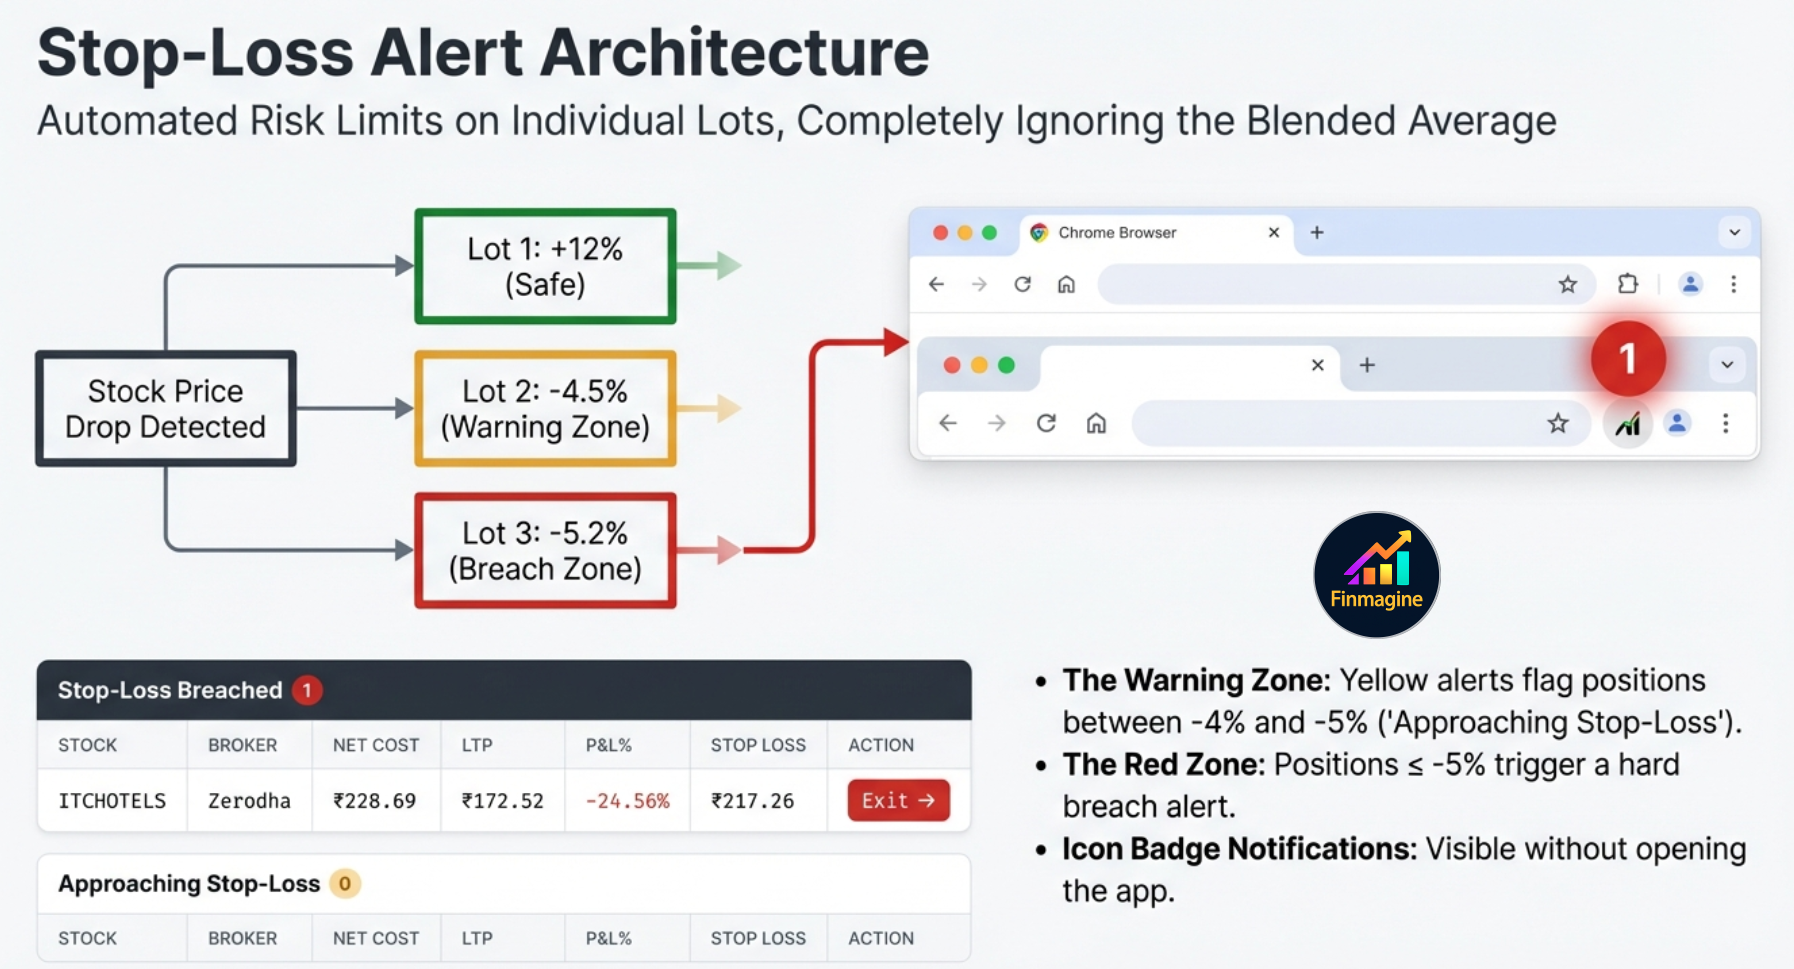
Two lists: Stop-Loss Breached (per-broker, ≤ −5%) and Approaching Stop-Loss (any negative P&L). The extension badge shows breach count.
Per-broker clarity in action — each tab filters differently
Every stock row shows its aggregate LTP, P&L%, and XIRR alongside a separate column for each broker you use. Sortable by any column — click XIRR to rank your best long-term compounders instantly.
Two lists: Stop-Loss Breached (red rows) and Approaching Stop-Loss (amber rows). Each entry shows the exact broker, invested amount, current value, and per-broker P&L% — never a blended number.
Stocks where your total invested is below the Consider threshold (default ₹3,00,000). These are positions you believe in but haven't fully committed to yet — the tab surfaces them automatically.
Alloted tab — every broker position above threshold
Does disciplined rebalancing beat buy-and-hold in your actual portfolio — after paying LTCG and STCG taxes? The Backtest tab runs four parallel scenarios (Hold, Threshold gross, Threshold net, Calendar net) on your real trades and real lot history, from any start date.
Each broker position is tracked independently. A stop-loss breach at one broker is flagged even if the aggregate P&L looks fine. Configurable threshold (default −5%).
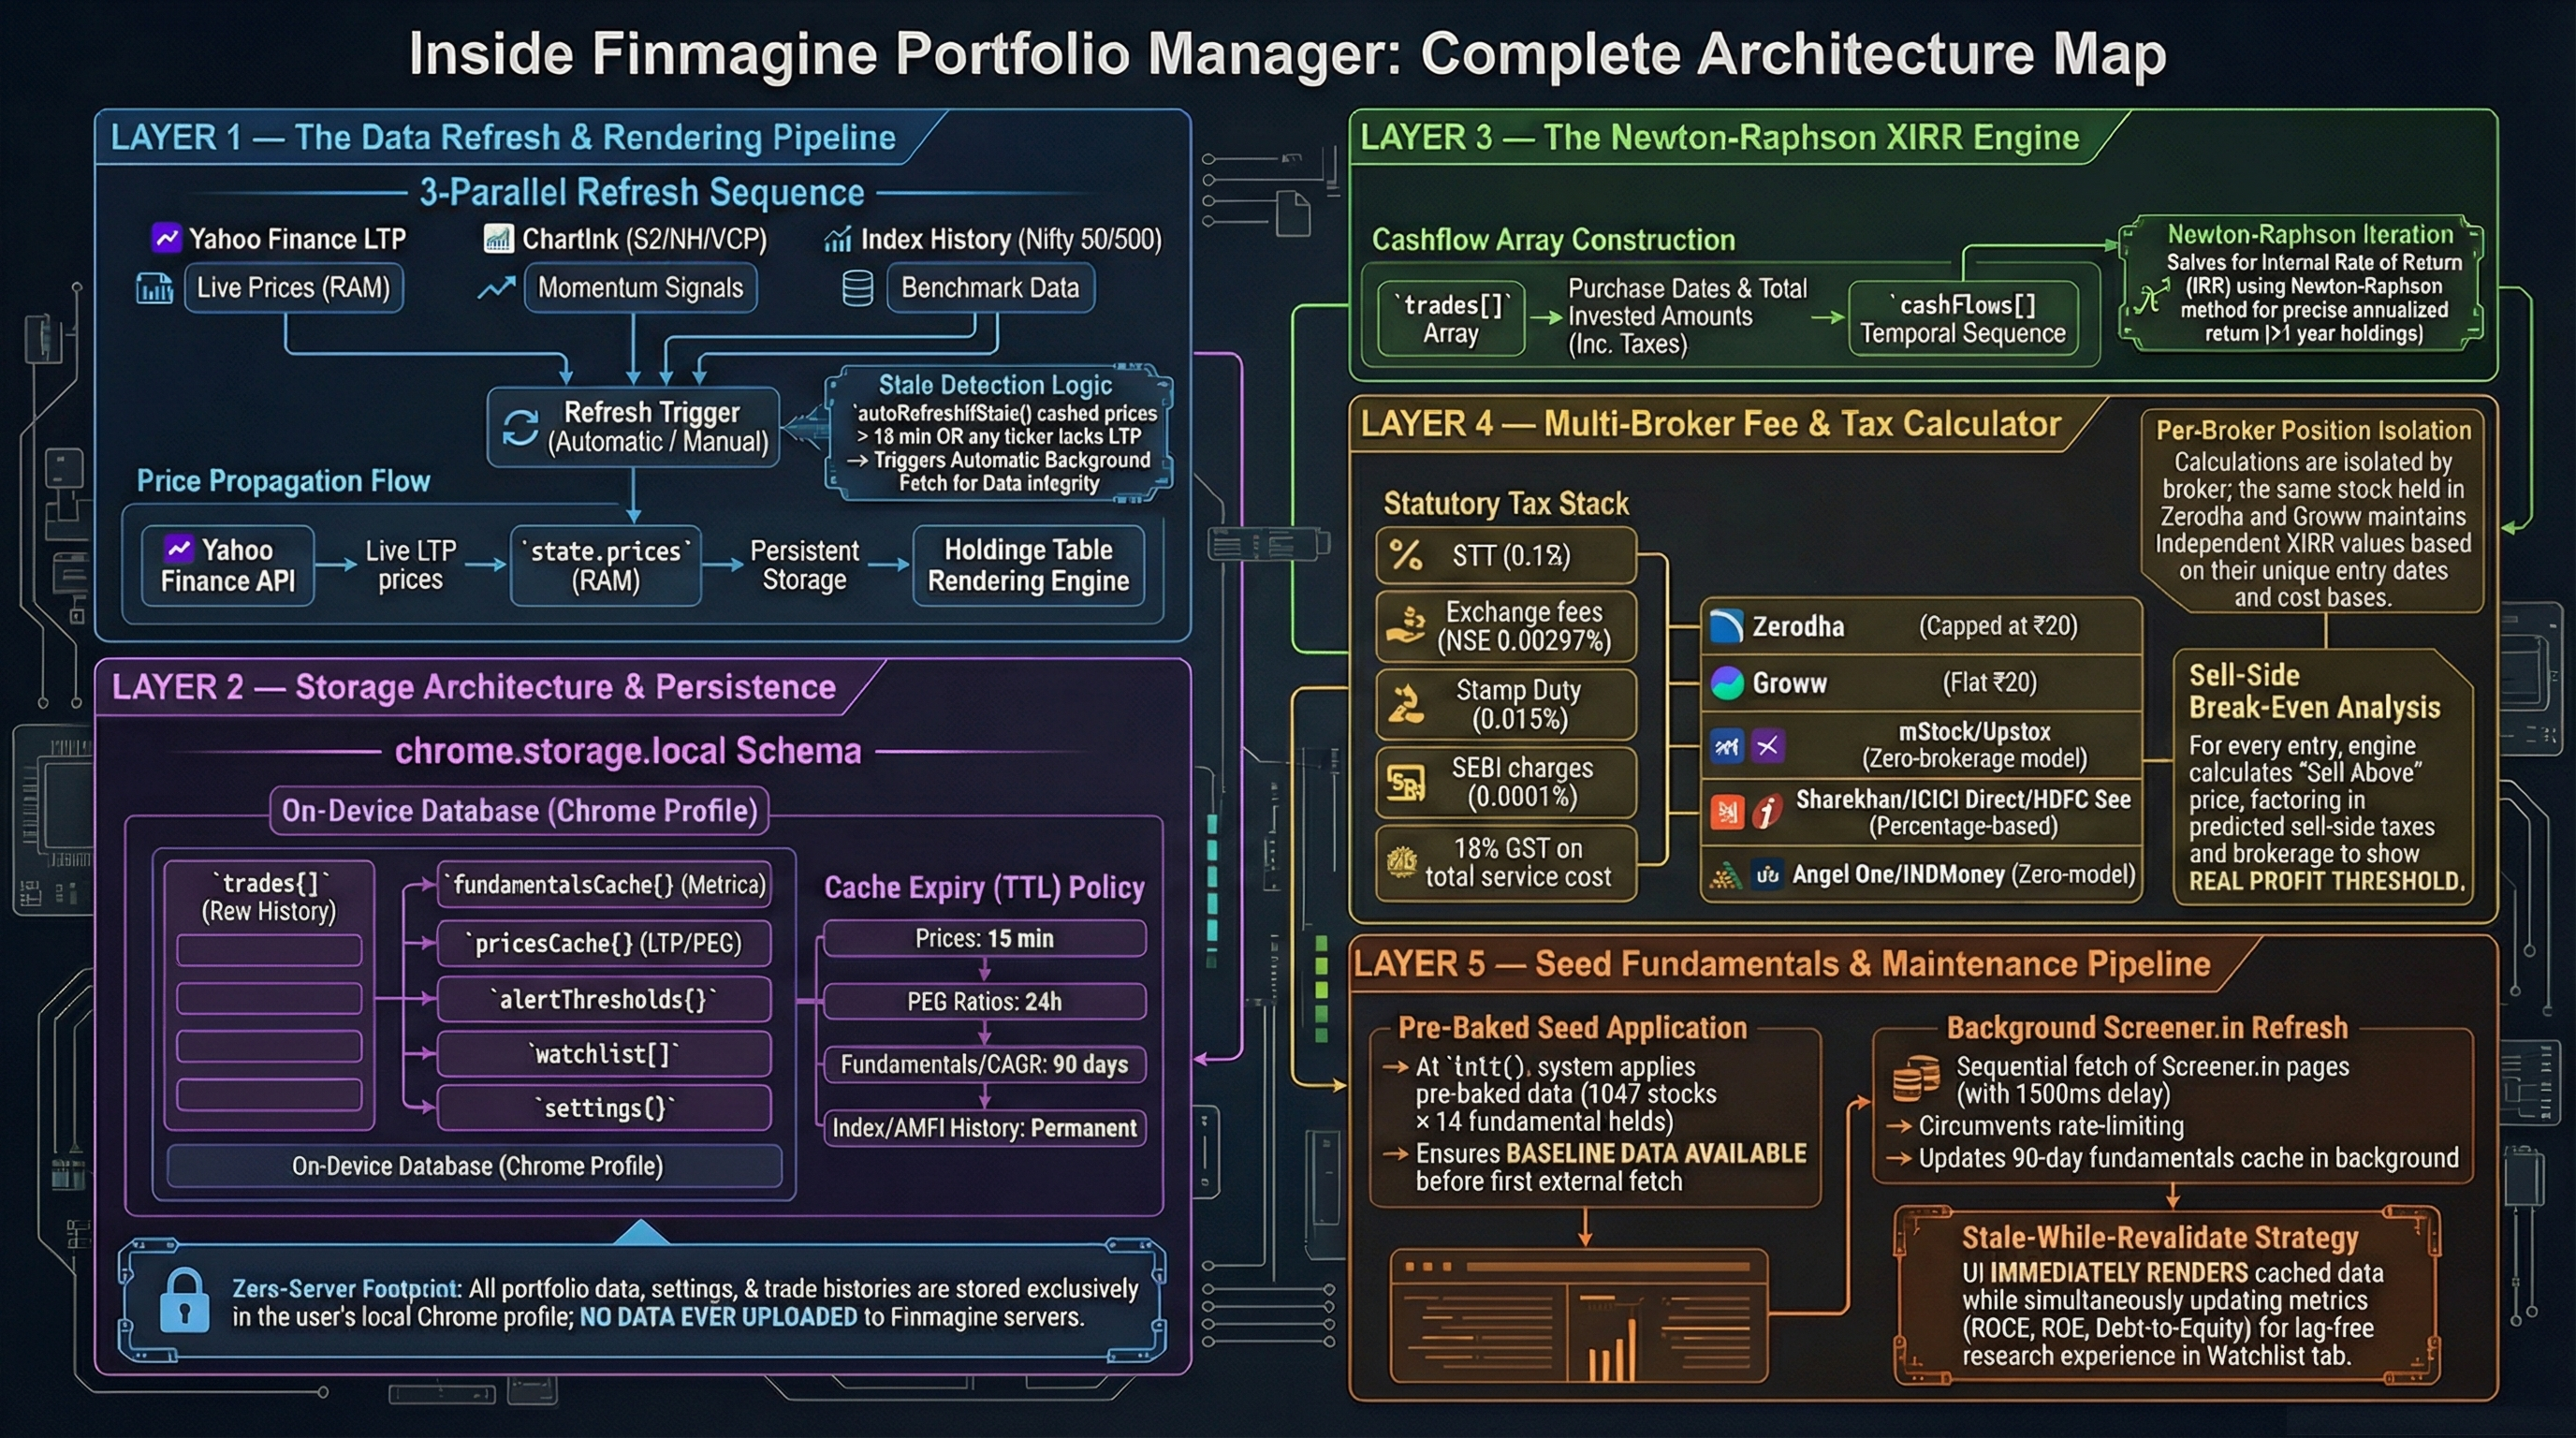
Annualised return per stock and per trade, computed via Newton-Raphson XIRR. Only shown for holdings older than 1 year — sub-year XIRR is mathematically misleading and intentionally suppressed.
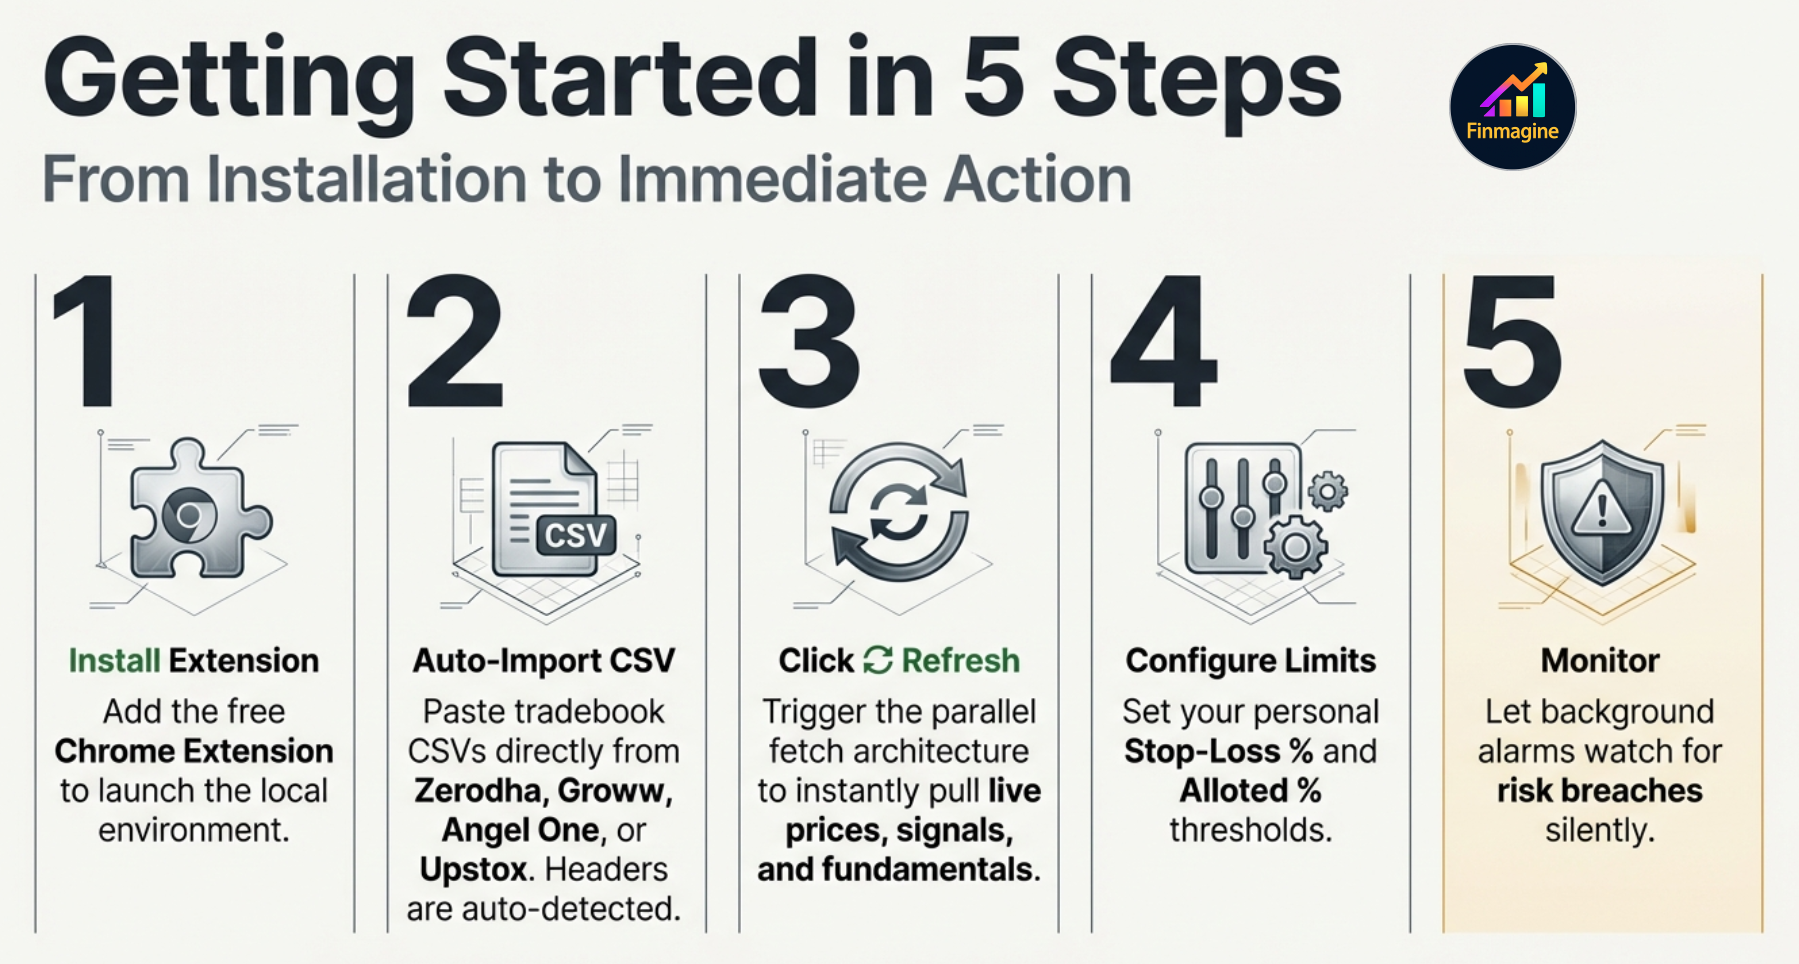
Prices auto-refresh on open if stale (>15 min) and refresh in the background every 15 minutes via Chrome Alarms. NSE → .NS suffix, BSE → .BO suffix.
Set a target amount (e.g., ₹50,000) and every stock row instantly shows the recommended Buy Qty = ⌈₹50,000 ÷ LTP⌉. Perfect for deploying a fixed amount across 20 stocks.
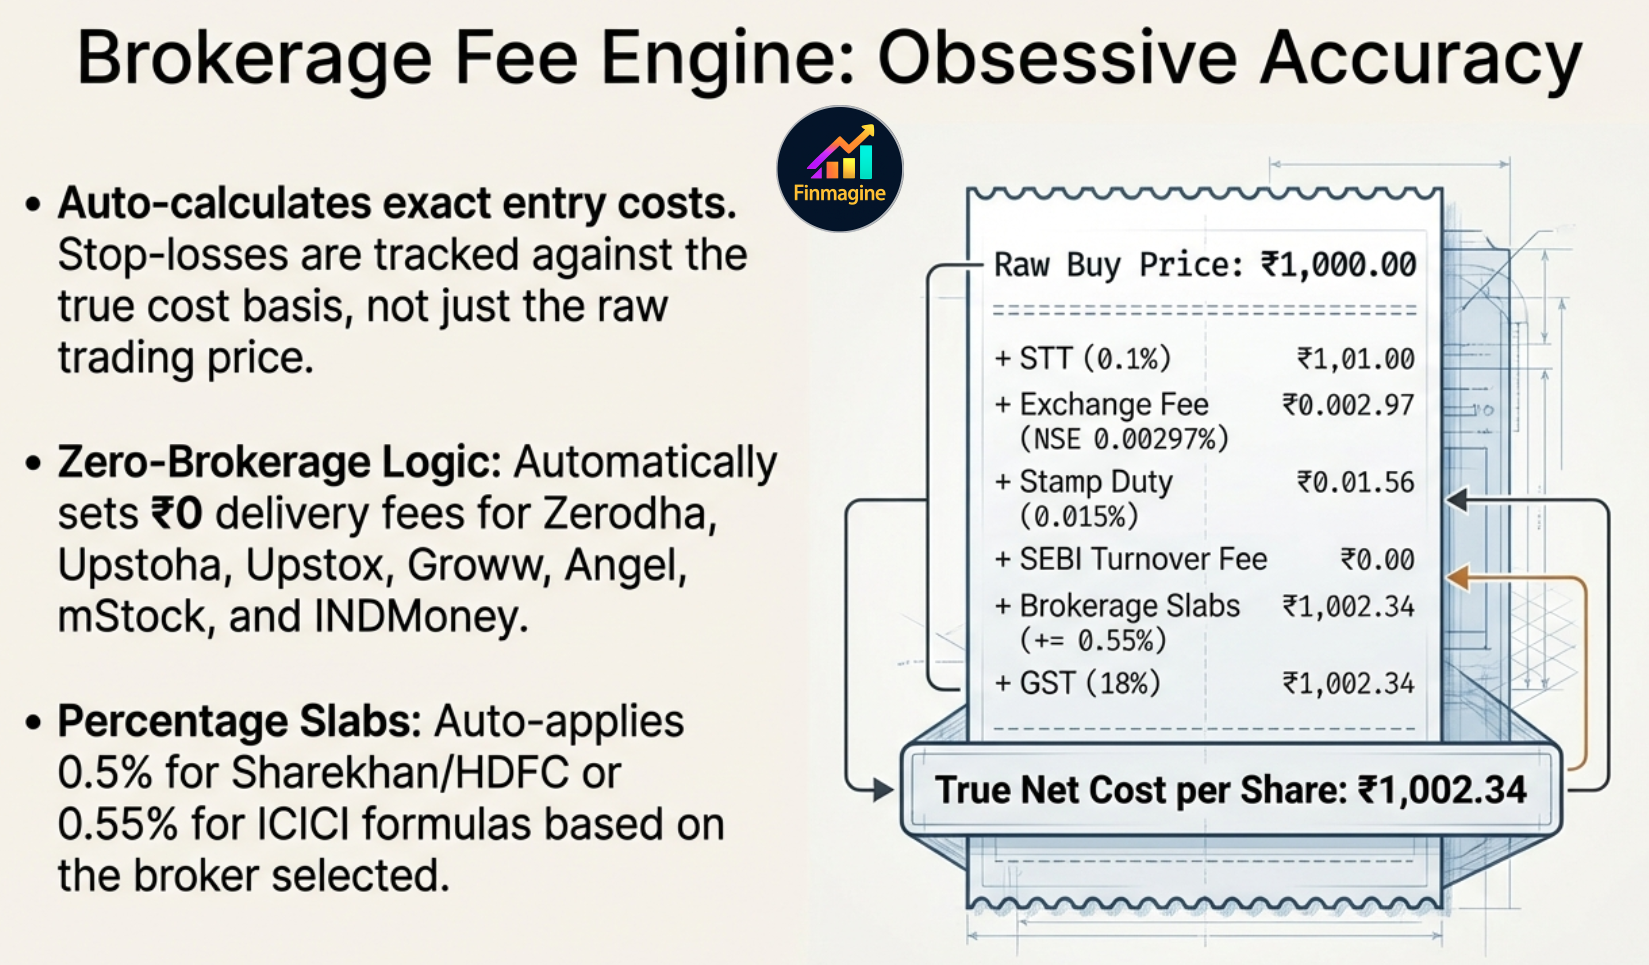
Every buy trade computes STT, exchange fee, stamp duty, SEBI, brokerage, and GST for that broker's exact fee structure. Net Cost/Share is the true cost basis — not just the buy price.
Paste your broker's tradebook CSV directly — format is auto-detected from column headers. SELL rows are silently skipped. Native detection for popular broker formats; a generic import handles everything else. Supports ISO, DD-MM-YYYY, and "16 Jan 2023" date formats.
Click any trade to see a sell form with live preview: Gross Proceeds → Sell Charges → Net Proceeds → Cost Basis → Realized P&L (₹ and %). Partial sells reduce qty while preserving cost basis.
The Chrome toolbar icon shows a red badge with the count of per-broker stop-loss breaches — updated every 15 minutes automatically. Know your risk without opening the app.
Alerts tab — stop-loss breaches surfaced instantly
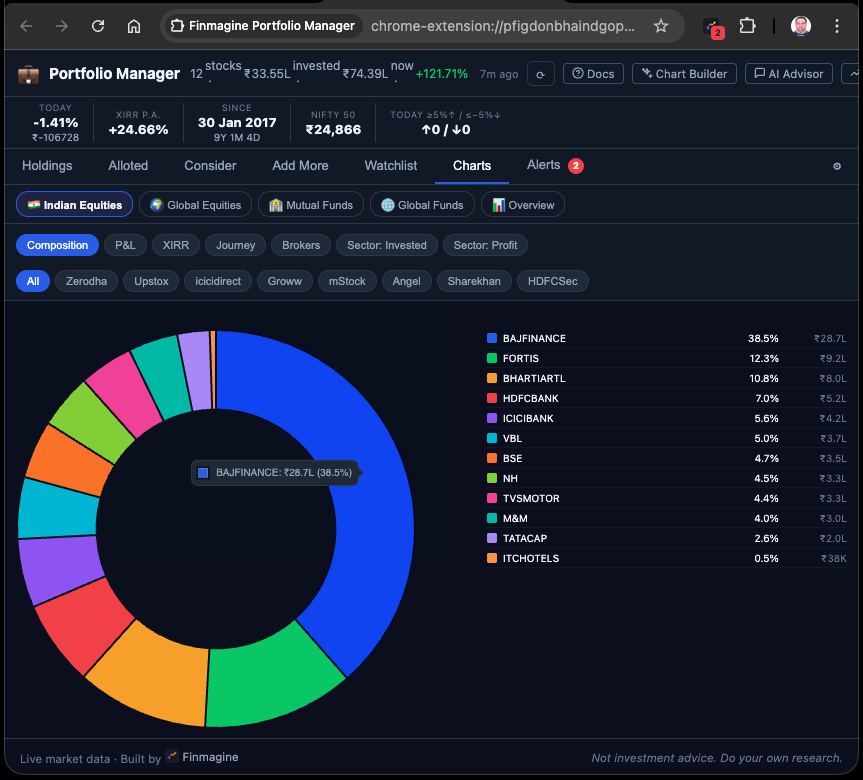
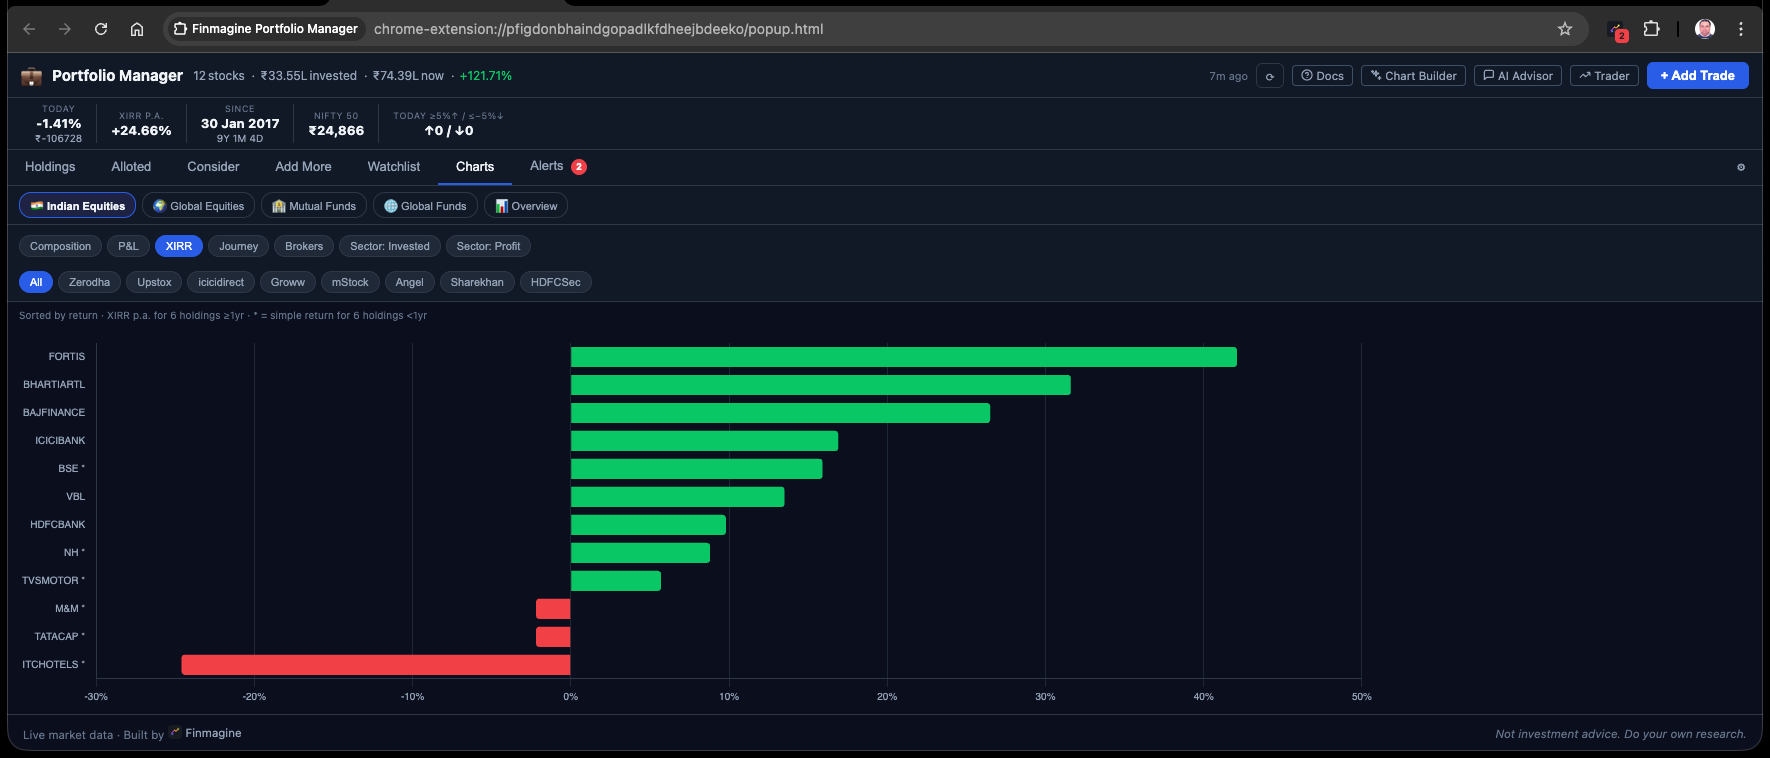
The Charts tab gives you seven visual lenses on any asset class: Composition, P&L, XIRR, Journey, Brokers, and two Sector views. Switch asset class pills to see the same chart types instantly for Indian Equities, Global Equities, Mutual Funds, or Global ETFs.
Composition — holdings by weight
XIRR — annualised returns by stock
Enter trades via the form — broker name, date, price, qty. The broker field is a free-text label: use any name. Or paste a CSV export from your broker. Charges are auto-computed — no manual entry needed.
Yahoo Finance prices are fetched on open and refreshed every 15 minutes in the background. P&L%, XIRR, and stop-loss status update within seconds of clicking ⟳.
Check the Alerts tab for stop-loss breaches. Use Add More to top up at a specific broker. Sort Holdings by XIRR to see your best long-term positions. Sell via the trade detail modal.
⏱ Why Does a New Stock Show Partial Data for a Minute or Two?
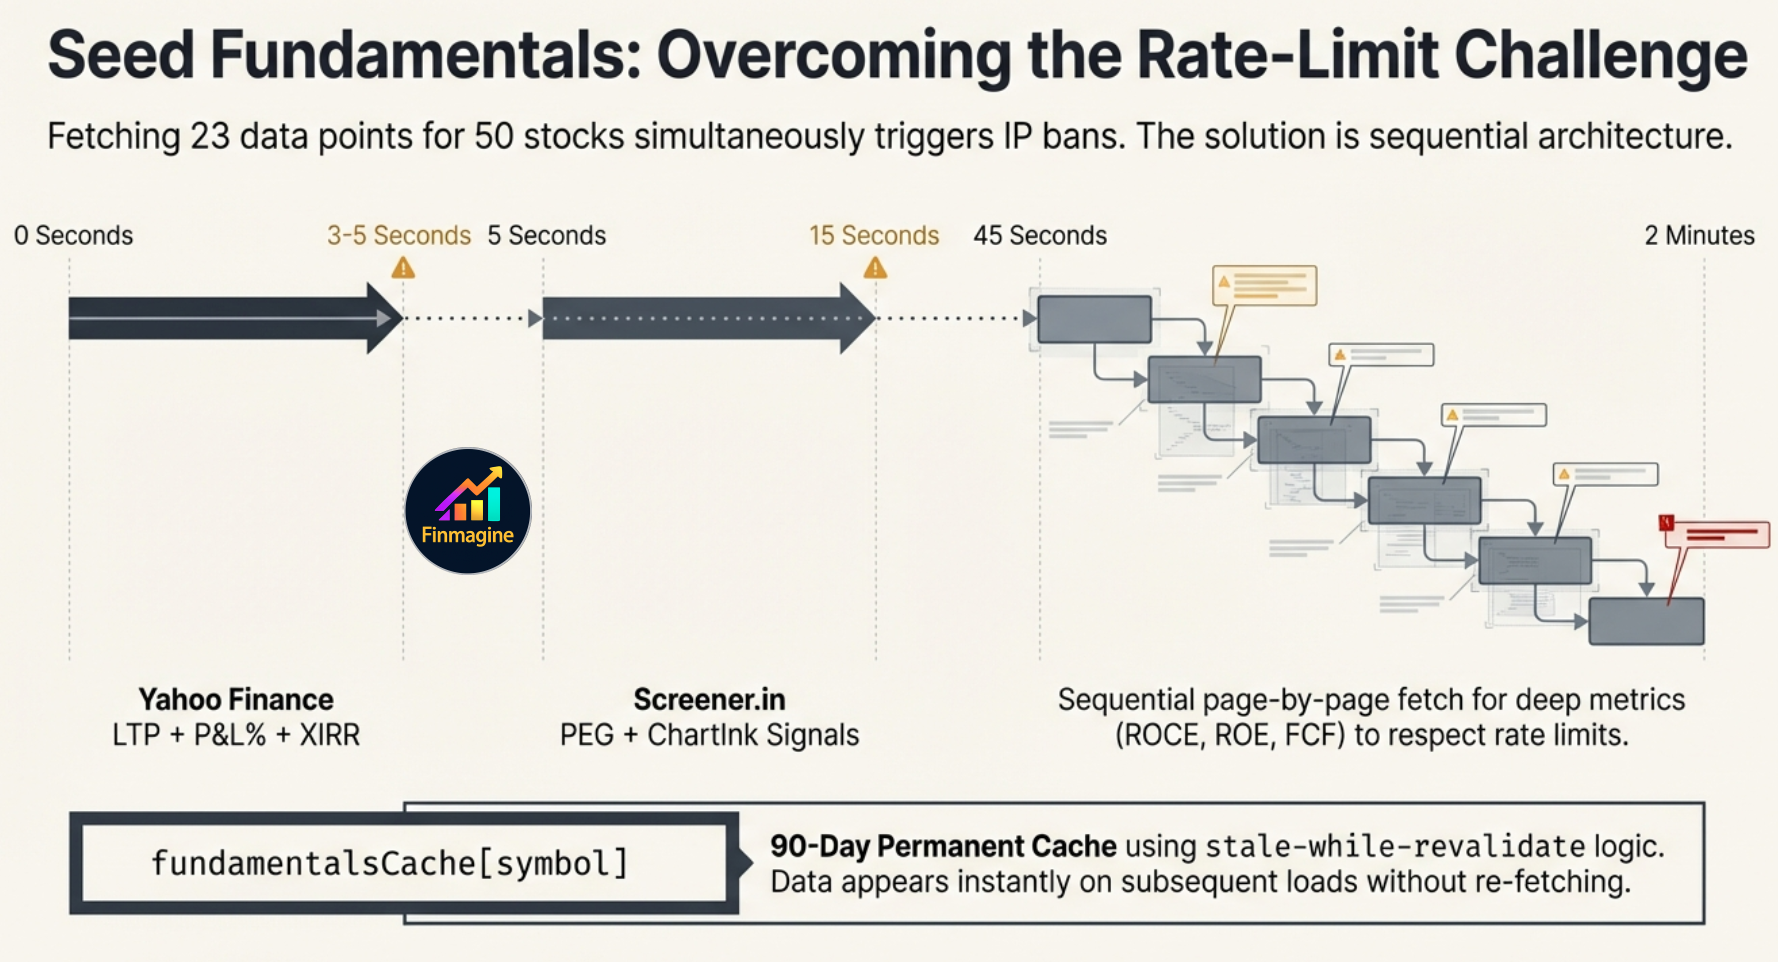
Stats for each stock come from three separate sources on a staggered schedule. New stocks trigger all three fetches for the first time:
This happens once only. All fundamentals are cached for 90 days — on every subsequent open the data appears instantly. The delay is intentional: the extension fetches Screener.in page-by-page, sequentially, to avoid rate-limiting.
Core portfolio data — trades, P&L, stop-loss settings — is stored in Chrome's local storage on your device. No account needed for core portfolio tracking. Live prices are fetched directly from Yahoo Finance. Fundamental data (ROCE, sector, ratios) is served from Finmagine's shared cache — faster than hitting Screener.in directly and reduces external rate-limiting risk.
Optional Cloud Backup: Enable cloud sync (requires a Finmagine Premium subscription) to back up and restore your portfolio across devices. When enabled, your trades, settings, and watchlist are stored on Finmagine's servers. You control when sync runs and can disable it at any time.
The extension requests three permissions: storage (portfolio data),
alarms (15-minute price refresh), and
notifications (near-pivot watchlist alerts). No tab access, no browsing history, no clipboard.
Different investors have different pain thresholds. All limits are set in the Settings tab:
Default −5%. Any broker position below this triggers a breach alert and contributes to the badge count.
Default +5%. When all brokers are above this, the stock moves to the Alloted tab.
Default +5%. When any broker is below this, the stock appears in Add More.
Default ₹3,00,000. Stocks with total invested below this appear in the Consider tab.
The Watchlist tab is a research shortlist, not a price ticker. It shows 23 fundamental columns — P/E, P/B, ROCE, ROE, D/E, OPM%, NPM%, FCF, Sales%, EPS%, pledging, and FII% — colour-coded green/amber/red and sortable by any column. Holdings auto-include with a HOLD badge so you can compare research candidates directly against what you already own.
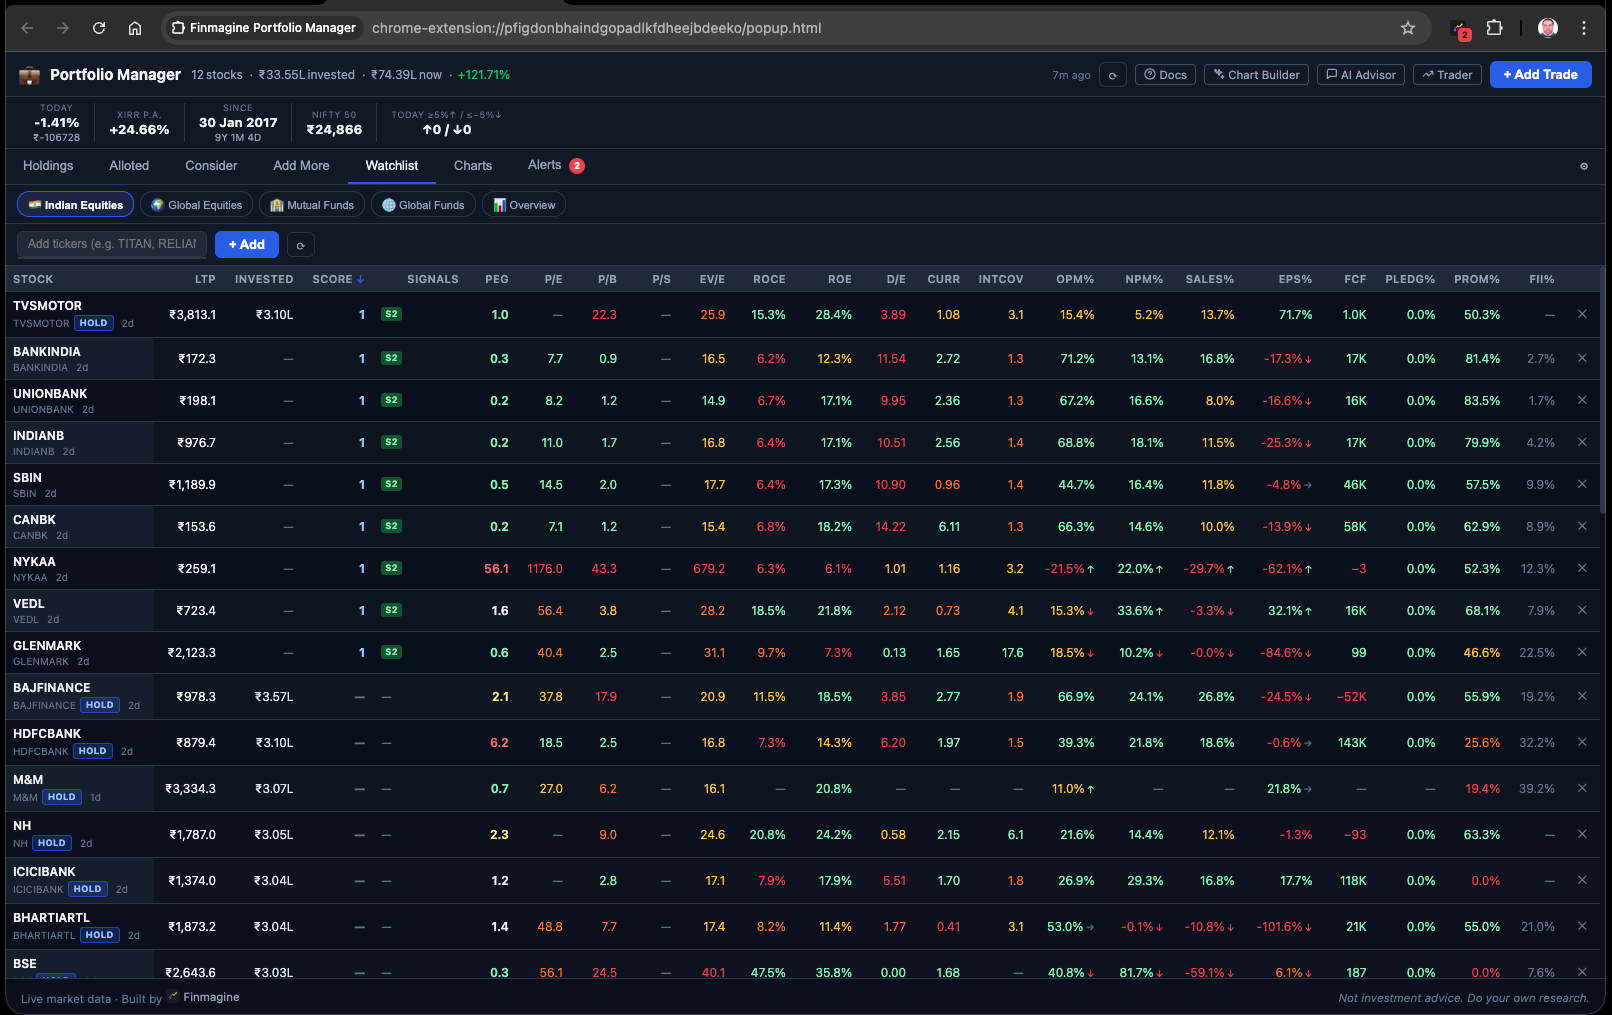
Every fundamental column is colour-coded: green for strong values, amber for average, red for concerning. P/E, P/B, P/S, EV/EBITDA, ROCE, ROE, D/E, Current Ratio, and Interest Coverage all in one scrollable row per stock.
Your existing holdings appear automatically with a HOLD badge so you can compare stocks you own directly against research candidates on identical metrics. Click any column header to sort the entire list.
Video walkthrough · Deep-dive audio · Visual infographics · 90 flashcards
Institutional Portfolio Discipline Without the Cloud
A ~30-minute deep-dive podcast covering the Newton-Raphson XIRR engine, 4-layer cache architecture, ChartInk CSRF session piggybacking, staggered Screener.in fetching, cohort-based Journey chart, and the philosophy of local-first FinTech.
90 Flashcards — Click Any Card to Flip
40 investor-facing cards + 50 technical architecture cards.
The Backtest tab answers the question every serious long-term investor eventually asks: should I rebalance my portfolio — and has it actually helped, after paying taxes?
Most rebalancing calculators use hypothetical portfolios and assumed return rates. This one uses your actual trades, your actual lot prices, and your actual tax situation — and runs the simulation forward from any start date using real Yahoo Finance monthly prices.
A complete 9-article guide covering every feature — from per-broker stop-loss discipline to XIRR, charts, watchlist research, multi-asset tracking, the Decision Journal, v1.1.0 upgrades, and the new Backtest rebalancing simulator (Article 9).
Per-broker tracking, 7 tabs, 4 asset classes, live XIRR, Index Beat, PEG, and 5 ChartInk signals. Video guide, 30-min audio deep-dive, infographics, and 90 flashcards.
The -5% rule, three-colour badge system, Alloted / Consider / Add More tabs, re-entry model, alert configuration. 30 flashcards.
Why P&L% misleads. Newton-Raphson XIRR, Index Beat vs Nifty 50/500, permanent cache architecture, portfolio XIRR. 30 flashcards.
7 per-AC charts (Composition, P&L, XIRR, Journey, Brokers, Sector ×2) + 5 Overview charts + History ✦. What each answers and when to use it. 25 flashcards.
P/E, ROCE, ROE, D/E, FCF, OPM%, pledging, FII% — colour-coded and sortable. HOLD badges for Holdings. MCap chips, sort persistence, and Watchlist Journal. 30 flashcards.
IN_EQ, IN_MF, GL_EQ, GL_MF — ticker formats, AMFI NAV, USD→₹ FX conversion, unified portfolio XIRR, and the 📊 Overview pill. 25 flashcards.
Record your investment thesis at trade time. 7 category chips, auto-prefill rule engine, Pattern Analysis to spot your best and worst decision types. 30 flashcards.
True portfolio value over time vs DCA benchmark, stock split & bonus modal, dark/light theme, PG3Y%/PG5Y% profit growth CAGR columns. 25 flashcards.
Four parallel scenarios (Hold / Threshold gross & net / Calendar net) on your real trades and lot history. Tax-aware LTCG/STCG model, FIFO vs HIFO comparison, NAV chart, tax drag, and rebalancing event log. 30 flashcards.
Portfolio Manager pairs naturally with our other free Chrome extensions — each solves a different part of the research and monitoring workflow.
Track Indian Equities, US Stocks, Mutual Funds & Global ETFs — with per-broker stop-loss, live prices, XIRR, and Index Beat. Local-first architecture, optional cloud backup.
No credit card required · No registration · 100% Free Forever