🌟 Finmagine Portfolio Manager — Now on the Chrome Web Store
Multi-broker tracker: Indian & global stocks, MFs, ETFs • Decision Journal, History Chart, Corporate Actions • Free
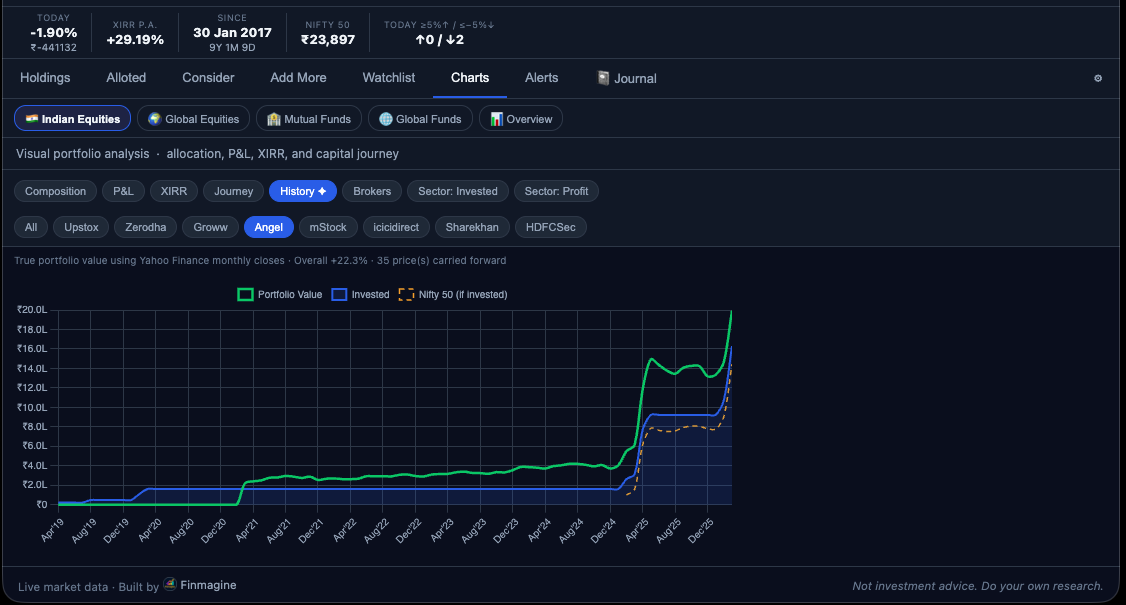
True portfolio value month-by-month vs a DCA benchmark in the same index. Finally see how your stock picking actually compares to just buying an index every month.
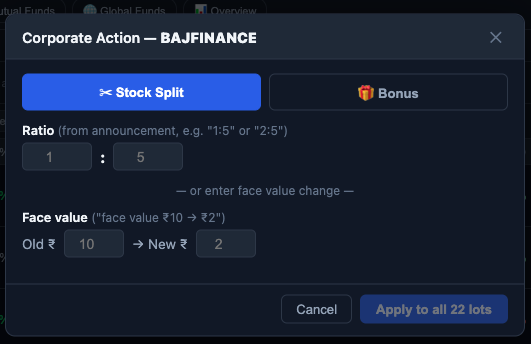
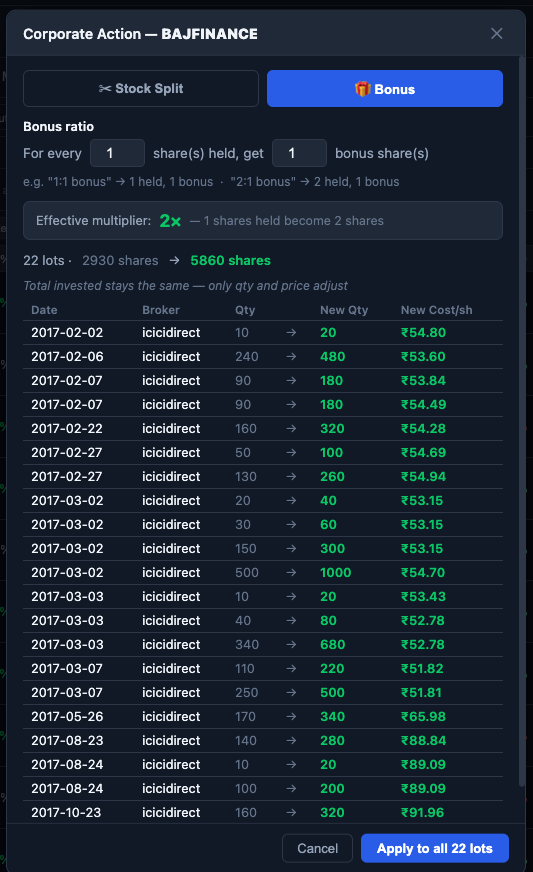
Stock Split and Bonus Issue adjustment in one click. All lot quantities and cost prices update automatically across every broker, every trade date.
Toggle between the default dark green terminal and a clean light theme. All charts, tables, and signal badges adapt instantly. Your preference is saved and synced.
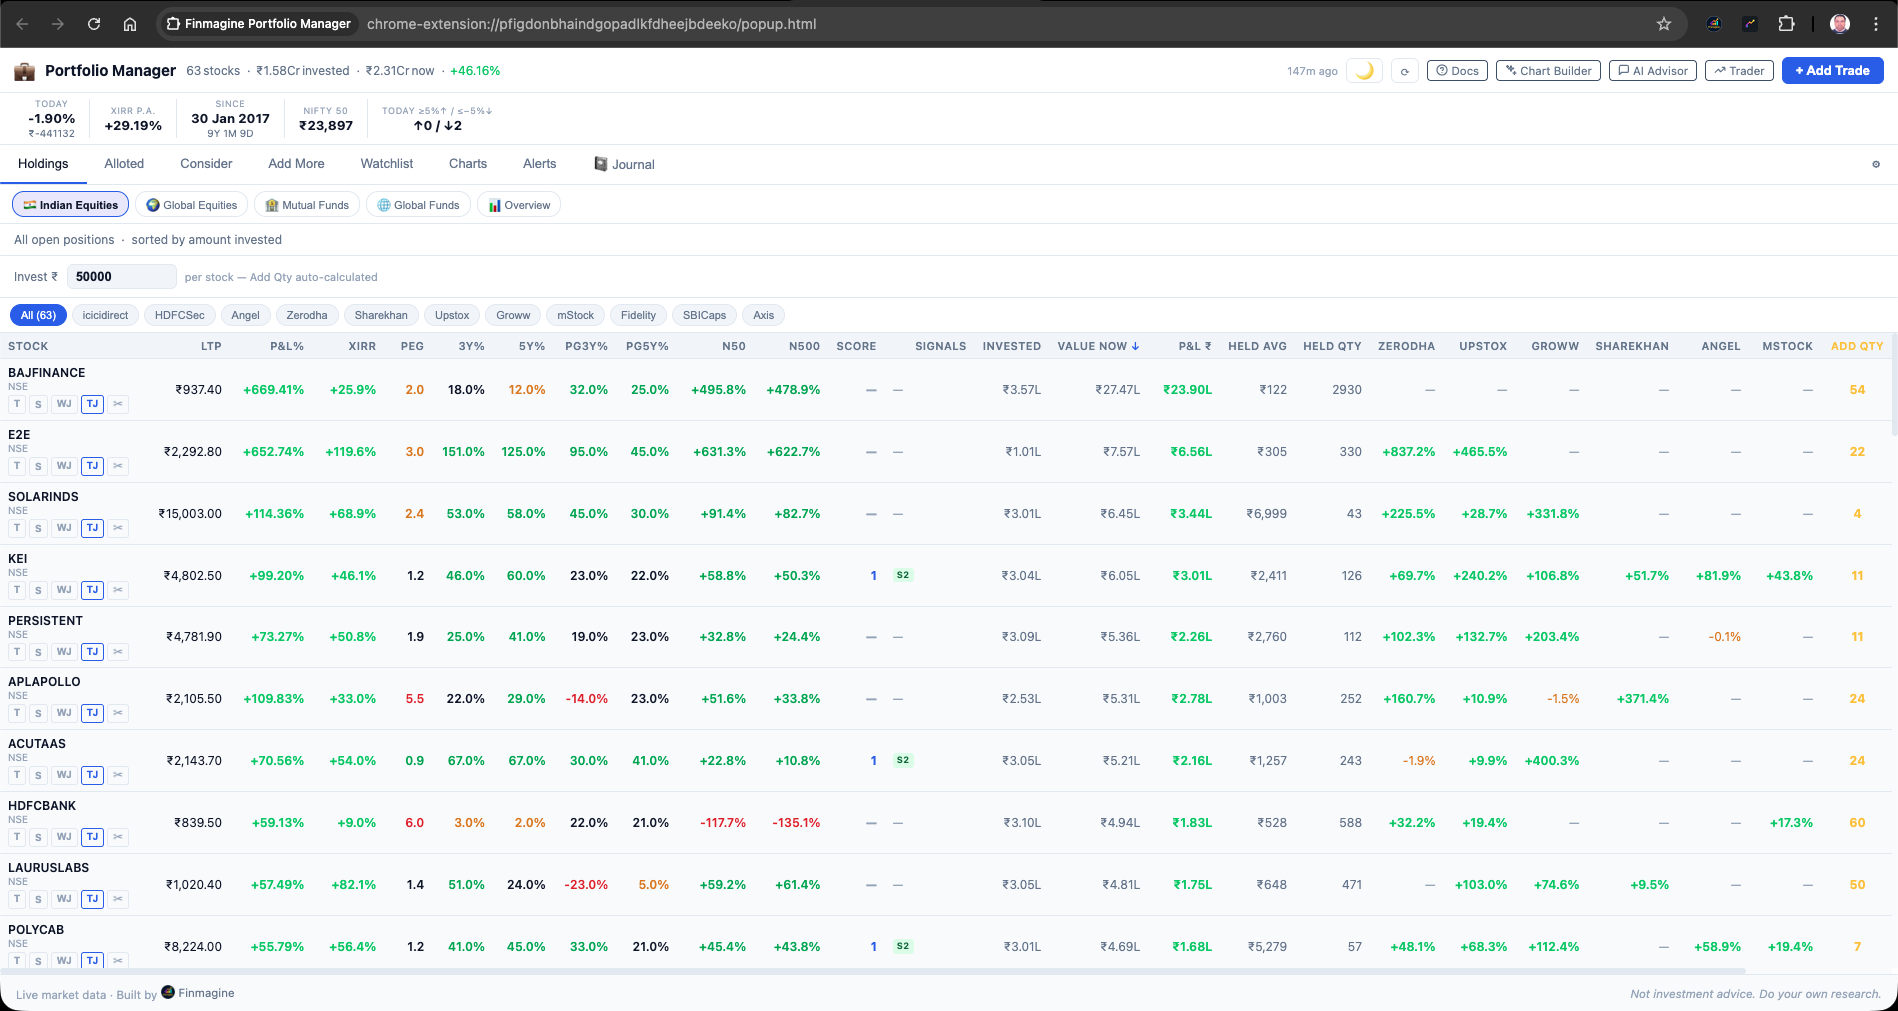
Two new Holdings columns: PG3Y% and PG5Y% — net profit CAGR over 3 and 5 years. Compare price CAGR with earnings growth to identify stocks where price has outrun fundamentals.
Table of Contents
What’s in v1.1.0 — Quick Overview
v1.1.0 is the largest update since the initial launch. It introduces four major new capabilities and a set of targeted quality-of-life improvements across the Watchlist, Holdings, and Charts tabs.
History Chart
New chart type in the Charts tab. Shows the actual ₹ value of your portfolio every month using Yahoo Finance monthly closes, compared to a DCA benchmark (Nifty 50 or S&P 500) with the same cash invested.
Corporate Actions
Stock Split and Bonus Issue modal accessible from Holdings rows and the stock detail modal. Enter the ratio and every trade for that stock updates automatically: quantity multiplied, cost price divided.
Dark / Light Theme
☀️/🌙 toggle button in the extension header. Switches between the dark green terminal theme and a clean white light theme. All charts re-render with theme-appropriate colours.
PG3Y% & PG5Y%
Two new columns in the IN_EQ Holdings table: net profit CAGR over 3 years and 5 years (from Screener.in). Use with price CAGR to spot where earnings growth has lagged price appreciation.
Watchlist MCap Chips
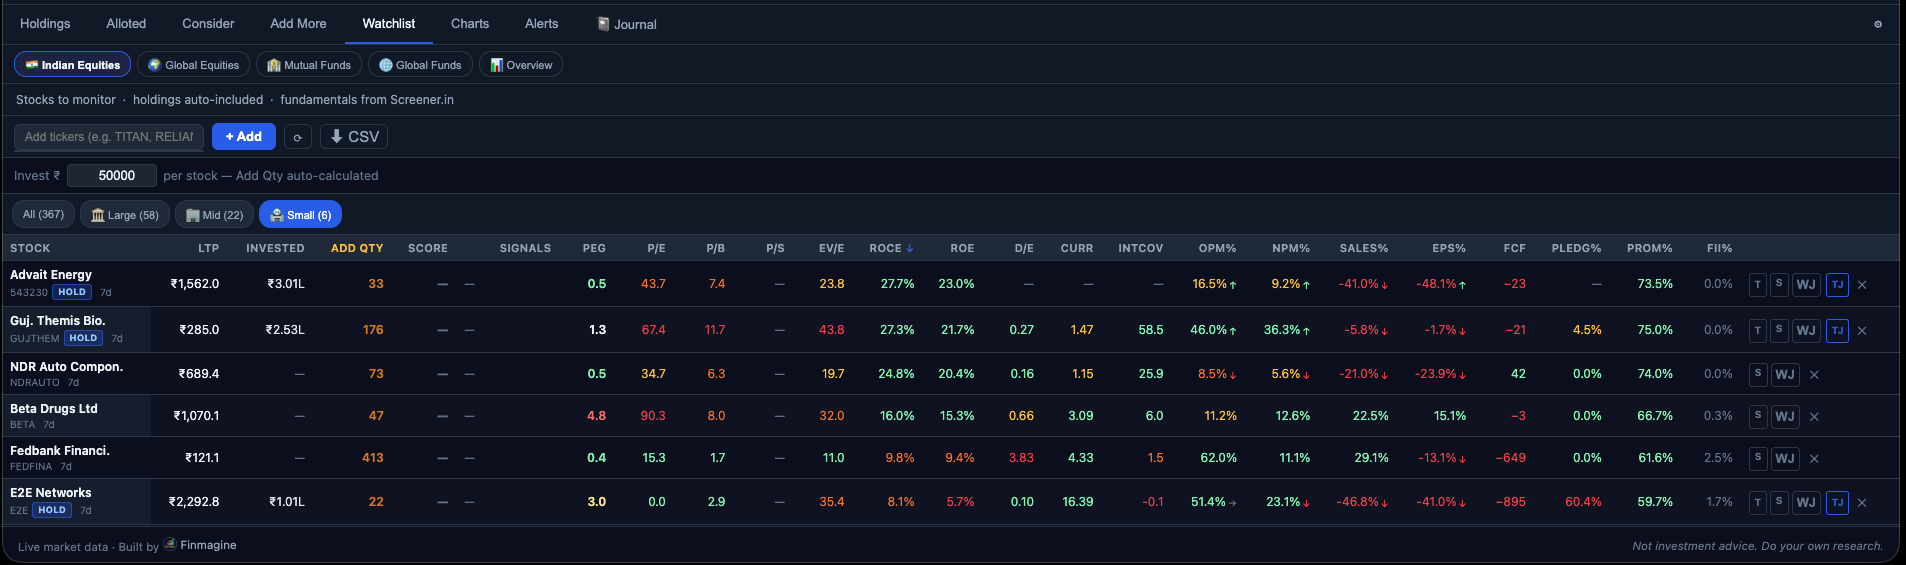
Large / Mid / Small filter chips (SEBI thresholds) above the Watchlist table. Instantly segment your watchlist by market cap category without manual sorting.
Watchlist Sort Persistence
Your Watchlist sort column and direction are saved and restored on every open. Default is Score desc. Changes auto-sync via cloud if cloud sync is enabled.
History ✦ Chart: True Portfolio Value Over Time
Charts Tab • IN_EQ & GL_EQThe History chart answers a question the Journey chart cannot: not just how much capital I deployed, but what was my portfolio actually worth at each point in time? The Journey chart shows cumulative invested ₹ vs current value. The History chart computes the actual market value of every holding at every month using real Yahoo Finance monthly closing prices.
✦ History Chart — Portfolio Value vs DCA Benchmark
Three lines on an area chart: your actual portfolio value (monthly closes × qty held at that time), a DCA benchmark showing what the same cash invested in Nifty 50 every month would be worth, and your cumulative invested capital as a floor reference.
How It Works
When you open the History chart for the first time, the extension fetches monthly closing prices for every Indian equity in your portfolio via Yahoo Finance, going back to the month of your first trade. It then reconstructs your portfolio value month-by-month:
- For each calendar month, it calculates qty held × monthly close price for every holding you owned that month
- Stocks you had not yet bought do not contribute; stocks you have since sold contribute for the months you held them
- The result is a historically accurate picture of your portfolio value at each point in time — not estimated, but computed from real closing prices
Indian vs Global Portfolios
| Asset Class | DCA Benchmark | Index Used |
|---|---|---|
| IN_EQ (Indian Equities) | Nifty 50 | Yahoo Finance: ^NSEI |
| GL_EQ (Global Equities) | S&P 500 | Yahoo Finance: ^GSPC |
For GL_EQ, USD values are converted to ₹ at your configured FX rate before comparison. The benchmark is also computed in ₹ terms for a like-for-like comparison.
Performance Details
- Cached for 6 hours — Historical price data is cached to avoid repeated fetches. Refreshing within 6 hours serves the cached data instantly.
- Loading spinner — First open shows a spinner while fetching. Subsequent opens within 6 hours are instant.
- 250ms per-stock throttle — Requests are spaced to avoid Yahoo Finance rate limits for large portfolios.
Corporate Action Modal: Stock Splits and Bonus Issues
Holdings Rows • Stock Detail ModalWhen a company announces a stock split or bonus issue, every trade record in your portfolio needs adjustment: quantities multiply, cost prices divide. The Corporate Action modal handles this in one operation — enter the ratio, preview the changes, apply.
How to Open the Corporate Action Modal
Two entry points:
- Holdings row — The ✂ (scissors) button on any Indian or Global equity row in the Holdings table. Click it to open the modal for that stock.
- Stock detail modal header — When viewing a stock’s full trade history in the detail modal, a ✂ Split / Bonus button appears in the header. Click it to open the corporate action modal for that stock.
Stock Split
Two input formats are supported for splits:
- Ratio format: Enter
M:N— e.g.,1:5means 1 share becomes 5 (5× more shares, price ÷ 5). Or2:5means 2 shares become 5 (2.5× multiplier). - Face value change: Enter the old face value and new face value — e.g., FV ₹10 → ₹2 (same as 1:5 split, 5× multiplier). Use this if you have the face value information from the company announcement.
The multiplier = N/M (for ratio) or old_FV/new_FV (for face value change). For each trade: new_qty = floor(old_qty × multiplier), new_cost_per_share = old_cost / multiplier.
Bonus Issue
Enter the bonus ratio as “For every X shares held, get Y bonus shares.” For example, a 1:1 bonus (1 bonus share for every 1 held) means you end up with 2 shares for every 1 you had — a 2× multiplier. A 1:2 bonus (1 for every 2 held) is 1.5×.
Multiplier = (X + Y) / X. For each trade: new_qty = floor(old_qty × multiplier), new_cost = old_cost / multiplier.
Live Preview Table
Before applying, the modal shows a preview table of every lot with the adjusted quantities and costs:
TITAN — Stock Split 1:5 Preview
What Gets Updated
Applying a corporate action updates every trade for that ticker, across all brokers:
- qty — floor(qty × multiplier)
- buyPrice — buyPrice ÷ multiplier (cost per share normalised)
- netCostPerShare — netCostPerShare ÷ multiplier (includes brokerage adjustment)
Total invested ₹ (cost × quantity) is preserved. The net cost per share drops proportionally as quantity increases — which is correct: a split does not change your total investment.
Dark & Light Theme Toggle
Extension Header • ☀ / 🌙Click the ☀️ / 🌙 button in the extension header (next to the ⟳ Refresh button) to switch between themes. The transition is instant — no reload required.
🌙 Dark Theme (Default)
- Dark green terminal background
- Green positive P&L, red negative
- High contrast for data-dense tables
- Preferred for market-hours monitoring
☀ Light Theme
- Clean white background
- Easier on eyes in bright environments
- Chart.js colours adapt to white background
- Signal badges and score colours adjust
Chart.js reads CSS variables at render time via getComputedStyle, so every chart (Composition, P&L, XIRR, Journey, History, Sector, etc.) automatically renders with theme-appropriate grid lines, tooltip colours, and legend text when you toggle. No manual chart refresh required.
settings.theme and restored on the next open. If cloud sync is enabled, your theme preference syncs across devices automatically.
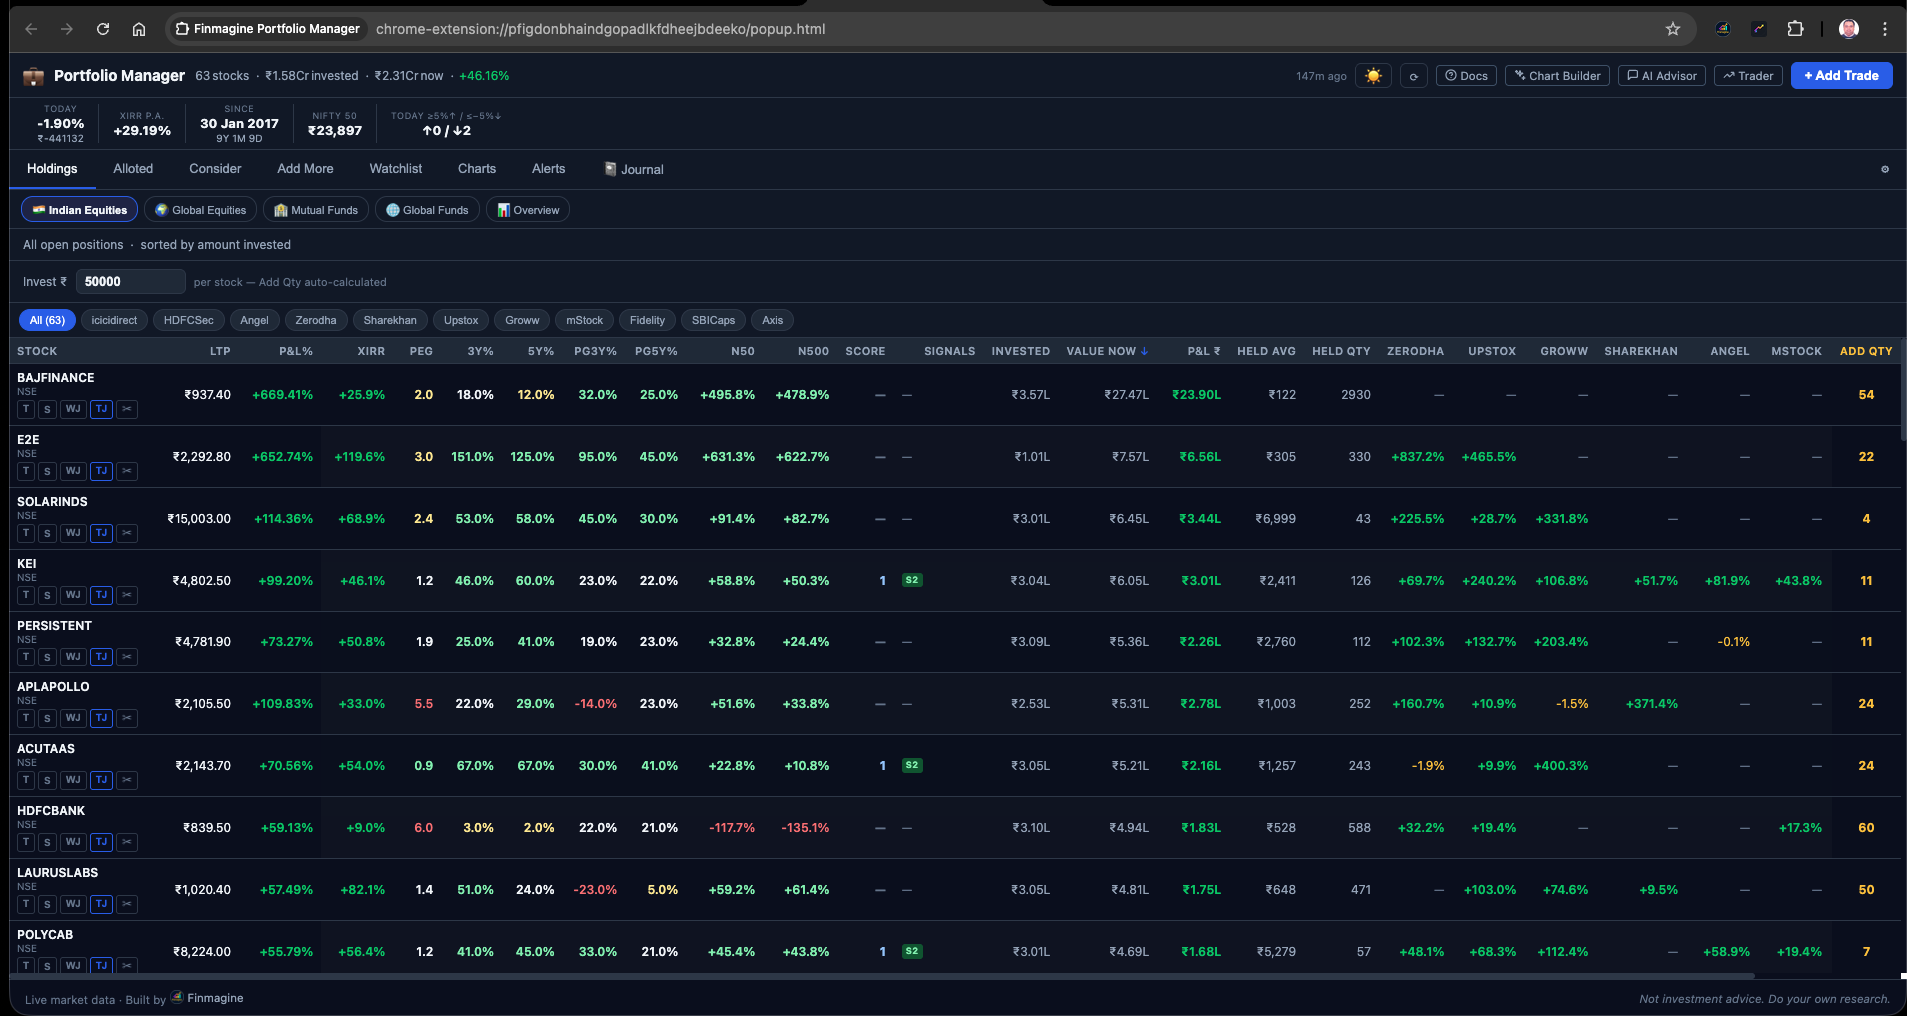
Profit Growth CAGR Columns (PG3Y% / PG5Y%)
Holdings Tab • IN_EQTwo new columns in the Indian Equity Holdings table: PG3Y% (net profit CAGR over 3 years) and PG5Y% (net profit CAGR over 5 years). These values are fetched from Screener.in and cached alongside other fundamental data.
Why Profit Growth CAGR?
Price CAGR (already visible as the 3Y% and 5Y% columns) tells you how fast the stock price has grown. Profit Growth CAGR tells you how fast the underlying earnings have grown. The gap between the two is the valuation expansion or contraction component of your return.
| Scenario | Price 5Y CAGR | PG5Y% | What It Means |
|---|---|---|---|
| Price ≈ Earnings | 18% | 17% | Healthy: most of the return comes from earnings growth, not valuation re-rating |
| Price >> Earnings | 28% | 12% | Caution: 16pp of return came from P/E expansion. Future returns may compress if P/E reverts |
| Earnings >> Price | 10% | 22% | Potentially undervalued: earnings have outgrown price. Possible P/E re-rating ahead if market recognises |
| Low earnings growth | 15% | 4% | Stock price has risen mainly on hope/sentiment, not fundamental delivery. High risk if sentiment shifts |
Both columns are colour-coded: high profit growth (> 15%) appears green; moderate (5–15%) appears amber; low or negative (< 5%) appears red. A dash (—) appears if Screener.in data is not yet loaded for that stock.
Watchlist Upgrades
Several quality-of-life improvements were made to the Watchlist tab in v1.1.0:
Market Cap Filter Chips
Watchlist TabThree chips above the Watchlist table let you instantly filter by market cap category using SEBI’s standard thresholds:
| Chip | SEBI Definition | Market Cap |
|---|---|---|
| 🏛 Large | Top 100 by MCap | ≥ ₹20,000 Cr |
| 🏚 Mid | 101st–250th by MCap | ₹5,000 Cr – ₹20,000 Cr |
| 🏪 Small | 251st and below | < ₹5,000 Cr |
Clicking a chip filters the Watchlist to only show stocks in that MCap category. Click the same chip again (or click “All”) to clear. Market cap values are sourced from Screener.in fundamentals (the same fundamentals[sym].marketCapCr used in Holdings calculations).
Sort Persistence
Previously, the Watchlist sort order reset to Score descending every time you closed and reopened the extension. Now your sort column and direction are saved in settings.watchlistSortCol and settings.watchlistSortDir and restored on every open. Default remains Score desc if no sort has been applied.
When cloud sync is enabled, your Watchlist sort preference syncs with your settings — so if you sort by P/E ascending on your laptop, the same sort is active when you open the extension on another device.
Add Qty for Watchlist
The Watchlist tab now includes the same “invest ₹ → calculate Add Qty” bar that Holdings has. Enter an investment amount in the invest bar above the Watchlist table, and each row shows how many shares you would get at the current price with that amount.
- Indian equities: Add Qty shown as whole shares (
Math.ceil) - Global equities and funds: Add Qty shown with 3 decimal places for fractional share support
This lets you quickly size a potential new position: “if I invest ₹50,000, what is my exposure in each of these watchlist candidates?”
Watchlist Journal Notes (WJ Button)
The WJ (Watchlist Journal) button on each watchlist row was also introduced in v1.1.0. See Article 7 (The Decision Journal) for the full guide on Watchlist Journal intent categories and the pre-trade note workflow.
Cloud Sync
Settings • ☁ SyncCloud sync was deployed as part of the v1.1.0 release. When enabled in Settings, your entire portfolio — all trades, all watchlist entries, all settings and preferences — is backed up to your Finmagine account as a single encrypted JSON blob.
☁ What Cloud Sync Backs Up
- All trades — every buy record across all 4 asset classes and all brokers, including Decision Journal notes
- Watchlist — all watchlist entries, WJ notes, and watchlist sort preference
- Settings — theme, FX rate, brokerage charges template, PEG denominator choice, Display column preferences
- Alert thresholds — per-stock stop-loss levels configured in the Alerts tab
Sync is available to logged-in users at finmagine.com. Each sync operation pushes the complete portfolio state — the server stores only the latest version (no version history is retained on the server side; your local chrome.storage.local is the authoritative copy).
📚 Finmagine Portfolio Manager — Article Series (8 articles)
Finmagine Portfolio Manager
Per-broker stop-loss discipline, live prices, XIRR, Index Beat, Charts — for Indian Equities, US Stocks, Mutual Funds & Global ETFs. Local-first portfolio tracking, optional cloud backup.
Learn More about Portfolio Manager →