🌟 Finmagine Portfolio Manager — Now on the Chrome Web Store
Multi-broker tracker: Indian & global stocks, MFs, ETFs • Decision Journal, History Chart, Corporate Actions • Free
- Why trade journaling improves returns
- The 7 thesis categories and when each applies
- How auto-prefill works from your data
- Pattern Analysis: your behavioral win rates
- The Watchlist Journal for pre-trade intent
- Free-text thesis textarea in trade drawer
- 7 one-tap category chips for fast tagging
- Auto-prefill from portfolio signals
- Journal tab: all noted trades newest-first
- Pattern Analysis with avg P&L% by category
- Which reasoning styles earn more for you
- Whether you over-trade on tips vs research
- Your pattern: buying quality vs momentum
- Win rate: % of journal notes with positive P&L
- Watchlist intent tracking before buying
Table of Contents
- The Problem: “I Don’t Remember Why I Bought This”
- The Trade Note: Capturing Thesis at Decision Time
- The 7 Thesis Categories
- Auto-Prefill: How the Extension Reads Your Portfolio
- The Journal Tab: Your Trade History with P&L Context
- Pattern Analysis: Which Reasoning Styles Actually Work for You
- The Watchlist Journal: Intent Before the Trade
- How to Use the Decision Journal Effectively
The Problem: “I Don’t Remember Why I Bought This”
Six months after a trade, a stock is either up 35% or down 22%. You open your portfolio to decide whether to hold, add, or exit. And you realise you can’t quite remember why you bought it. Was it because ROCE was excellent? Because someone in a WhatsApp group mentioned it? Because you spotted a VCP pattern breaking out? Because management guided for strong guidance on the last concall?
This is one of the most common and damaging gaps in retail investing: the missing decision record. Without knowing the original thesis, you cannot evaluate whether the thesis is intact. You end up making the hold/sell decision based on current price action alone — cutting winners early because they look too high, holding losers because you “believe in the story” even though the original thesis has changed.
The Decision Journal in Finmagine Portfolio Manager solves this with a simple intervention: a single text box at trade time, before you press Save. Write one sentence. That sentence — captured when you are thinking clearly about the investment — becomes the benchmark against which you evaluate the position six months later.
The Trade Note: Capturing Thesis at Decision Time
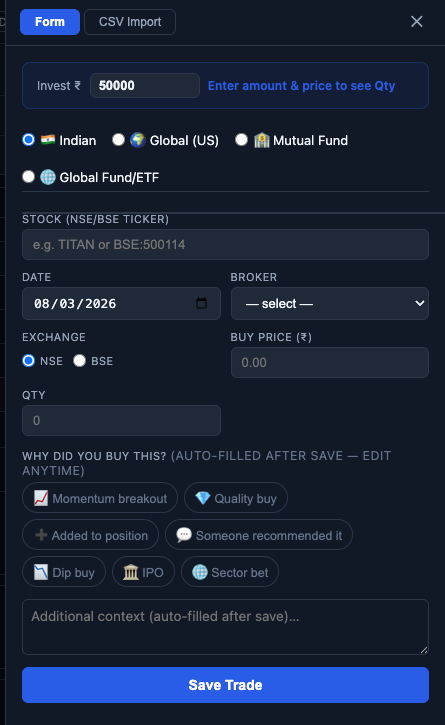
Trade DrawerEvery time you add a trade using the drawer (the slide-in panel from the Add tab), a “Why are you buying this?” text area appears below the brokerage charges section. It is optional — you can leave it empty — but when you do fill it in, the note travels with the trade permanently.
The note is a free-text field: there are no required formats, no minimum length, no validation. One sentence is enough. You can write:
- “Stage 2 breakout past 52W high with 3x volume on results day. ROCE >25%, debt-free.”
- “Averaging down — original thesis of power capex cycle intact, management held guidance.”
- “Recommended by X on ValuePickr — need to do own DD before adding more.”
- “Rotating from IT (slowing) into Pharma (US generic opportunity window).”
Where the Note Appears
Once saved, your note appears in two places:
- Stock Detail Modal — Click any holding row to open the detail modal. Below each trade row, your note appears in italics. If you added the trade without a note, a small “+ Add note” link appears instead — clicking it opens the edit drawer with the note field.
- Journal Tab — All trades with notes, sorted newest first, with current P&L% shown alongside the note. See Section 5 for the full Journal tab walkthrough.
Editing a Note
Click the ✎ edit button in the stock detail modal (or the “+ Add note” link for missing notes) to open the edit drawer. The note field is pre-filled with the existing text. Edit and save — the updated note is stored with the trade.
The 7 Thesis Categories
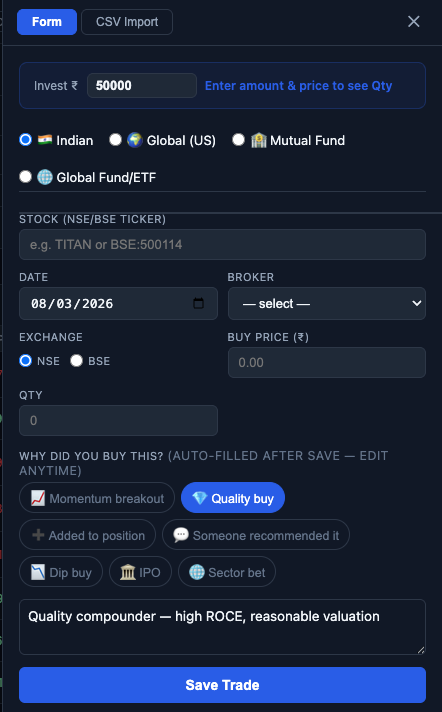
Trade Drawer • One-Tap ChipsBelow the note textarea, seven category chips provide one-tap thesis classification. Tapping a chip tags your trade with a category that feeds into Pattern Analysis later. Categories are not mutually exclusive — you might tag a trade as both a quality buy and a momentum breakout if both apply.
| Category Chip | When to Use | What It Tags |
|---|---|---|
| 📈 Momentum breakout | Trade triggered by a breakout setup — VCP, Stage 2, 52W high proximity | ChartInk signal-driven entry, high-volume breakout, trend-following |
| 💎 Quality buy | Fundamental-driven buy: high ROCE, consistent growth, low debt | Quality compounder entry, business-first long-term allocation |
| ➕ Added to position | Second or later purchase of a stock you already hold | Averaging down, adding on strength, re-entry after exit |
| 💬 Someone recommended it | Tip, forum post, newsletter, concall mention, influencer pick | External recommendation that triggered research or buy |
| 📉 Dip buy | Buying a stock you already track on a pullback to a support level | Planned pullback entry, 200 DMA support, oversold bounce |
| 🏛 IPO | IPO or recently-listed stock purchased at listing or shortly after | New issue allocation, grey market premium play, early-stage listing |
| 🌐 Sector bet | Buying primarily for sector tailwind exposure, not a single-stock thesis | Capex cycle play, policy-driven sector rotation, thematic allocation |
Auto-Prefill: How the Extension Reads Your Portfolio
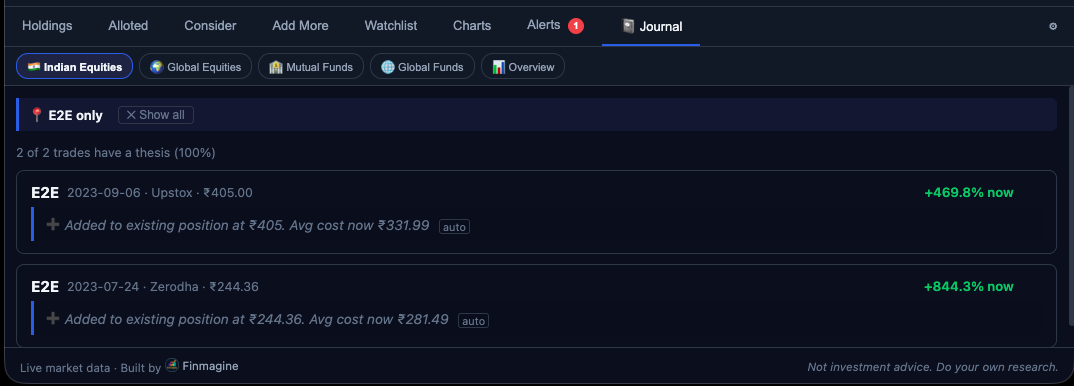
Smart FeatureAfter every trade save or CSV import, the generateThesis() rule engine automatically writes a thesis note for trades that have none. The note appears in the Journal tab with an [auto] badge — so you can see at a glance which entries were system-generated vs manually written. The auto-generated text is fully editable at any time.
What You Will See Most Often: “Added to existing position”
For most active portfolios, the most common auto-prefill is ➕ Added to position. The rule is simple: if the ticker already exists anywhere in your holdings, every subsequent buy is tagged as an add-on. The note includes the exact buy price and the new weighted average cost:
➕ Added to existing position at ₹1,111.78. Avg cost now ₹1,106.62 auto
This is especially useful after CSV imports: if you import 3 years of trade history, every add-on buy is automatically categorised without you touching a single entry.
![Finmagine Portfolio Manager Journal tab showing auto-prefilled thesis entries with [auto] badge — Added to existing position notes generated automatically after trade save](assets/images/decisionjournal/AutoPrefill.png)
Signal-Based Auto-Prefill: First-Time Buys Only
For a stock you are buying for the first time (not yet in your holdings), the rule engine checks ChartInk signals loaded for that ticker. These rules only fire when the “already held” check does not match:
| Condition | Auto-Tagged As |
|---|---|
| Stock carries VCP, S2 (Stage 2), or NH (Near High) signal | 📈 Momentum breakout |
| Stock has NH signal and ROCE > 15% from fundamentals | 💎 Quality buy |
| No signals match | No auto-selection — choose your own |
In practice, stocks that have strong signals (S2+NH+VCP) and are being bought for the first time are the clearest momentum entries — the auto-tag reflects that. But if you are buying on a different rationale, change the chip before saving.
Backfill on Startup
When the extension opens, backfillTheses() runs on all existing trades that have no note. All “adding to existing” trades across your full history get categorised automatically. Only trades that need subjective judgment (dip buys, sector bets, tips) are left blank for you to fill in.
The Journal Tab: Your Trade History with P&L Context
📝 JournalThe Journal tab (the eighth tab in the extension) shows all trades that have a note, sorted newest-first. Each entry shows the stock, trade date, buy price, broker, current P&L% at live prices, and your original note in a blockquote.
💎 Quality buy — Consistent ROCE >25%, wiring industry tailwind from real estate and infra capex. Stage 2 structure intact. Adding on dip to 200 DMA support.
💬 Someone Recommended It — Mentioned on X by an analyst I follow. Quick-food delivery margin expansion thesis. Need to do more DD on unit economics.
📈 Momentum breakout — 3-month base forming after correction from all-time high. Breaking out above ₹1,400 pivot on 2.5x volume. Capital markets structural tailwind.
The Journal tab makes a simple but powerful thing possible: you can scroll through your past decisions and see, for each one, whether the outcome matched the thesis quality.
What to Look For in Your Journal
- Notes where the thesis changed but you held anyway — If you wrote “management guided 25% growth” and management subsequently cut guidance, the note is your reminder that the original thesis is gone. The P&L% next to it should inform whether you should still hold.
- Notes that say “need to do more DD” — These are positions you entered speculatively. Check: did you actually do the DD? Does the position size match the thesis quality?
- Pattern: tip-based entries vs research-based — Compare your notes. Which cluster tends to be green? This is the question the Pattern Analysis tab answers quantitatively (see Section 6).
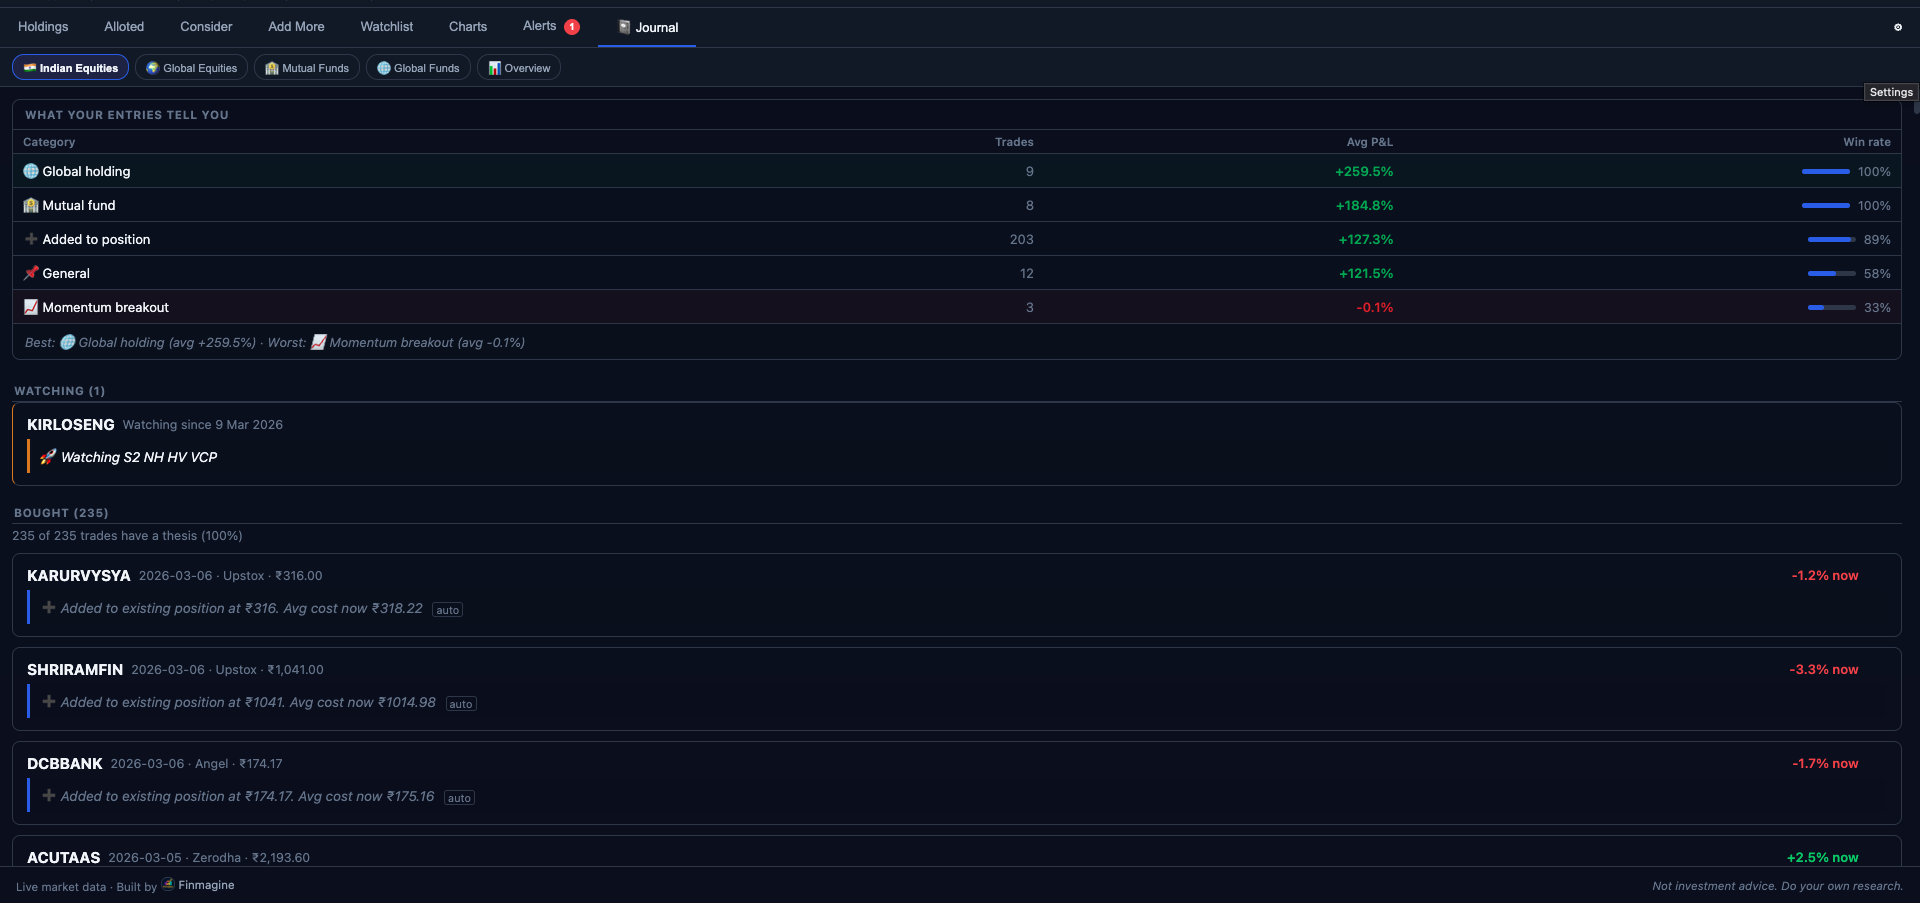
Pattern Analysis: Which Reasoning Styles Actually Work for You
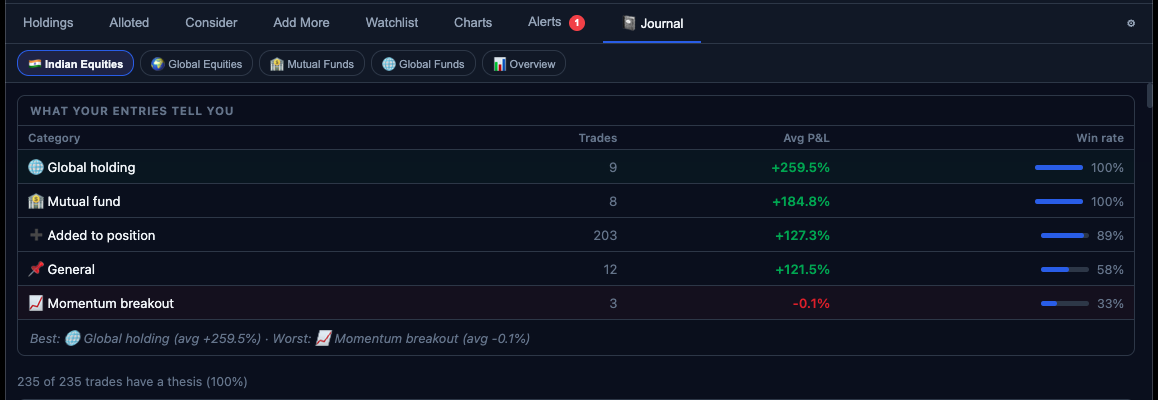
📊 Behavioural InsightsBelow the journal entries, the Journal tab shows a Pattern Analysis section. This section groups all your noted trades by thesis category and computes three numbers for each group:
- Count — How many trades you have tagged with this category
- Avg P&L% — Average current P&L% across all positions in the category (at live prices)
- Win Rate — % of trades in this category that are currently in profit
| Thesis Category | Trades | Avg P&L% | Win Rate |
|---|---|---|---|
| 💎 Quality buy | 8 | +24.3% | 87% |
| 📈 Momentum breakout | 12 | +14.7% | 75% |
| ➕ Added to position | 6 | +9.1% | 67% |
| 📉 Dip buy | 5 | −2.3% | 40% |
| 💬 Someone recommended it | 9 | −5.8% | 33% |
In this illustrative example, the pattern is clear: quality-driven and momentum-driven decisions have strong outcomes. Trades entered on external recommendations have a 33% win rate and negative average P&L. Dip buys — entering pullbacks without a clear thesis on whether the original setup is intact — are breaking even. These are not conclusions about how these strategies work in general — they are conclusions about how this investor’s execution of these strategies has worked.
Using Pattern Analysis to Improve Decisions
Once you have 20–30 noted trades, the Pattern Analysis becomes actionable:
- Double down on high-win-rate categories — If quality fundamental analysis produces 80%+ win rates for you, allocate more capital to that process. If momentum breakout entries are 60%, continue but perhaps with tighter position sizing.
- Cap allocation to low-win-rate categories — If tips have a 30% win rate, the data is telling you that your current process for evaluating tips is not working. Either improve the process (more DD before acting) or hard-cap tip-based allocation to a small “lottery ticket” budget.
- Revisit the definition of your categories — If “Dip buy” has low win rates, is it because dips extend further than expected, or because you are entering without confirming the original thesis is still intact? The Journal notes themselves will tell you — review the notes of failed trades in that category to find the pattern within the pattern.
The Watchlist Journal: Intent Before the Trade
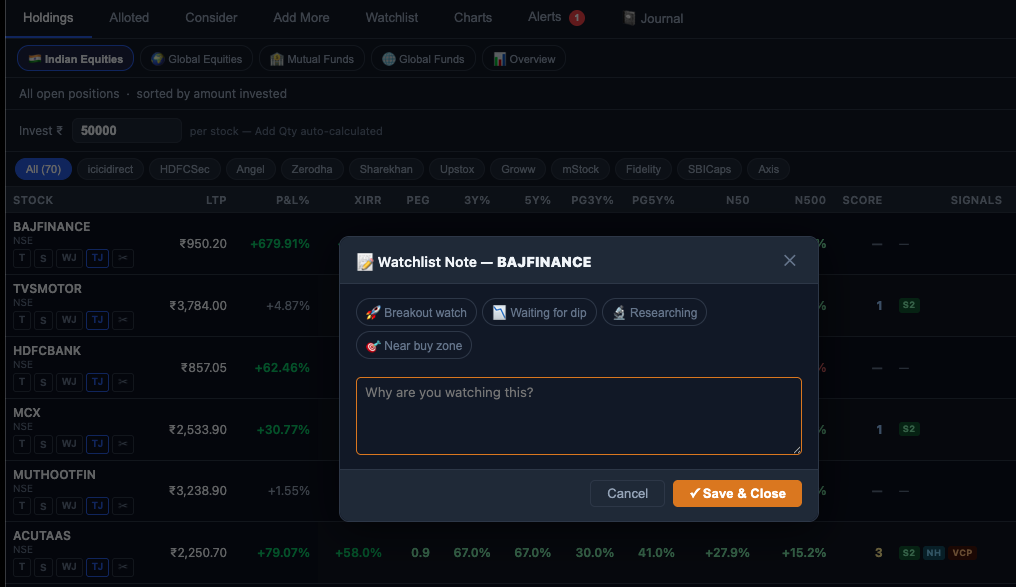
Watchlist Tab • WJ ButtonThe Watchlist tab has its own parallel journaling feature: the Watchlist Journal. Each stock on your watchlist can have a short intent note explaining why it is on the watchlist — what you are waiting for before buying.
Click the WJ button on any watchlist row to open a note panel for that stock. There are four one-tap intent categories:
| Intent | Meaning | Example Use |
|---|---|---|
| 🚀 Breakout Watch | Waiting for a specific price trigger or breakout | “Watching for VCP base completion above ₹2,400 on 2x vol” |
| 📅 Buy the Dip | Want the stock but waiting for a pullback | “HDFC Bank. Buying if it dips to 200 DMA support near ₹1,750” |
| 🔎 Research in Progress | Still doing fundamental analysis before deciding | “PI Industries. Reading concalls. Need to understand custom synthesis order book.” |
| 💰 Buy Zone Reached | All conditions met — ready to buy when cash is available | “Confirmed high ROCE, Stage 2, near high. Buy on next dip.” |
Below the intent chips, a free-text area lets you write the specifics: the price level you are watching, the trigger event, the question you are trying to answer before buying.
The “Watching” Section in the Journal Tab
The Journal tab also shows a Watching section below the trade entries. This lists all watchlist stocks with notes — stocks you are monitoring but have not yet bought. It gives you a single place to review:
- Stocks you intended to buy at a dip — have they dipped? Is the opportunity still valid?
- Stocks where research was in progress — did you complete the analysis?
- Breakout watches — has the trigger fired? If you missed it, should you still enter at higher prices?
How to Use the Decision Journal Effectively
The Minimum Effective Dose
You do not need to write an essay for every trade. The minimum effective dose is one sentence that captures:
- The core reason (quality, momentum, tip, averaging)
- One specific fact (ROCE%, a price level, a volume observation, a management statement)
- The thesis risk (what would prove you wrong)
Example: “Momentum breakout — SMA 50 > SMA 200, 52W high breakout on 3x vol. Thesis fails if price closes below SMA 50 on weekly basis.”
The Weekly Journal Review
Once a week (5 minutes is enough), open the Journal tab and scan:
- Red P&L% entries — Is the original thesis still intact? If yes, hold. If no, the note tells you the exit criteria.
- Pattern Analysis changes — Has your win rate on a category shifted? Any category dropping below 40% win rate deserves attention.
- Watchlist watching section — Have any trigger conditions fired? Do any “buy zone reached” stocks need action?
The Annual Audit
Once a year, read through your journal entries for closed positions (stocks you have fully exited). The question is not “was I right?” but “was my process right?”:
- Did you exit for the right reasons (thesis change, better opportunity) or wrong reasons (panic, short-term noise)?
- Were your stated exit criteria (from the note) actually the criteria you used when selling?
- What would you write differently in the thesis note, knowing what you know now?
🌟 The Compounding Effect of Trade Records
- Year 1: Notes feel like extra work — you are building the habit
- Year 2: Pattern Analysis starts showing statistically meaningful signals — you start seeing which thesis types consistently work for you
- Year 3+: Your Journal is a personalised investment playbook — written by you, validated by your own real-money outcomes, not generic advice
📚 Finmagine Portfolio Manager — Article Series (8 articles)
Finmagine Portfolio Manager
Per-broker stop-loss discipline, live prices, XIRR, Index Beat, Charts — for Indian Equities, US Stocks, Mutual Funds & Global ETFs. Local-first portfolio tracking, optional cloud backup.
Learn More about Portfolio Manager →