🌟 Finmagine Portfolio Manager — Now on the Chrome Web Store
Multi-broker tracker: Indian & global stocks, MFs, ETFs • Decision Journal, History Chart, Corporate Actions • Free
🎙 Multimedia Learning Hub
Learning overview and 30 interactive flashcards covering every aspect of backtesting your rebalancing strategy
What You Will Learn
The Backtest tab in Finmagine Portfolio Manager answers the question that matters most: given your actual portfolio, your actual buy prices, and your actual Indian tax situation — would disciplined rebalancing have created more wealth than simply holding everything unchanged?
Core Concepts Covered:
- Buy & Hold baseline
- Threshold Rebal (Gross & Net)
- Calendar Rebal (Net)
- LTCG at 13% + ₹1.25L exemption
- STCG at 20.8%
- FY-by-FY tax breakdown
- FIFO vs HIFO explained
- When each method wins
- Tax drag quantified
- NAV chart interpretation
- Summary cards explained
- Rebalancing events log
🎥 Video Guide — Coming Soon
A video walkthrough of the Backtest tab — setting up your first simulation, reading the NAV chart, and interpreting the tax breakdown — is in production. Check back soon.
Visit Portfolio Manager Hub🎧 Audio Deep Dive — Coming Soon
An audio deep dive covering rebalancing theory, Indian tax implications, FIFO/HIFO decision-making, and the full backtest workflow is being produced. Subscribe to the Finmagine WhatsApp community to be notified when it drops.
Join WhatsApp CommunityTest Your Knowledge — 30 Flashcards
This article includes 30 Q&A flashcards covering every key concept — from the four scenario definitions to FIFO/HIFO decision-making to interpreting the NAV chart. Jump to the flashcard section below.
Table of Contents
- 1. The Question Every Investor Asks
- 2. What Is Rebalancing?
- 3. The Four Scenarios Explained
- 4. Setting Up Your First Backtest
- 5. Reading the NAV Chart
- 6. Understanding the Summary Cards
- 7. The Tax Year Breakdown Table
- 8. The Rebalancing Events Log
- 9. FIFO vs HIFO — Which Should You Choose?
- 10. Practical Interpretation Guide
- 11. What Backtest Cannot Tell You
- 12. Flashcards (30 Q&A)
1. The Question Every Investor Asks
You have been holding your portfolio for several years. Some positions have grown dramatically — Titan now makes up 22% of your portfolio when you originally allocated 12%. SBI Life has barely moved and sits at 4% when you wanted 8%. Every time you open a finance blog or watch a YouTube video about portfolio management, the advice is the same: "rebalance regularly." But nobody answers the question that actually matters:
Generic rebalancing calculators answer a hypothetical question with hypothetical numbers. They take a theoretical 60/40 portfolio, apply historical index returns, and show you that rebalancing beats hold. But your portfolio is not a theoretical construct. It has specific stocks, specific lot sizes, specific purchase dates, specific cost bases. And critically — it has a tax situation that is entirely unique to you.
The Finmagine Portfolio Manager Backtest tab answers the real question. It reads your actual trades from the Holdings tab, fetches historical monthly closing prices from Yahoo Finance for every stock in your portfolio, simulates four distinct strategies from the start date of your choice, applies Indian capital gains tax (LTCG at 13% including cess, STCG at 20.8% including cess) to every single rebalancing transaction using your chosen lot selection method, and plots how ₹1,000 invested at the start would have grown under each strategy.
No spreadsheet gymnastics. No theoretical assumptions about which stocks you held. The backtest runs on the positions you actually own, using the prices you actually paid, under the tax laws that actually apply to you.
This guide walks through every element of the Backtest tab — the configuration panel, the four scenario lines, the summary cards, the tax year breakdown table, and the rebalancing events log. By the end, you will know not just how to read the backtest output but how to act on it.
2. What Is Rebalancing?
Rebalancing is the act of returning your portfolio to a set of predetermined target weights after market movements have caused it to drift. The underlying logic is straightforward: if you decided that Reliance Industries should constitute 15% of your portfolio based on your conviction, business analysis, and risk tolerance, then after a year of strong Reliance performance that has pushed it to 24%, you are now carrying almost double the Reliance exposure you originally wanted. Rebalancing corrects that drift.
The Mechanics
Consider a simple three-stock portfolio at inception:
| Stock | Target Weight | Initial Value | After 1 Year | Actual Weight | Drift |
|---|---|---|---|---|---|
| HDFC Bank | 40% | ₹4,00,000 | ₹4,80,000 | 35.8% | −4.2% |
| Titan | 35% | ₹3,50,000 | ₹5,95,000 | 44.3% | +9.3% |
| Infosys | 25% | ₹2,50,000 | ₹2,65,000 | 19.7% | −5.3% |
After one year, Titan has surged and now makes up 44.3% of the portfolio — well above its 35% target. HDFC Bank and Infosys have drifted below their targets. To rebalance back to the original targets, you would sell approximately ₹1.25 lakh worth of Titan and deploy the proceeds into HDFC Bank (₹57,000) and Infosys (₹68,000).
Why It Feels Counterintuitive
Rebalancing creates a deep psychological conflict in the investor's mind, and this is precisely why it is so rarely done consistently. You are being asked to:
- Sell your winners: Titan is up 70% and performing beautifully. Every instinct says to let it run. Selling some of it feels like leaving money on the table.
- Buy your laggards: Infosys is up only 6% while the broader market rallied. Adding to it feels like throwing good money after bad.
Yet the theoretical case for rebalancing is compelling: by systematically trimming what is expensive and adding to what is relatively cheaper, you are enforcing a buy-low-sell-high discipline that most investors fail to execute emotionally. The question is whether this discipline generates enough extra return to justify the capital gains tax you pay every time you sell.
Two Rebalancing Philosophies
Threshold rebalancing is more efficient in theory — you only act when the drift is large enough to matter. Calendar rebalancing is simpler in practice but can trigger unnecessary transactions when the portfolio has barely moved. The Backtest tab tests both approaches head-to-head, on your actual portfolio, after accounting for the tax drag that turns theoretical gains into real-world returns.
3. The Four Scenarios Explained
The Backtest tab simulates four distinct scenarios simultaneously. Each is represented as a line on the NAV chart, and each answers a specific question about your portfolio's history.
Why These Four? The Three Questions They Answer
The four scenarios are not arbitrary. They are structured to answer exactly the questions that matter to a long-term Indian equity investor:
Three Questions, Three Comparisons
- Hold vs Threshold Net: Is rebalancing worth doing at all? If Net is lower than Hold after all those taxes, the answer is no — stay the course and do nothing.
- Threshold Gross vs Threshold Net: How much did taxes actually cost you? The gap between these two lines, expressed as a percentage of the Gross line's gains, is the tax drag. This quantifies something most investors only vaguely sense.
- Threshold Net vs Calendar Net: Is smart, drift-triggered rebalancing better than blindly rebalancing every quarter? If Threshold Net is higher, timing matters. If Calendar is close or higher, simplicity wins.
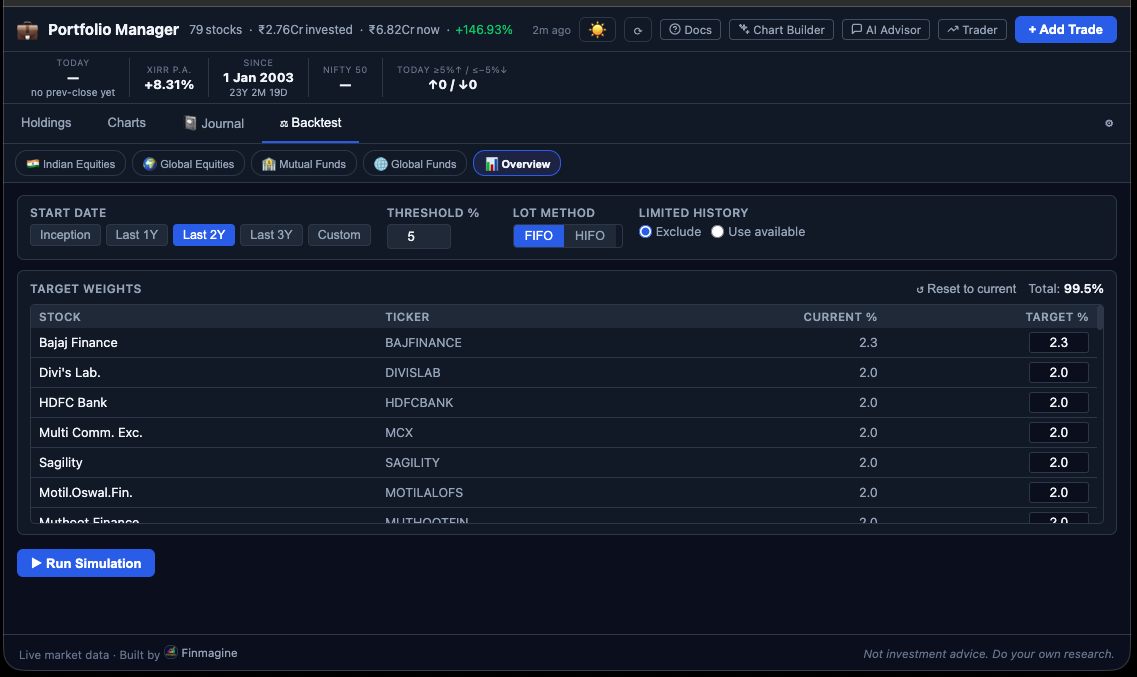
4. Setting Up Your First Backtest
The configuration panel appears at the top of the Backtest tab. There are five parameters to set before running the simulation. Understanding each one — and why it matters — is essential to getting results you can actually act on.
4.1 Start Date
The start date defines where the simulation begins. The backtest re-values your portfolio at the chosen start date, sets initial weights from that valuation, then tracks what happens from there.
- Inception: Uses your earliest trade date across all active holdings. This gives the longest possible history and the most statistically significant result. Use this by default.
- Custom date: Lets you focus on a specific market cycle. For example, selecting January 1, 2020 tests how your portfolio behaved through the COVID crash and the subsequent bull market. Selecting April 1, 2022 examines the post-FII-selloff period. Custom dates are useful for stress-testing: "how would threshold rebalancing have performed specifically in a down market?"
4.2 Threshold %
The threshold is the drift tolerance — the maximum allowed deviation between a stock's actual portfolio weight and its target weight before a rebalancing event is triggered. A threshold of 5% means: if a stock is targeted at 15% but its actual weight rises to 20.1% or falls to 9.9%, the simulation rebalances the entire portfolio back to targets.
| Threshold | Behaviour | Typical Rebalancing Frequency | Best Suited For |
|---|---|---|---|
3% |
Very active, reacts to minor drift | Monthly–bimonthly | Portfolios with tight conviction weights where even 3% drift feels uncomfortable |
5% (default) |
Balanced — catches meaningful drift without overtrading | Quarterly–semi-annually | Most long-term equity portfolios |
10% |
Relaxed — only acts on significant drift | Semi-annually–annually | Larger portfolios where transaction cost efficiency matters |
15–20% |
Near-passive, only catches major dislocations | Annually–rarely | Testing whether any rebalancing at all adds value vs complete buy-and-hold |
A practical approach: run the backtest at 5% first to see the baseline result, then experiment with 3% and 10% to understand the sensitivity. Portfolios with high inter-stock correlations (e.g., multiple banking stocks) tend to benefit from higher thresholds because correlated stocks drift together and reduce the benefit of frequent rebalancing.
4.3 Lot Method
When the simulation needs to sell a stock to rebalance, it must decide which specific lots (batches of shares at different purchase prices) to sell first. The lot method controls this decision and has a direct impact on tax efficiency.
Full detail on FIFO and HIFO is in Section 9. Here is the quick summary:
- FIFO (First In, First Out): The oldest shares are sold first. Old shares are more likely to be held for over 12 months, qualifying for LTCG at 13% rather than STCG at 20.8%. FIFO tends to generate lower tax rates per sale but potentially larger absolute gains (since old shares were bought cheap).
- HIFO (Highest In, First Out): The most expensive shares per unit are sold first. This minimises the capital gain per share on each sale — selling near your cost basis means a small gain, which means less tax per transaction. HIFO can be better when you have recently purchased lots at high prices during regular SIPs.
4.4 Limited History Handling
Not all stocks in your portfolio have price data going back to your chosen start date. Recently listed companies (IPOs from 2022 onwards), stocks you tracked on Screener.in that are not well-covered by Yahoo Finance, or companies that were relisted after restructuring may have incomplete historical data.
- Exclude: Stocks with insufficient history are completely removed from that backtest run. The portfolio is scaled to 100% across the remaining stocks. This gives the cleanest comparison but may not reflect how you actually invested.
- Use Available: Stocks are included only from the date their price data begins. Before that date, the portfolio operates without those stocks. This is messier but closer to reality for portfolios that added newer listings over time.
The exclusion count is reported in the backtest results footer — "Excluded: 3 stocks". If many of your holdings are excluded, the backtest is comparing a different portfolio than the one you actually hold. In that case, try a more recent start date that covers all your holdings, or switch to "Use Available".
4.5 Target Weights
Target weights define what you want each stock to be as a percentage of your portfolio. Every rebalancing event in the simulation brings actual weights back toward these targets.
Reset to current allocation is a convenient starting point — it sets targets equal to your portfolio's current actual weights. This is useful for a baseline run: "if I had been maintaining today's allocation consistently, would rebalancing have helped?"
However, the most meaningful use of the Backtest tab is to set targets that reflect your investment thesis rather than your current state. A few principles:
- Target should reflect conviction, not current reality: If Zomato has grown to 18% of your portfolio through price appreciation but your conviction is that 10% is the right size for an unprofitable, high-risk business, set the target at 10%. The backtest will show you whether systematically rebalancing it back to 10% was wise.
- Sector concentration: Consider whether you are implicitly overweight a sector. If four of your stocks are from banking and NBFC, setting each at 15% creates 60% sector concentration. The targets you enter should reflect your sector-level comfort too.
- Weights must sum to 100%: The configuration panel will flag any imbalance. An automatic "normalize to 100%" button helps when manual entries do not sum perfectly due to rounding.
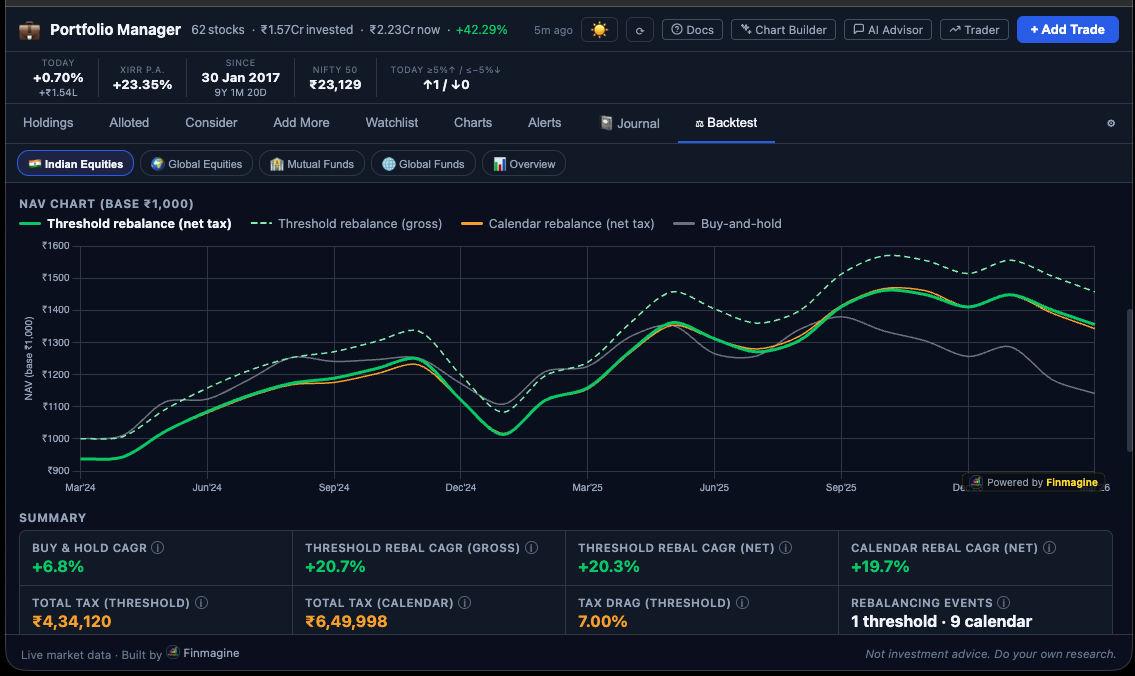
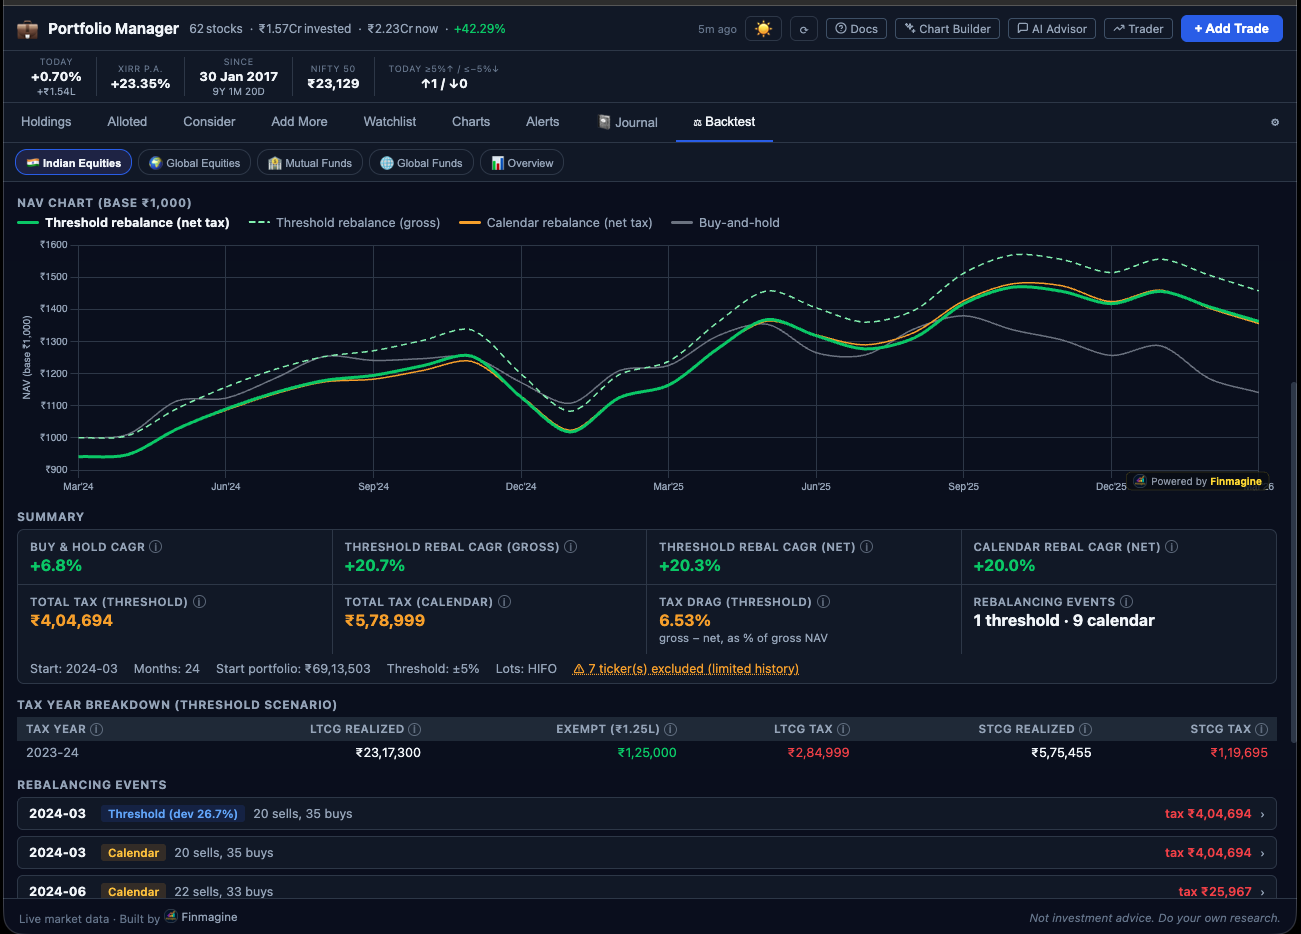
5. Reading the NAV Chart
The NAV chart is the centrepiece of the Backtest tab. It plots the normalised growth of your portfolio under each of the four scenarios, starting from ₹1,000 at the chosen start date. The Y-axis is the NAV (Net Asset Value), and the X-axis is the timeline in months.
Why ₹1,000?
Normalising every scenario to ₹1,000 at the start date serves one crucial purpose: it makes all four scenarios directly comparable regardless of your actual portfolio size. Whether your portfolio started at ₹5 lakhs or ₹50 lakhs, the four lines begin at the same point, and the vertical distance between them represents pure strategy differences — not absolute rupee amounts.
What Each Line's Shape Tells You
The chart is interactive — hovering over any point shows the exact NAV value and the corresponding calendar date for all four scenarios simultaneously. But the shape of the lines is often as revealing as the final values:
- Lines moving apart during bull markets: When the market is trending strongly upward, threshold rebalancing will repeatedly trim your winners and add to laggards — potentially underperforming buy-and-hold during the bull run itself. You may see the green Threshold Net line dip below the grey Hold line during prolonged rallies. This is normal and expected.
- Lines converging after corrections: After a market correction, the rebalanced portfolios should recover faster than buy-and-hold because rebalancing forced purchases of cheaper stocks near the bottom. The lines will tend to re-cross with Threshold Net above Hold after a recovery.
- Calendar chasing Threshold but with a lag: Calendar rebalancing cannot react to intra-quarter drift. If a stock surges 40% in one month and corrects the next month, threshold rebalancing would have trimmed it at the peak; calendar rebalancing would wait until quarter-end and miss the correction benefit. This manifests as the amber Calendar line tracking the green Threshold Net line but with visible lag at inflection points.
The Gap Between Dashed Green and Solid Green
The visual gap between the Gross line (dashed green) and the Net line (solid green) is one of the most valuable outputs of the entire backtest. This gap represents pure tax drag — the capital gains taxes you pay every time a threshold rebalancing event triggers a sale. Watch how this gap evolves over time:
- A narrow gap suggests that most of your rebalancing sales generate small gains (perhaps because HIFO is selecting high-cost lots, or because your winners are modest). Tax drag is low.
- A widening gap accelerating in later years suggests compounding tax drag — each year's taxes reduce the base that earns returns in subsequent years, and the effect compounds. This is the primary argument for higher thresholds or HIFO lot selection.
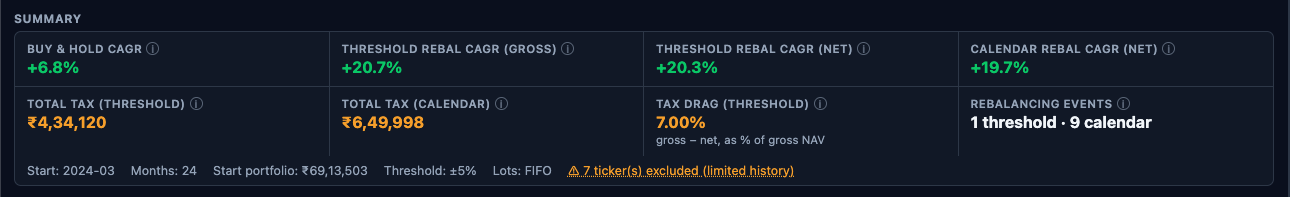
6. Understanding the Summary Cards
Below the NAV chart, eight summary cards present the key metrics of the backtest in a scannable format. Each card focuses on one number that answers a specific question.
How to Read the Summary Cards Together
The cards are designed to be read as a story. Work through them left to right:
- Start with Hold vs Threshold Net: Is rebalancing adding value at all? In the example above, 22.9% vs 21.5% — a small but real advantage. Rebalancing earned its keep.
- Check Gross vs Net: 25.6% gross but only 22.9% net. Tax drag consumed 2.7 percentage points of CAGR. Is that too much? See the Tax Drag card: 10.5% of the theoretical benefit was lost to taxes. Whether that is acceptable depends on how much the gross outperformance justified the rebalancing effort.
- Compare Threshold Net vs Calendar Net: 22.9% vs 19.3%. Threshold rebalancing — triggered by actual drift — significantly outperformed mechanical quarterly rebalancing. Smart timing mattered in this case.
- Look at Total Tax: ₹1.84 lakh for threshold vs ₹2.21 lakh for calendar. Threshold rebalancing paid less total tax because it triggered fewer, more targeted events than the rigid quarterly calendar. This explains why Calendar underperformed despite similar market exposure.
The Footer Row
Below the eight cards, a footer row provides the backtest metadata: Start Date (when the simulation began), Months (total simulation duration), Starting Portfolio Value (actual rupee value at start date), Threshold % (the drift tolerance used), Lot Method (FIFO or HIFO), and Excluded (count of stocks removed due to insufficient price history). Always check the exclusion count — if it is high, the backtest is testing a materially different portfolio than your actual one.
7. The Tax Year Breakdown Table
The Tax Year Breakdown table (visible for both Threshold and Calendar scenarios) provides an annual ledger of exactly how much capital gains tax the simulation paid, broken down by LTCG and STCG, for each Indian financial year. This is where the backtest transitions from an investment performance tool to a genuine tax planning aid.
Column-by-Column Explanation
| Column | Definition | What It Tells You |
|---|---|---|
| Tax Year | Indian FY (April 1 – March 31), e.g., "FY26" = Apr 2025–Mar 2026 | Aligns with ITR filing — you can see which FYs had taxable events |
| LTCG Realized | Total profit from shares held > 12 months, sold during rebalancing in that FY | Higher LTCG = older shares being sold; likely to qualify for 12.5% rate |
| Exempt (₹1.25L) | Amount of LTCG shielded by the Section 112A annual exemption | Resets every April 1 — shows how much of your exemption was "used" each year |
| LTCG Tax | (LTCG Realized − Exempt) × 12.5% × 1.04 cess = effective 13% | Actual tax liability on long-term equity gains |
| STCG Realized | Total profit from shares held ≤ 12 months, sold during rebalancing in that FY | High STCG suggests your portfolio has many young positions or you set a low threshold |
| STCG Tax | STCG Realized × 20% × 1.04 cess = effective 20.8% | The expensive tax category — rebalancing should minimise STCG sales where possible |
Sample Tax Year Breakdown (Illustrative)
| Tax Year | LTCG Realized | Exempt (₹1.25L) | LTCG Tax | STCG Realized | STCG Tax | Total Tax |
|---|---|---|---|---|---|---|
| FY22 | ₹2,14,000 | ₹1,00,000 | ₹14,820 | ₹38,000 | ₹7,904 | ₹22,724 |
| FY23 | ₹1,82,000 | ₹1,25,000 | ₹7,410 | ₹22,000 | ₹4,576 | ₹11,986 |
| FY24 | ₹3,60,000 | ₹1,25,000 | ₹30,550 | ₹15,000 | ₹3,120 | ₹33,670 |
| FY25 | ₹4,80,000 | ₹1,25,000 | ₹45,500 | ₹8,000 | ₹1,664 | ₹47,164 |
| Total | ₹12,36,000 | ₹4,75,000 | ₹98,280 | ₹83,000 | ₹17,264 | ₹1,15,544 |
What to Learn from the Tax Year Table
The tax breakdown table reveals patterns that can directly improve your rebalancing strategy going forward:
- High STCG in early years: If your first few FYs show significant STCG, it means rebalancing events happened while many positions were still young. Consider starting your rebalancing practice after most positions are at least 12 months old, or use HIFO to minimise short-term gain amounts.
- Exemption not fully used: If "Exempt (₹1.25L)" is consistently below ₹1.25 lakh, you are not taking full advantage of the Section 112A exemption. In real practice, you could harvest up to ₹1.25 lakh of LTCG each FY near year-end at zero tax — the backtest shows you how much "tax-free rebalancing capacity" existed each year.
- Tax spike in bull years: Large LTCG in FY24 (example: ₹3.6 lakh) often corresponds to a strong bull market year where rebalancing triggered many sales. This is expected — strong rallies generate large gains. The question is whether the portfolio gain justified the tax bill.
- Trend of STCG decreasing over time: If STCG falls year-over-year as the portfolio matures, this is a healthy sign that your positions are ageing into the long-term category and your rebalancing is becoming more tax-efficient organically.
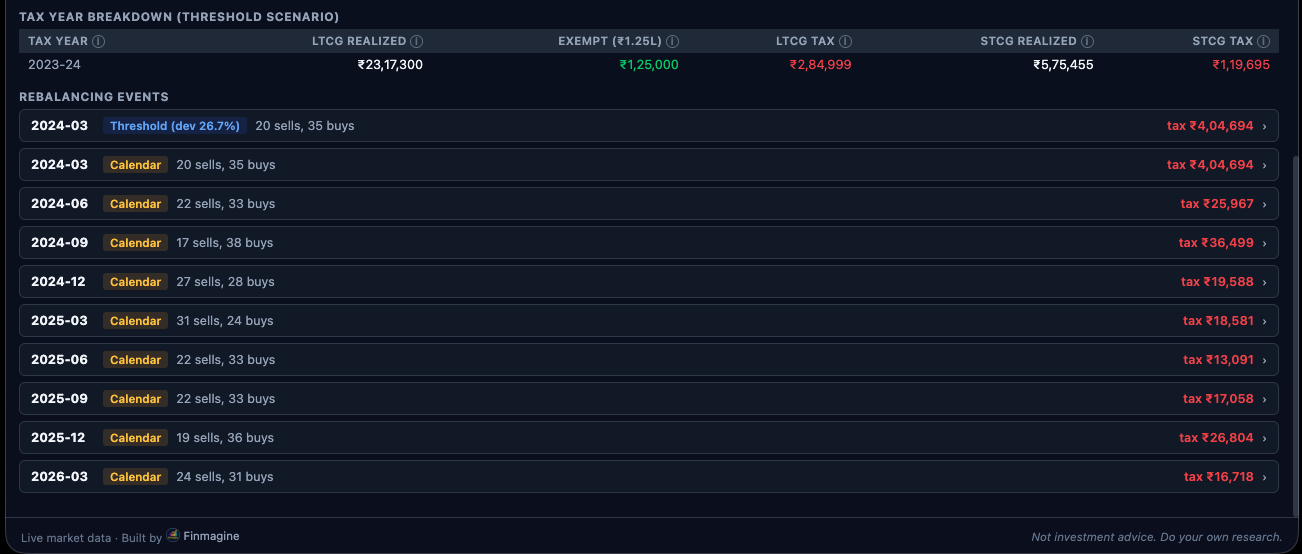
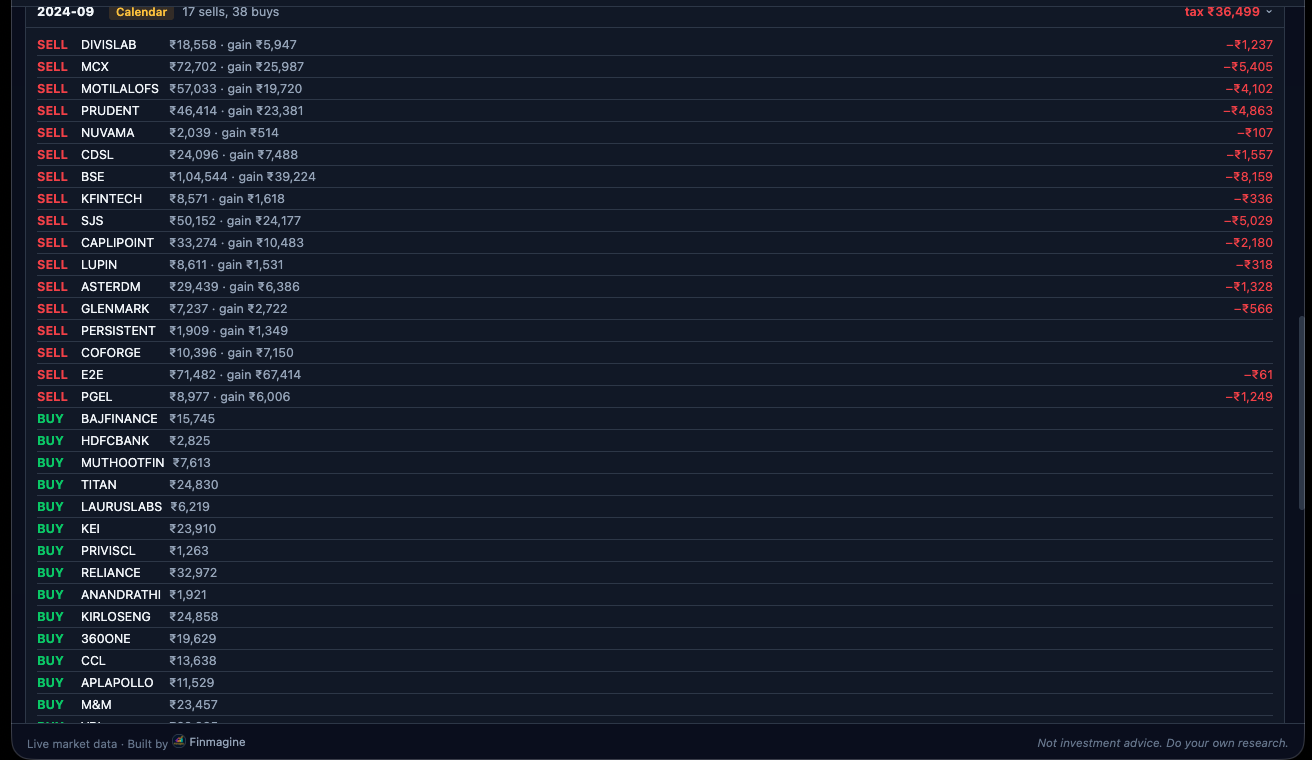
8. The Rebalancing Events Log
The Rebalancing Events Log is an accordion list that records every individual rebalancing transaction the simulation executed. It is the most granular output in the backtest — you can see exactly when each event was triggered, what was sold, what was bought, and how much tax was paid.
Event Header Row
Each collapsed event row shows three pieces of information at a glance:
- Date: The month-end when the rebalancing was triggered. Threshold events show the stock that crossed the threshold first; Calendar events show the quarter label (Q1 = June, Q2 = September, Q3 = December, Q4 = March).
- Type badge: Green for Threshold, Amber for Calendar.
- Deviation annotation: For Threshold events, shows which stock triggered the rebalancing and by how much ("dev +8.2% above target" means the stock was 8.2 percentage points above its target weight — not 8.2% price movement).
Expanded Event Detail
Clicking any event row expands it to show the full transaction detail for that rebalancing:
Why Calendar Events Sometimes Show the Same Month as Threshold Events
Calendar rebalancing always occurs at the end of March, June, September, and December. Threshold rebalancing can occur at the end of any month when a drift breach is detected. It is possible (and relatively common) for a threshold event to be triggered in the same month as a scheduled calendar event — for example, a stock drifts past threshold in late June, triggering a threshold event at June month-end, which coincides with the Q1 calendar event. In this case, the log will show two events for June: the Threshold event (which ran first) and the Calendar event (which found minimal drift remaining after the threshold event and executed minimal or no transactions).
9. FIFO vs HIFO — Which Should You Choose?
The choice between FIFO and HIFO is not merely a technical setting in the Backtest tab — it is one of the most consequential tax decisions an Indian equity investor can make, and most investors have never thought about it at all. This section explains both methods in plain English, works through a detailed numerical example, and provides a decision framework.
The Core Logic
When you hold multiple lots of the same stock (bought at different times and different prices) and the simulation needs to sell some shares to rebalance, it must choose which lots to sell first. Indian tax law allows you to choose. Your choice determines:
- Whether the gain is LTCG (cheaper, 13%) or STCG (expensive, 20.8%)
- The absolute size of the taxable gain per share
Detailed Worked Example: HDFC Bank
Your portfolio holds three lots of HDFC Bank accumulated over different periods:
| Lot | Shares | Buy Price | Buy Date | Holding Period | Gain Category |
|---|---|---|---|---|---|
| Lot A | 50 shares | ₹1,200/share | Jan 2022 (3+ years ago) | 37 months | LTCG |
| Lot B | 30 shares | ₹1,600/share | Mar 2023 (2 years ago) | 24 months | LTCG |
| Lot C | 20 shares | ₹1,900/share | Nov 2024 (4 months ago) | 4 months | STCG |
Current price: ₹2,000/share. The simulation needs to sell ₹30,000 worth of HDFC Bank = 15 shares.
Under FIFO (sell Lot A first — oldest)
| Detail | Value |
|---|---|
| Shares sold | 15 shares from Lot A (bought at ₹1,200) |
| Sale proceeds | 15 × ₹2,000 = ₹30,000 |
| Cost basis | 15 × ₹1,200 = ₹18,000 |
| Capital gain | ₹30,000 − ₹18,000 = ₹12,000 |
| Holding period | 37 months → LTCG |
| FIFO Tax (assuming ₹1.25L exemption used up) | ₹12,000 × 13% = ₹1,560 |
Under HIFO (sell Lot C first — highest cost price)
| Detail | Value |
|---|---|
| Shares sold | 15 shares from Lot C (bought at ₹1,900) |
| Sale proceeds | 15 × ₹2,000 = ₹30,000 |
| Cost basis | 15 × ₹1,900 = ₹28,500 |
| Capital gain | ₹30,000 − ₹28,500 = ₹1,500 |
| Holding period | 4 months → STCG |
| HIFO Tax | ₹1,500 × 20.8% = ₹312 |
In this specific example, HIFO pays only ₹312 in tax versus FIFO's ₹1,560 — an 80% tax saving on this single transaction. HIFO wins decisively here because Lot C was bought very close to the current price, generating a tiny gain that happens to be STCG. The absolute tax amount is far smaller than the LTCG on the cheap Lot A.
When FIFO Wins
HIFO's advantage erodes in certain scenarios:
- When your highest-cost lots are also your oldest: If you made your largest purchases during a market peak 3+ years ago (high cost, LTCG), HIFO sells these at a large gain but at LTCG rates. FIFO might sell your early (cheap) lots at LTCG rates with a massive gain — but if the annual exemption is still available, FIFO could be tax-free.
- When LTCG exemption is available: If your LTCG realized this FY is still under ₹1.25 lakh, selling via FIFO (which generates LTCG) is tax-free up to that limit. HIFO's STCG is taxed at 20.8% with no exemption. In this case FIFO wins clearly.
- Long-term compounding of cost basis: HIFO preserves your cheapest (oldest) lots. Over decades, these cheap lots compound without realising gains. However, when you eventually exit the position entirely, you will pay a large gain on the accumulated cheap lots. FIFO depletes the cheap lots first but preserves high-cost recent lots that generate smaller gains when eventually sold.
Run the backtest twice — once with each method — and compare "Total Tax (Threshold)" in the summary cards to find which works better for your specific lot structure.
10. Practical Interpretation Guide
Running the backtest produces numbers. Translating those numbers into investment decisions requires understanding what each pattern means and what action it suggests. Here are the five most common output patterns and their implications:
Pattern 1: Threshold Net > Buy & Hold
Action: Continue rebalancing at the current threshold. This is the outcome that vindicates the discipline. Consider whether a slightly higher threshold (e.g., moving from 5% to 7%) would have produced similar results with less tax friction — run that test too.
Pattern 2: Threshold Net < Buy & Hold
Action: Try the following in sequence: (1) Switch lot method — if you used FIFO, try HIFO. (2) Raise the threshold — try 10% or 15% to reduce the frequency of rebalancing events. (3) Check how many stocks were excluded — if many young stocks were excluded, the backtest may not reflect your actual portfolio. (4) Try a different start date — a start date after a market peak can skew results toward buy-and-hold.
Pattern 3: Gross >> Net with Large Tax Drag (>15%)
Action: Prioritise tax efficiency. Switch to HIFO if on FIFO. Raise the threshold significantly to allow more drift before triggering. Consider whether some of the rebalancing could be accomplished by deploying fresh capital into underweight positions rather than selling overweight ones — new investments do not generate capital gains tax.
Pattern 4: Calendar Net > Threshold Net
Action: Try a lower threshold (e.g., 3%) which will trigger more frequently and may better approximate the calendar cadence. Also check the "Rebalancing Events" count — if Threshold only triggered 8 times over 5 years while Calendar ran 20 times, the threshold may have been set too high for your portfolio's volatility characteristics.
Pattern 5: High Exclusion Count
Action: Either use a more recent start date that covers all holdings, or switch limited history handling from "Exclude" to "Use Available". If the excluded stocks represent more than 15–20% of your current portfolio value, treat the backtest results with caution.
11. What Backtest Cannot Tell You
The Backtest tab is a powerful analytical tool, but intellectual honesty demands acknowledging what it cannot do. Treating backtest results as predictive would be a serious mistake. Here are the key limitations:
Transaction Costs
The simulation does not deduct brokerage commissions, STT (Securities Transaction Tax), or exchange transaction charges from rebalancing sales and purchases. For long-term investors using discount brokers, these costs are typically 0.1–0.3% of transaction value — small but not zero. In portfolios where the backtest shows Threshold Net only marginally outperforming Buy & Hold, transaction costs in real execution might eliminate that advantage entirely. For large portfolios (above ₹50 lakhs), the absolute transaction cost on a ₹5 lakh rebalancing event could be ₹5,000–₹15,000.
Dividends
Yahoo Finance monthly closing prices for Indian equities are not reliably adjusted for dividends. For stocks with meaningful dividend yields (HDFC Bank, Coal India, ITC), the actual total return is higher than the price return captured in the backtest. All four scenarios are affected equally by this limitation, so the relative comparison between strategies is largely unaffected. However, absolute CAGR figures in the backtest will be modestly understated for dividend-paying portfolios.
Intra-Month Timing
All rebalancing events execute at month-end closing prices. In reality, you would rebalance at whatever price was available on the day you acted. A stock that hit its threshold on the 5th of the month but was simulated at the 30th price could have a materially different outcome in the simulation versus reality. This is a standard limitation of all monthly-frequency backtests and is generally accepted as a minor source of noise rather than systematic bias.
Tax-Loss Harvesting
The backtest does not implement tax-loss harvesting — the practice of realising paper losses to offset taxable gains. In reality, a sophisticated investor would use accumulated losses in some positions to reduce the capital gains tax on rebalancing sales elsewhere. The backtest therefore potentially overstates the tax burden of rebalancing strategies in portfolios that carry some underwater positions.
Future Returns
This is the most important limitation: a backtest that shows rebalancing added 1.5% CAGR over the past 5 years says nothing about whether rebalancing will add 1.5% CAGR over the next 5 years. Market regimes change. Indian equities from 2020 to 2025 experienced a powerful post-COVID recovery followed by moderate FII outflows — a specific regime that may not repeat. The backtest is a diagnostic tool, not a forecasting tool.
Mutual Funds and Global Equity
The Backtest tab currently supports only Indian equities. Holdings in the IN_MF (Indian mutual fund), GL_EQ (global equity), and GL_MF (global mutual fund) asset classes are excluded from the backtest simulation. The backtest runs exclusively on your IN_EQ holdings. If Indian equities represent only a portion of your total portfolio, the backtest results reflect that subset, not your overall portfolio strategy.
Article Series
📚 Finmagine Portfolio Manager — Complete Article Series
- 1 Introducing Finmagine Portfolio Manager
- 2 Per-Broker Stop-Loss
- 3 XIRR & Index Beat
- 4 Charts & Visual Analytics
- 5 Watchlist as Research Dashboard
- 6 Multi-Asset Tracking
- 7 The Decision Journal
- 8 v1.1.0 Update
- 9 Backtest Guide (this article)
- 10 Inside the Backtest Engine
12. Flashcards — Test Your Understanding (30 Q&A)
Click any card to reveal the answer. These cover every major concept in the article — useful for review or sharing with fellow investors in your community.
Run Your First Backtest Today
The Backtest tab is available in Finmagine Portfolio Manager — a free Chrome extension that works with your Screener.in portfolio. Add your holdings, open the Backtest tab, and find out whether rebalancing would have worked for you — with your actual stocks, your actual buy prices, and your actual tax situation.
Install Portfolio Manager Free →Finmagine Portfolio Manager
Per-broker stop-loss discipline, live prices, XIRR, Index Beat, Charts — for Indian Equities, US Stocks, Mutual Funds & Global ETFs. Local-first portfolio tracking, optional cloud backup.
Learn More about Portfolio Manager →Also From Finmagine
Per-broker stop-loss discipline, live XIRR, Index Beat & multi-asset tracking in one Chrome extension.
The one-click NSE momentum scanner — Stage 2, Near High, VCP, IPO Breakout across every NSE stock.
Are you actually beating Nifty 50 and Nifty 500? Annualised returns that account for when you invested, not just how much.