🌟 Finmagine Portfolio Manager — Now on the Chrome Web Store
Multi-broker tracker: Indian & global stocks, MFs, ETFs • Decision Journal, History Chart, Corporate Actions • Free
This final article covers how Finmagine Portfolio Manager tracks all 4 asset classes — Indian Equities (IN_EQ), Indian Mutual Funds (IN_MF), Global/US Equities (GL_EQ), and Global ETFs/Funds (GL_MF) — and unifies them into a single ₹-denominated view with one portfolio XIRR.
📑 In This Article
1. The Four Asset Classes
Most portfolio trackers are built for a single type of holding. If you use a broker app, it shows only the stocks and funds held through that broker. If you use a Zerodha console, it shows only Zerodha holdings. If you use an Excel sheet, it shows what you have entered — but computing XIRR across currencies is painful.
Finmagine Portfolio Manager is designed from the ground up to track four distinct asset classes in a single unified view:
Indian Equities
NSE/BSE-listed stocks. Works with any broker — the broker name is a free-text label you enter yourself. Prices in ₹. This is the default asset class and the most fully featured — all 7 Charts tab types, per-broker holdings columns, XIRR, and Index Beat (N50/N500).
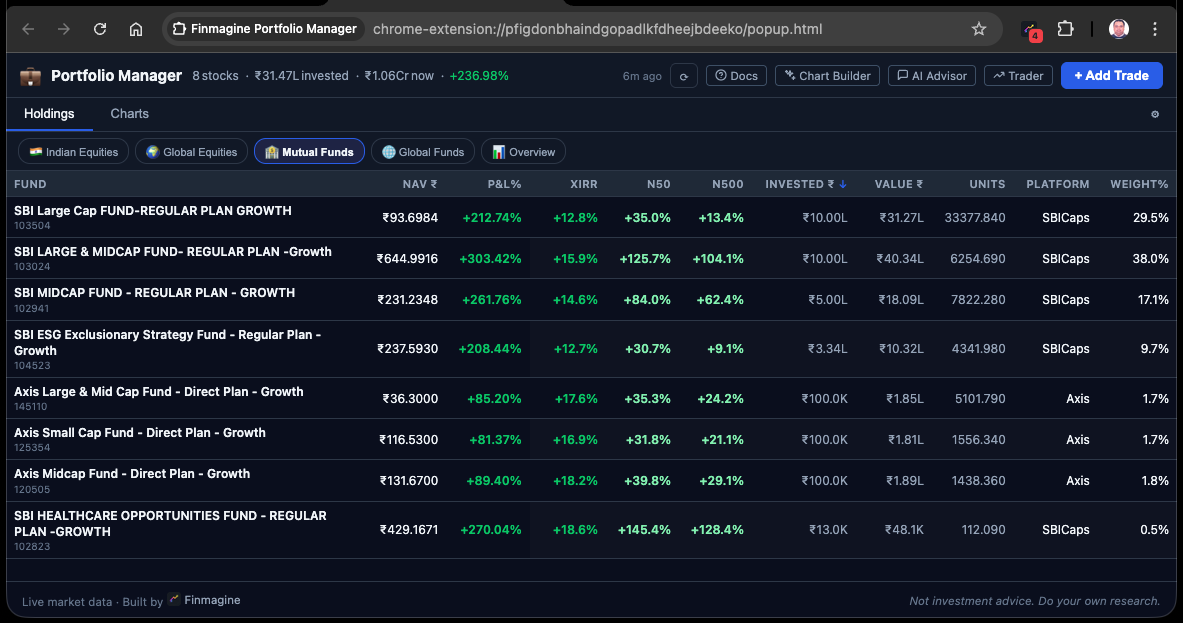
Indian Mutual Funds
Indian mutual fund units tracked by AMFI scheme code or scheme name. NAV sourced from the AMFI API. Holdings display with the same P&L%, XIRR, and allocation charts as IN_EQ, but without the broker-column breakdown or ChartInk momentum signals.
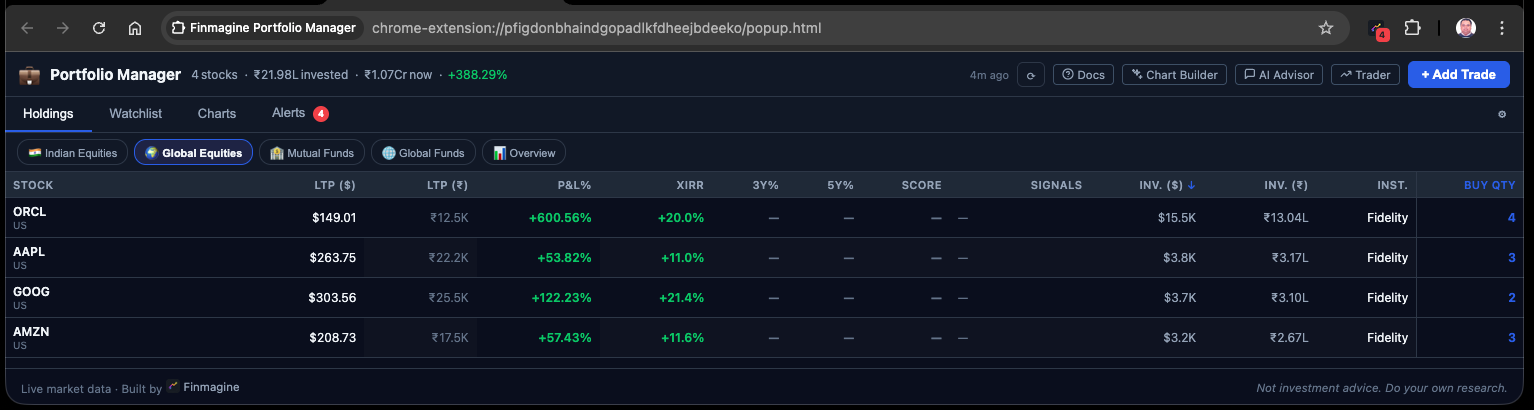
Global / US Equities
US-listed stocks (NYSE, NASDAQ) held in platforms like INDMoney, Vested, or Groww US. Prices in USD via Yahoo Finance + stockanalysis.com for fundamentals. Converted to ₹ at the configured FX rate for unified reporting.
Global ETFs / Mutual Funds
US-listed ETFs (VOO, QQQ, FBGRX) and global funds held in retirement accounts (Rollover IRA, 401k) or international brokerage platforms. Same USD → ₹ conversion as GL_EQ, but with the MF-like tab layout (no broker columns).
Each asset class has different data sources, different UI requirements, and different behaviour in the holdings table. Keeping them separate lets the extension tailor the display — stock signals for IN_EQ, NAV for IN_MF, USD FX for GL_* — while still unifying them in the Overview pill.
2. Ticker Formats for Each Asset Class
The ticker format determines which data source the extension uses. Here is the convention for each asset class:
TITAN → Yahoo Finance: TITAN.NS | Screener: screener.in/company/TITAN
HDFCBANK → Yahoo Finance: HDFCBANK.NS
# IN_MF — AMFI scheme code or scheme name
120503 → AMFI API: api.mfapi.in/mf/120503
SBI Bluechip → resolved to AMFI scheme code
# GL_EQ — US ticker with US: prefix
US:AAPL → Yahoo Finance: AAPL | StockAnalysis: stockanalysis.com/stocks/aapl
US:MSFT → Yahoo Finance: MSFT | Price in USD → converted to ₹
# GL_MF — US ETF/fund ticker with US: prefix
US:VOO → Yahoo Finance: VOO | ETF NAV in USD → converted to ₹
US:FBGRX → Yahoo Finance: FBGRX | US mutual fund price
The US: prefix tells the extension to route the price fetch to Yahoo Finance without appending .NS, and to route the fundamentals fetch to stockanalysis.com instead of Screener.in.
For stocks listed only on BSE (no NSE ticker), the extension extracts the BSE numeric code from the company's BSE India page and uses it directly. These are rare but supported.
Trade Entry Format
When you enter trades in the extension, you specify the ticker using the formats above, along with:
| Field | IN_EQ / IN_MF | GL_EQ / GL_MF |
|---|---|---|
| Ticker | TITAN, 120503 | US:AAPL, US:VOO |
| Buy price | ₹ per share/unit | USD per share (as paid) |
| Quantity | Number of shares/units | Number of shares/units |
| Date | DD-MM-YYYY | DD-MM-YYYY |
| Charges | Brokerage, STT, GST in ₹ | Brokerage in USD (converted) |
| Broker | Any name — free-text label you enter | Any platform name — free-text label you enter |
3. Data Sources: NAV, LTP, and Price Feeds
IN_EQ — Indian Equities
Live prices fetched from Yahoo Finance using the TICKER.NS format (NSE tickers). For stocks also listed on BSE, the extension uses the BSE numeric code if NSE returns no data. Fundamental data (PEG, CAGR, 18 ratios) comes from Screener.in, cached for 90 days.
IN_MF — Indian Mutual Funds
NAV (Net Asset Value) for Indian mutual funds is fetched from the AMFI India API: api.mfapi.in/mf/{schemeCode}. This API provides daily NAV history, allowing the extension to compute XIRR using historical NAVs as the denominator for each trade's cash flow.
AMFI NAV API
- Returns full NAV history since scheme inception
- Updated by 11 PM on each business day
- Free, no authentication required
- Scheme code is stable — won't break if the fund is renamed
- For direct vs regular plans: same scheme code, different AMFI entries
GL_EQ and GL_MF — US Stocks and ETFs
US-listed tickers use Yahoo Finance for live price (no .NS suffix). The price is returned in USD. For GL_EQ, fundamentals are fetched from stockanalysis.com — P/E, ROE, ROCE, margins, D/E, and growth rates. For GL_MF (ETFs), fundamentals are limited since ETFs have no ROCE or EPS in the traditional sense.
US stock fundamentals come from stockanalysis.com using a 10-page parallel fetch. The extension parses table pairs from the HTML using a regex-based parser (DOMParser is unavailable in MV3 service workers). Fetches are rate-limited to avoid HTTP 429 responses — a 800ms batch delay + 1s inter-phase gap.
4. FX Conversion: How USD Holdings Become ₹
When you hold US stocks or ETFs, their prices are in USD. To show a unified portfolio value in ₹, the extension applies a USD→INR exchange rate to all GL_EQ and GL_MF values.
Configuring the FX Rate
The exchange rate is stored in settings as usdInrRate. You can update this manually in the extension settings. The default value is 84 (₹ per USD), reflecting approximate 2024–25 levels. For accurate reporting, update this periodically — especially if USD/INR moves more than 2–3% from the stored value.
What Gets Converted
Every USD value that appears in the unified view is multiplied by usdInrRate:
| Value | Original | After FX | Used In |
|---|---|---|---|
| Current price (LTP) | USD per share | ₹ per share | Holdings LTP column, P&L% |
| Position value | USD (qty × LTP) | ₹ | Overview table, Charts |
| Cost basis | USD (buy price × qty + charges) | ₹ | Overview table, XIRR cash flows |
| Trade cash flows (XIRR) | USD outflows | ₹ outflows | Unified portfolio XIRR |
The extension does not fetch a live USD/INR rate. It uses your stored rate. This means P&L% and XIRR for USD holdings reflect both the stock performance and any currency movement since your last rate update. For a long-term investor, this is usually fine. For short-term tracking, update the rate monthly.
The Indian Investor's Real Return
This FX-converted view actually captures something important that many USD-denominated tools miss: the real return for an Indian investor. When you bought VOO at $300 in 2020 and it is now $500, you made 67% in USD terms. But if USD/INR moved from ₹72 to ₹84 over the same period, your ₹-denominated gain is actually higher:
- Cost in ₹: $300 × 72 = ₹21,600
- Current value in ₹: $500 × 84 = ₹42,000
- Gain in ₹ terms: +94.4% vs +67% in USD
The extension's FX-converted view automatically captures this. Your XIRR in ₹ reflects the full compound return including currency tailwind (or headwind).
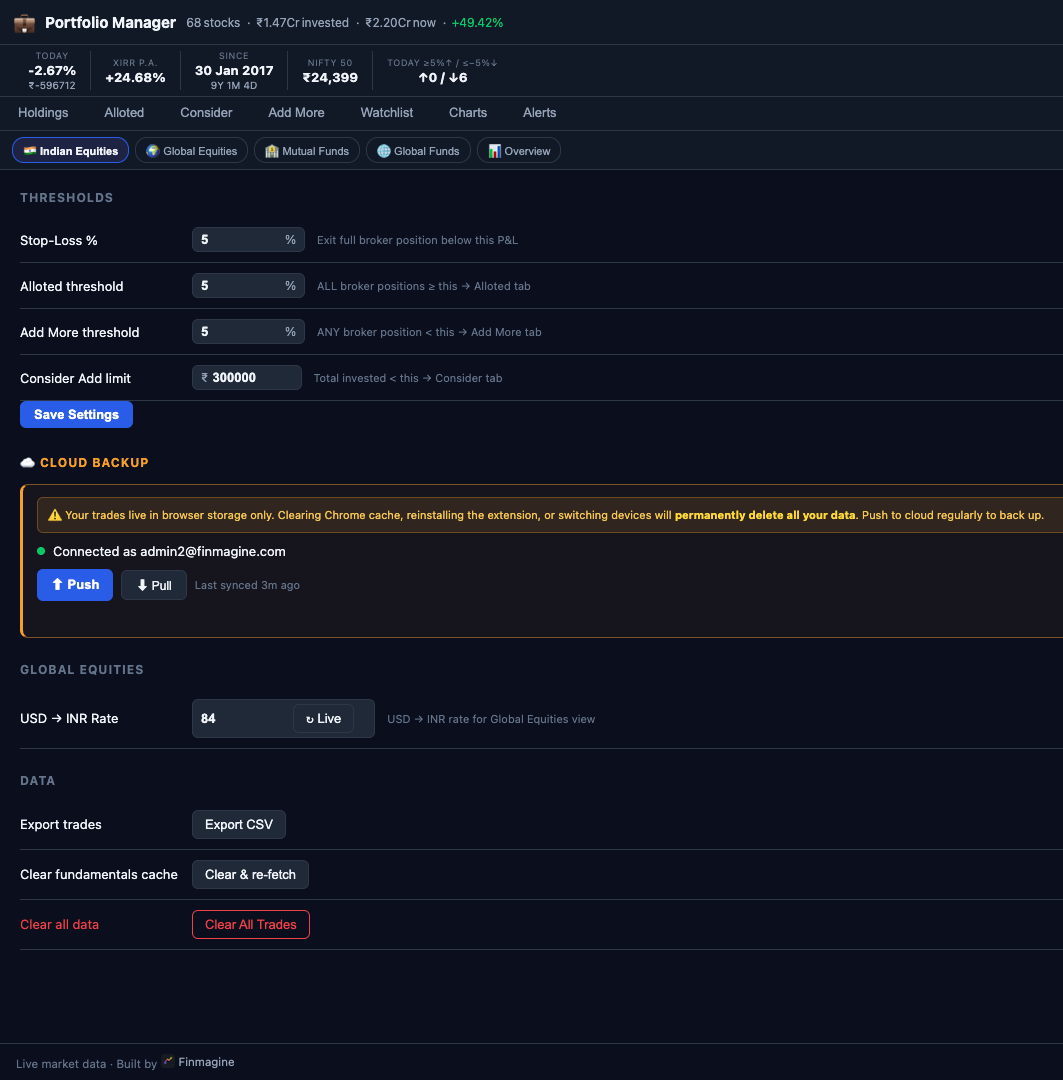
With four asset classes and years of trade history, you have a lot to lose. All data is stored in browser storage only — clearing Chrome cache or switching devices means starting from scratch. Use the ☁️ Cloud Backup section at the bottom of Settings to Push your data to your finmagine.com account regularly. It takes 2 seconds.
5. Unified Portfolio XIRR in ₹
Within each asset class pill (IN_EQ, IN_MF, GL_EQ, GL_MF), the extension computes an asset-class XIRR using trades and current prices denominated in their native currency.
In the 📊 Overview pill, a portfolio-wide XIRR is computed across all four asset classes simultaneously. To do this, all cash flows must be in the same currency. The extension normalises everything to ₹:
# IN_EQ and IN_MF — already ₹, no change
TITAN buy 100 @ ₹3,200 → outflow: −₹3,20,000
# GL_EQ — multiply USD buy price by FX rate
US:AAPL buy 10 @ $150 → outflow: −(10 × 150 × 84) = −₹1,26,000
# GL_MF — same USD → ₹ normalisation
US:VOO buy 5 @ $300 → outflow: −(5 × 300 × 84) = −₹1,26,000
# Current values also normalised
TITAN current: 100 × ₹3,442 = +₹3,44,200
US:AAPL current: 10 × $175 × 84 = +₹1,47,000
Once all outflows and the terminal inflow are in ₹, the Newton-Raphson XIRR solver in js/xirr.js computes the unified IRR — a single annualised ₹ return rate for your entire multi-asset portfolio.
Many investors know their XIRR on their Zerodha account and their INDMoney account separately. But they have never combined them. Finmagine Portfolio Manager's unified ₹ XIRR tells you the true blended return on your total investable capital — the number that actually determines whether you are building wealth at the rate you need.
6. The 📊 Overview Pill
The asset class pills at the top of the extension — IN_EQ IN_MF GL_EQ GL_MF — each show a single asset class. The 5th pill, 📊 Overview, aggregates all four.
Overview Summary Table
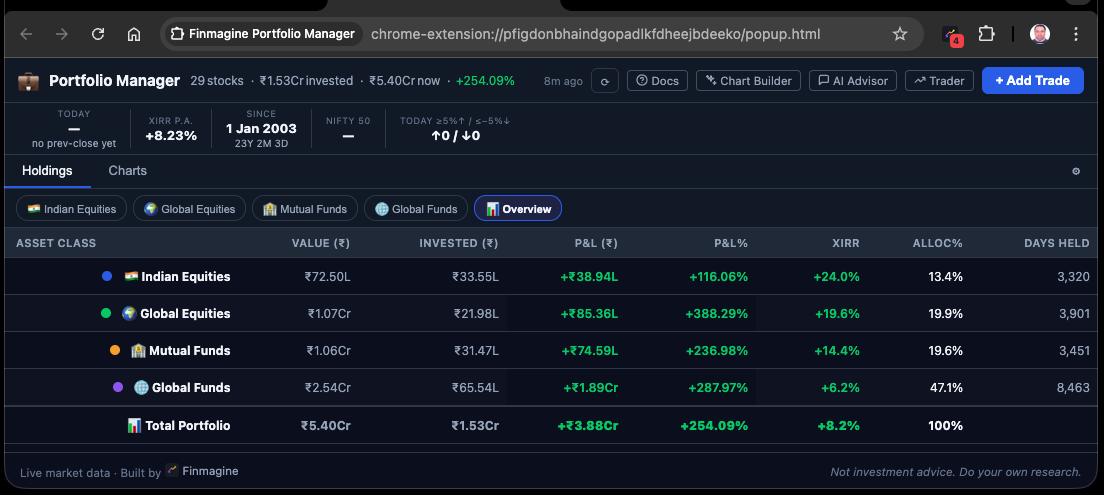
When you click the 📊 Overview pill, the Holdings area is replaced by a 4-row summary table — one row per asset class — plus a total footer row:
| Asset Class | Value (₹) | Invested (₹) | P&L ₹ | P&L % | XIRR | Alloc % | Days Held |
|---|---|---|---|---|---|---|---|
| IN_EQ Indian Equities | ₹24,80,000 | ₹18,20,000 | +₹6,60,000 | +36.3% | 18.4% | 52.1% | 847 |
| IN_MF Indian MF | ₹8,40,000 | ₹6,50,000 | +₹1,90,000 | +29.2% | 14.6% | 17.6% | 1,124 |
| GL_EQ Global Equities | ₹9,24,000 | ₹5,88,000 | +₹3,36,000 | +57.1% | 22.3% | 19.4% | 1,842 |
| GL_MF Global ETFs/Funds | ₹5,20,000 | ₹3,40,000 | +₹1,80,000 | +52.9% | 19.8% | 10.9% | 2,847 |
| 📊 Total Portfolio | ₹47,64,000 | ₹33,98,000 | +₹13,66,000 | +40.2% | 19.1% | 100% | — |
The P&L% in the total row is the weighted average across all four asset classes. The XIRR in the total row is the unified portfolio XIRR computed with all trades in ₹ (as described in Section 5). The Alloc % column shows each asset class as a proportion of total current portfolio value.
If you started with a target of 50% IN_EQ, 20% IN_MF, 20% GL_EQ, 10% GL_MF — but the Overview table now shows GL_EQ at 35% and IN_MF at 12% — your portfolio has drifted from target. The Overview table is the fastest way to spot this without opening a spreadsheet.
7. Overview Charts: Allocation and Cross-AC Rankings
The Charts tab adapts when the 📊 Overview pill is active. Instead of the 7 per-AC chart types, it shows 5 Overview-specific chart types:
| # | Chart Type | Chart Style | What It Shows |
|---|---|---|---|
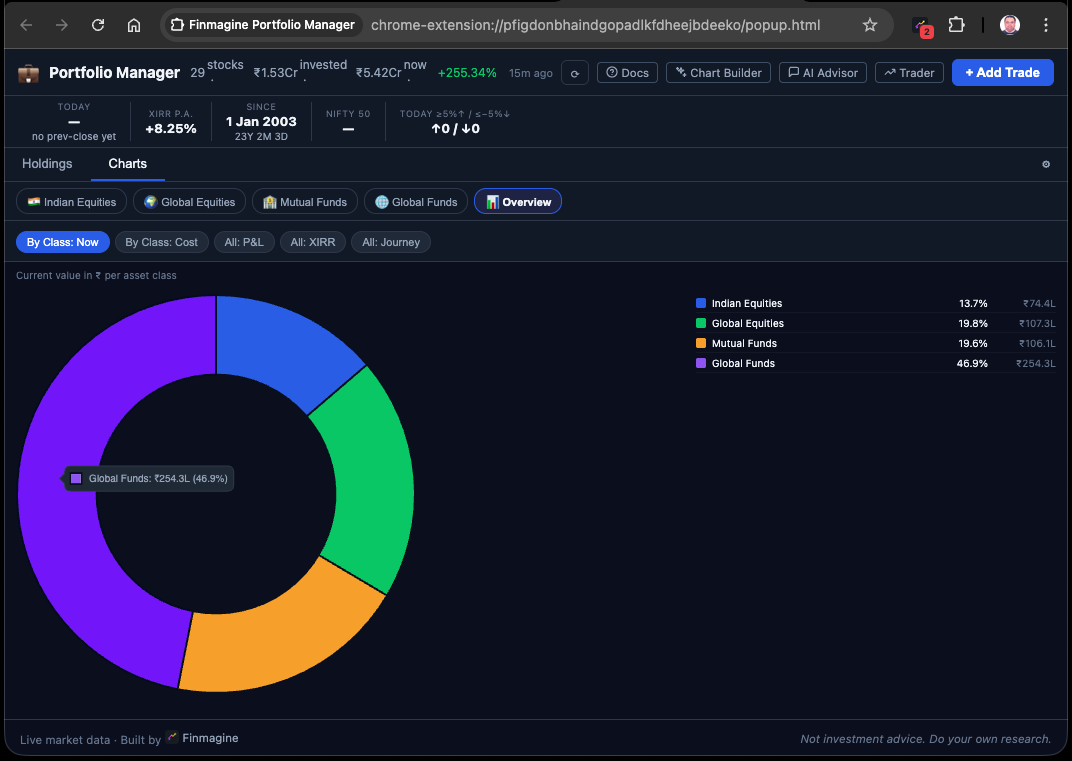
| 1 | By Class: Now | Donut | Current value in ₹ per asset class — matches the "Allocation NOW" donut in portfolio spreadsheets |
| 2 | By Class: Cost | Donut | Invested amount in ₹ per asset class — the "Invested Allocation" donut; shows where capital was deployed vs where it has grown |
| 3 | All: P&L | Horizontal bar | P&L in ₹ for all individual holdings across all 4 asset classes, ranked. Shows TITAN vs AAPL vs VOO side by side. |
| 4 | All: XIRR | Horizontal bar | Per-holding XIRR% across all 4 asset classes — surfaces the best and worst performers by time-weighted return. |
| 5 | All: Journey | Area chart | Cumulative ₹ invested over time across all asset classes. Shows the capital deployment timeline from first purchase to present. |
By Class: Now vs By Class: Cost
These two donuts answer a common question: where is my money now? vs where did I put my money? If GL_EQ started at 10% of invested capital but has grown to 19% of current value, that tells you US equities have outperformed. If IN_MF is 20% of invested capital but only 18% of current value, MF returns have slightly lagged the portfolio average.
All: P&L and All: XIRR — Cross-AC Rankings
These horizontal bar charts are unique because they show every holding across all 4 asset classes in one ranking. You might discover that FBGRX (a US mutual fund you have held since 2003) has an XIRR above 1,000% — making it the clear outlier in your portfolio. Or that a recently added Indian smallcap has the worst P&L despite the same holding period as a US stock.
USD values are converted to ₹ at the configured FX rate before ranking, so the comparison is fair across currencies.
All: Journey — Capital Deployment Timeline
The Journey chart in the Overview tab is cumulative ₹ invested over time. It includes all trades from all four asset classes (GL trades multiplied by FX rate). This gives you a visual history of your investing timeline — from your first purchase (potentially in the early 2000s for long-term investors) to today.
The Overview Charts tab does not show the broker-scope filter row. The Overview is a portfolio-wide view — filtering by a single broker would produce a misleading partial picture. Scope filtering remains available in the individual per-AC chart views.
8. The Complete Picture
You have now read the complete 6-article series. Here is how all the features connect:
The Flow From Trade Entry to Decision
- Enter trades for all 4 asset classes using the correct ticker format (NSE tickers, AMFI codes, US: prefix)
- The Holdings tab shows per-broker P&L%, XIRR, and signals for the active asset class — per-broker precision, not blended averages
- The Alloted / Consider / Add More tabs use your configured stop-loss thresholds to categorise each holding and broker lot — driving discipline on when to add, hold, or exit
- The Alerts tab surfaces any position breaching its stop-loss level, ensuring you act on discipline rather than emotion
- The Charts tab gives you visual insight per asset class — Composition, P&L, XIRR, Journey, Brokers, and Sector breakdowns
- The Watchlist tab compares your Holdings against research candidates using 23 fundamental columns, colour-coded and sortable
- The 📊 Overview pill unifies all 4 asset classes into a single ₹ table with one portfolio XIRR — the number that tells you whether your total capital is compounding at your target rate
What Finmagine Portfolio Manager Replaces
- Broker apps — for per-broker P&L% and allocation (no more switching between 4 apps)
- Spreadsheets — for XIRR computation across multiple asset classes
- Screener.in tabs — for fundamental comparison across your watchlist
- IndMoney/Kuvera — for MF NAV tracking and fund allocation
- Separate USD tracker — for US stock performance in ₹ terms
The extension is a Chrome extension, not a web app, for a specific reason: CORS bypass. By using host_permissions in the Manifest V3, it can fetch directly from Screener.in and ChartInk using your own browser session — no credentials stored on a server, no API keys, no subscription to a third-party data provider. Your data stays in your browser.
Portfolio XIRR in ₹ — computed across all your Indian equities, Indian mutual funds, US stocks, and global ETFs — is the single number that tells you whether you are compounding at the rate needed to reach your financial goals. Everything else in the extension is context for understanding that number and improving it.
🃏 Key Concepts — Flashcard Review
Click any card to reveal the answer.
📚 Finmagine Portfolio Manager — Article Series
Finmagine Portfolio Manager
Per-broker stop-loss discipline, live prices, XIRR, Index Beat, Charts — for Indian Equities, US Stocks, Mutual Funds & Global ETFs. Local-first portfolio tracking, optional cloud backup.
Learn More about Portfolio Manager →