Introducing Finmagine Trader
The complete guide — 8 strategy tabs, intersection logic, 5-minute morning workflow, privacy details. 60 flashcards.
Smart Stock Screener for Indian Markets
Finmagine Trader scans 2,000+ NSE stocks simultaneously and surfaces the strongest momentum setups in one click — free. Useful whether you are an active swing trader, a long-term investor checking market strength, or simply staying on top of where institutional money is moving right now.
Install Free on Chrome View Screener Tabs ↓See it in action
The complete guide — 8 strategy tabs, intersection logic, 5-minute morning workflow, privacy details. 60 flashcards.
Why three independent screeners agree on only 4–8 stocks per day. Intersection logic, market health reading, Score column. 40 flashcards.
Weinstein's 4 stages, all 7 SMA conditions, Stage 2 vs rising stock, NSE observations. 40 flashcards.
Minervini's VCP theory, small-cap asymmetric plays, 7 criteria, F&O exclusion, entry workflow. 40 flashcards.
Copy Symbols, 5-step TradingView import, Export CSV, 6-watchlist strategy, 5-step morning routine. 35 flashcards.
SMA-200 proxy hack, dual-fetch architecture, 7 scanner conditions, overhead supply explained, execution framework. 78 flashcards.
Index Filter (Nifty 50/100/200/500), MCap Filter, Score Filter (≥1 to =4). How to stack all three to go from scan list to conviction shortlist. 39 flashcards.
ATR(14) vs ATR(50), why absolute ATR% fails for Indian markets, how the filter propagates across three tabs, and the pre-breakout coiling thesis. v1.4.0 feature deep-dive.
Turnover (₹ Cr) column for liquidity assessment, new 3-Week Tight tab for Minervini SEPA coiling setups, and Near-Pivot watchlist alerts. v1.5.0 feature deep-dive.
When Trader and AI Advisor are both installed, a live signals bar appears in your analysis showing which of the 8 scans a stock qualifies for. Plus: background auto-refresh every 6 hours.
The TT column shows which stocks pass all 7 Minervini structural criteria simultaneously — including quality stocks Stage 2 misses due to its liquidity filter. Plus: SEPA Score (0–4) for structural quality ranking. v1.8.0 feature deep-dive. 40 flashcards.
The BRS tab ranks every scanned NSE stock 0–100 combining Trend Template, RS vs Nifty, Proximity to 52W High, Weinstein Stage, and Breakout Quality. Four tags: Breakout Ready (85+) · Setup Forming (70–84) · Early Stage (55–69) · Avoid. 35 flashcards.
The Volume tab fires when today’s volume is the highest in 63 days (HVQ), 252 days (HVY), or 2000 days (HVE) — on an up day with liquidity filters. HVE > HVY > HVQ. Pushes to the Picks webapp. 25 flashcards.
You do not need to be an active trader to find this useful. Finmagine Trader tells you which Indian stocks are in confirmed institutional uptrends, pressing 52-week highs, or forming pre-breakout setups — every morning, in seconds.
Narrow 150+ candidates to 4–8 high-conviction setups in under 5 minutes. Stack the Index, Score, MCap, and Tight Volatility filters to match your exact strategy — quality momentum, VCP sniper, large-cap breakout, or tightest coiling setups only.
Discover new quality stocks in confirmed Stage 2 uptrends with institutional backing. Check whether a stock you already hold is still in a healthy trend. Use the Stage 2 tab as a daily watchlist of names the market is currently rewarding.
Get a daily pulse on sector strength and market breadth. The All Three tab count alone is a useful market health indicator — without needing to read charts or run any scans yourself.
Clickable sector chips above every results table show stock counts per industry group. Tap a chip to filter to that sector instantly. Covers 1,000+ NSE stocks mapped to 56 industry groups — see which sectors are leading the momentum universe today.
Optional filter that applies ATR(14) < ATR(50) to the Near 52W High scan — showing only stocks where short-term volatility is contracting relative to recent history. The “coiling before breakout” pattern. Applies to Near High, Stage 2+Near High, and All Three. Off by default.
Today’s traded value (Volume × Price) shown in ₹ Cr for every stock. Sort by Turnover to assess liquidity before entry — instantly see which setups have institutional-grade traded value behind them.
After every data load, a toast notification alerts you if any stock in your watchlist is within 2% of its 52-week high. Your watchlist candidates, flagged automatically — no manual tab-switching needed.
Eleven pre-built views of the Indian momentum universe — from the broadest Stage 2 scan to the tightest All Three intersection, plus composite scoring, bottom momentum, and volume surge signals. Pick your conviction level and trade.
Stage 2 + Near 52W High + High Volume. Institutional buying confirmed on all three signals. The day's highest-conviction picks.
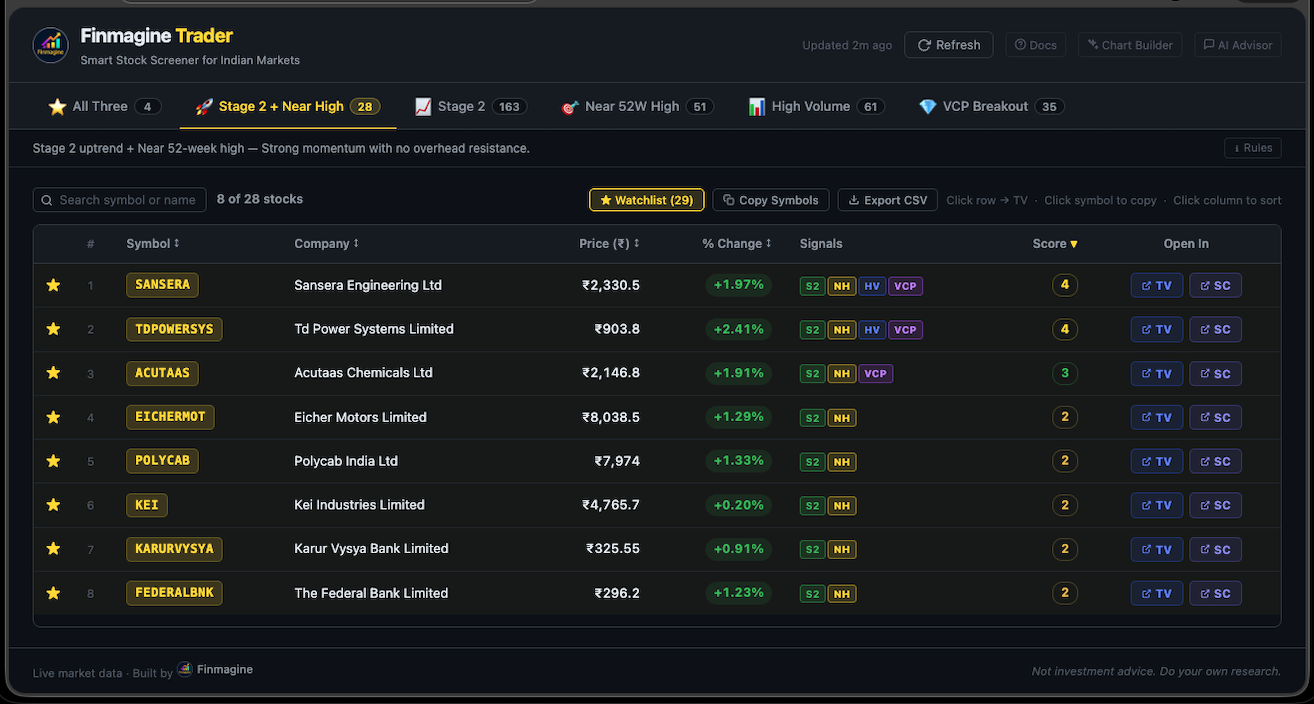
~6 stocks dailyStage 2 uptrend meets near 52-week high — no overhead resistance, price in discovery territory.
~36 stocks dailyFull Stage 2 universe: price above 150/200 SMA, SMAs rising and aligned, within 52-week high range.
~153 stocks dailyStocks within 2% of their 52-week high — no sellers above, breakout territory.
~59 stocks dailyVolume surging above 20-day average with positive price action. Institutional accumulation signal.
~62 stocks dailyMark Minervini's VCP pattern: small-cap (MCap ≤ ₹30K Cr), above 50/200 SMA, RSI > 50, no F&O overlay. Positional plays.
~32 stocks dailyMinervini SEPA pattern: 3 consecutive weekly closes within 1.5% of each other above SMA 50/200. Stocks coiling before an explosive breakout — the tightest setups in the Stage 2 universe.
~20 stocks dailyRecently listed stocks (no SMA-200) within 2% of their all-time high on above-average institutional volume. Zero overhead supply — pure price discovery territory.
0–5 stocks (rare signal)Breakout Readiness Score (0–100): composite of Trend Template (25), RS vs Nifty (25), 52W High Proximity (20), Weinstein Stage (20), Breakout Quality Bonus (10). Four tiers from Breakout Ready to Avoid.
Ranks all scanned stocksStocks in oversold territory starting to reverse: RSI recovering from below 30, price reclaiming SMA 50, volume confirming the turn. Contrarian momentum plays.
~15 stocks dailyFires when today’s volume is the highest in 63 days (HVQ), 252 days (HVY), or 2,000 days (HVE) — on an up day with liquidity filters. Three tiers of institutional accumulation evidence.
~5–30 stocks dailyFrom install to trade-ready list in 30 seconds.
Add Finmagine Trader to Chrome. Free, one click, no account required.
Click the extension icon from any tab. Data loads in seconds — no ChartInk setup needed.
Pick your strategy tab. Click TV to chart on TradingView, SC to research on Screener.in, or export the full list as CSV.
Built to surface fewer, better signals — for traders and investors alike.
Most scanners give you lists. Finmagine Trader gives you conviction. The Score system doesn't just count signals — it measures how many independent frameworks are simultaneously confirming the same thesis. A Score 4 stock is in a Stage 2 uptrend, near its 52-week high, on high volume, and in a VCP pattern. Four separate methods. One stock. That's the edge.
No ChartInk account, no scan codes, no daily copy-paste. Just open and trade.
TradingView and Screener.in links on every row. Chart, research, decide — without losing your place.
Copy all symbols or export as CSV. Paste directly into TradingView watchlists for bulk charting.
The Score measures confluence, not coincidence. A Score 4 stock has four independent frameworks confirming the same thesis — trend structure, overhead clearance, volume confirmation, and pattern compression. All at once.
Data cached for 15 minutes with automatic date-boundary reset. Always fresh, never slow.
Scan results are cached locally in your browser — your watchlist and trading decisions stay private. Stock fundamentals for Screener.in pages you visit are passively contributed to Finmagine's shared cache.
Restrict any scan to a specific quality universe: Nifty 50, Nifty 100, Nifty 200, or Nifty 500. The filter applies server-side at the ChartInk level — the count shown is always accurate for the selected index, not post-filtered. Combine with any tab for precision results.
Score filter (≥1 to =4) instantly surfaces only multi-signal conviction setups — no re-fetch needed. MCap filter (₹500 Cr to ₹50,000 Cr) controls the universe size. Stack both with the Index Filter to narrow 150+ candidates down to the 4–8 setups worth acting on.
ATR(14) < ATR(50) — a relative volatility contraction test that works across all Indian stocks regardless of absolute ATR%. Shows only stocks where recent price swings are narrowing: the pre-breakout coiling pattern. Off by default. Applies server-side to Near High, Stage 2+Near High, and All Three tabs.
These articles explain the investment logic behind each Finmagine Trader screener. From Stage 2 theory to VCP pattern mastery — understand the 'why' behind every signal.
Master the strategy behind the Stage 2 + Near High tab. Why buying all-time highs works, and how institutional money drives sustained breakouts.
Stage 2 Near 52W High 🔓 FreeThe 8-factor quantitative engine that ranks momentum stocks. Understand how the All Three intersection acts as a natural scoring system.
All Three Quantitative 🔓 FreeThe 7-filter Blue Line framework that the Stage 2 and High Volume screeners are built on. Essential reading for understanding the scan logic.
Stage 2 High Volume 🔒 PremiumMark Minervini's complete VCP framework with 11 conditions — the exact logic powering the 💎 VCP Breakout tab.
VCP Breakout Minervini 🔒 PremiumVCP and Darvas Box pattern theory — how to recognize the setup that precedes explosive breakouts before they happen.
VCP Breakout Pattern 🔒 PremiumThe 4-cycle accumulation theory that explains why Stage 2 stocks outperform. Smart money, volume signals, and market phases.
All Screeners Theory 🔒 PremiumHow institutional players hunt retail stop-losses — and how combining the Stage 2 + Near High filter reduces your exposure to false breakouts.
Risk Management Strategy 🔒 PremiumFinmagine Trader pairs naturally with our other free Chrome extensions — each solves a different part of the research workflow.
Free forever. No account required. Works entirely in your browser. Useful whether you trade or invest long-term.
Add to Chrome — It's FreeChrome browser required · For Indian stock markets (NSE) · Zero data collection
Already installed? See what each tab does →