🌟 Finmagine Portfolio Manager — Now on the Chrome Web Store
Multi-broker tracker: Indian & global stocks, MFs, ETFs • Decision Journal, History Chart, Corporate Actions • Free
🎙 Multimedia Learning Hub
XIRR vs P&L%, Newton-Raphson under the hood, N50/N500 Index Beat — 30 interactive flashcards
What You Will Learn
A +30% P&L% return held for 5 years is worth less than a +30% return held for 1.5 years. And both might still be worse than just buying a Nifty 500 index fund. This article breaks down the three columns in Finmagine Portfolio Manager that answer the hardest question in investing: are you actually adding value over the alternative?
- Why P&L% alone misleads
- What XIRR normalises
- When they tell different stories
- Cash flows and dates
- Newton-Raphson method
- Portfolio-level XIRR
- Your exact entry date as benchmark
- What beating N500 actually means
- Permanent cache architecture
- All 4 ACs, unified ₹
- The one honest number
- Shown in stats strip
Video Walkthrough — Coming Soon
A video walkthrough showing XIRR and Index Beat calculations with real holdings examples will be published here at launch.
Audio Deep Dive — Coming Soon
Podcast-style audio on XIRR as the ultimate return metric coming at launch.
Test Your Knowledge — 30 Flashcards
Click any card to reveal the answer.
Table of Contents
The P&L% Problem — When the Number Lies by Omission
P&L% is the most commonly displayed return metric in every portfolio tracker. It is also the most incomplete. Here is why:
You have two holdings both showing +28% P&L%. Congratulations. But:
- TITAN: Bought 18 months ago. +28% in 18 months.
- IREDA: Bought 4 years ago. +28% in 4 years.
These are wildly different outcomes. TITAN has compounded at roughly 22% annualised. IREDA has compounded at roughly 6.5% annualised. One has likely outperformed an index fund. The other almost certainly has not. P&L% shows the same number for both.
What XIRR Is and How It Works
XIRR stands for Extended Internal Rate of Return. It is the annualised discount rate that makes the net present value of a series of cash flows (at specific dates) equal to zero.
In simpler terms: it is the constant annual return rate that, applied to the timing of all your investments, would produce exactly the portfolio value you have today.
Cash Flows and Dates
For each holding, the extension treats your trades as follows:
| Cash Flow | Sign | Date | Example |
|---|---|---|---|
| Each buy trade (net cost) | Negative (outflow) | Purchase date | -₹1,80,000 on 15-Jan-2024 |
| Each additional buy trade | Negative | Purchase date | -₹95,000 on 10-Jun-2024 |
| Current market value (hypothetical sell) | Positive (inflow) | Today | +₹3,42,000 on today |
Given these three rows, XIRR solves: what annual return rate, compounded from each outflow date to today, produces the +₹3,42,000 terminal value from the ₹2,75,000 deployed across two dates? The answer is your XIRR.
The Newton-Raphson Method
XIRR has no closed-form algebraic solution for multiple cash flows. The extension uses the Newton-Raphson iterative method (implemented in js/xirr.js) to numerically converge on the solution. It starts with an initial guess (typically 10%), evaluates the net present value function and its derivative, and iteratively refines the estimate until the residual is below a precision threshold (0.000001).
This converges in 10–50 iterations for typical portfolios and is accurate to the same precision as Excel's XIRR function, which uses the same algorithm.
(Current Value / Cost) ^ (1/Years) - 1. Multiple trades at different dates require the full iterative calculation.
Reading XIRR Scores — What the Numbers Mean
Here is a reference for interpreting XIRR values in the context of Indian equity markets:
| XIRR Range | Grade | Context |
|---|---|---|
| Above 25% | Excellent | Significantly outperforming the market. Nifty 500 long-run CAGR is ~13–14%. 25%+ XIRR is strong outperformance — though verify it's sustained, not a short-term spike. |
| 18%–25% | Good | Meaningfully beating the broad market. Worth holding and adding to if the thesis is intact. |
| 10%–18% | Fair | Roughly in line with or slightly above index performance. The position is working but not generating strong alpha. |
| Below 10% | Poor | Likely underperforming an index fund on an annualised basis. This capital may have served you better elsewhere — check Index Beat to confirm. |
| Negative | Loss | The position has declined since purchase. A negative XIRR means you would have been better off holding cash. Check if a stop-loss has been missed. |
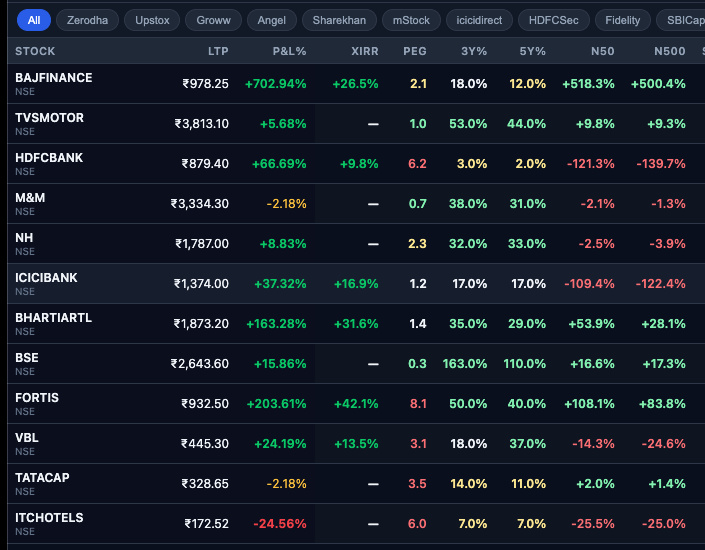
Here is the Holdings table with XIRR next to P&L% — notice how different the stories can be:
| Stock | Bought | P&L% | XIRR | Held | vs N500 | Signal |
|---|---|---|---|---|---|---|
| TITAN | 18 months ago | +28% | 21.8% | 18M | +8.4% | ✓ Alpha |
| IREDA | 4 years ago | +28% | 6.5% | 48M | -6.3% | ⚠ Lagging |
| HDFCBANK | 2.5 years ago | +11% | 4.3% | 30M | -9.8% | ⚠ Index lag |
| POLYCAB | 8 months ago | +38% | 68.2% | 8M | +24.1% | ✓ Strong alpha |
Same P&L% (+28%) but completely different quality of return. TITAN is generating alpha; IREDA is a capital trap. This is what the XIRR column makes visible.
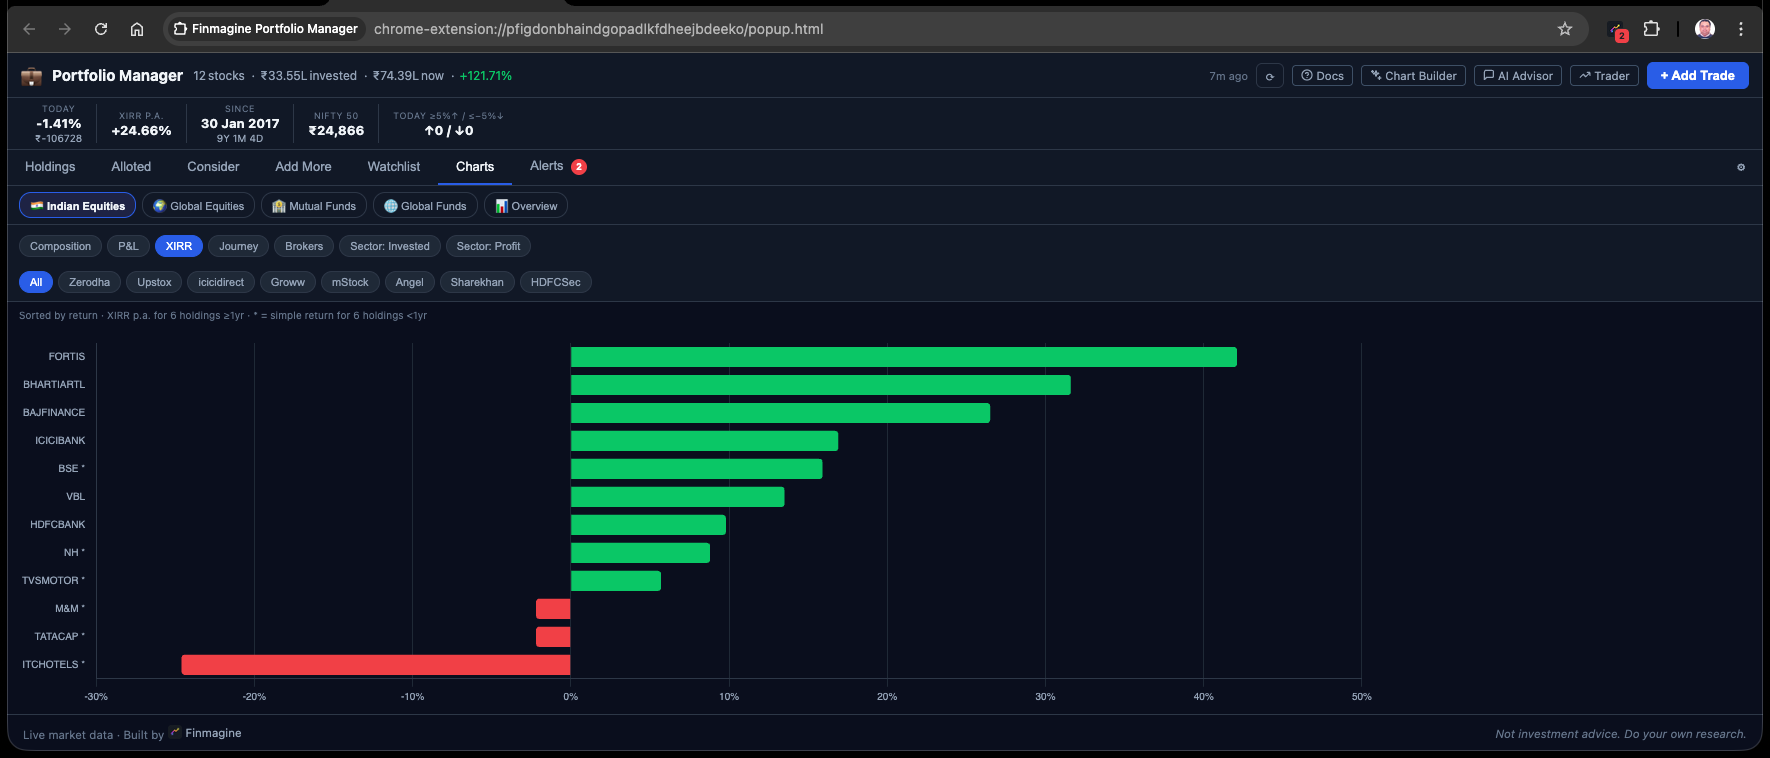
Index Beat (N50 / N500) — The Right Benchmark
Even an excellent XIRR doesn't tell the full story unless you compare it to what you would have earned by simply investing in an index fund on the same date. That is exactly what the N50 and N500 columns do.
Why Entry Date Matters
Consider this: you bought a stock in January 2020. Nifty 50 crashed 40% in March 2020 and recovered by December 2020. If someone asks "did you beat the Nifty?" they cannot use the Nifty's current level — they must use the Nifty level on your specific entry date.
Finmagine Portfolio Manager does this precisely. For each holding, it looks up the Nifty 50 and Nifty 500 closing price on the exact date of your earliest buy trade in that stock and computes the index return from that date to today. Your P&L% is then compared against this exact-entry-date benchmark.
| Stock | Entry Date | P&L% | N50 (same period) | N500 (same period) | Beat N500? |
|---|---|---|---|---|---|
| POLYCAB | Jul 2024 | +38% | +11.2% | +13.9% | +24.1pp ▲ |
| IREDA | Mar 2022 | +28% | +32.4% | +34.3% | -6.3pp ▼ |
| HDFCBANK | Oct 2023 | +11% | +19.6% | +20.8% | -9.8pp ▼ |
| TITAN | Sep 2024 | +28% | +17.3% | +19.6% | +8.4pp ▲ |
IREDA's +28% P&L% looks like a win. But the broad market returned +34.3% from the same entry date. You underperformed by 6.3 percentage points. You would have done better with an index fund. This is the honest truth that N500 surfaces.
The Permanent Cache Architecture
Index historical data is fetched once from Yahoo Finance (^NSEI for Nifty 50, ^CRSLDX for Nifty 500) and stored permanently in chrome.storage.local keyed by date. Once the Nifty level for a specific date is cached, it is never fetched again.
This means: your Index Beat calculations are instant after the first refresh. As your portfolio grows with older trades, only the new unique dates trigger a fetch. The cache effectively accumulates a complete Nifty price history over time.
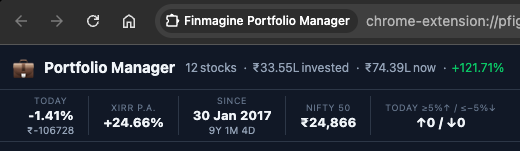
Portfolio XIRR — The One Honest Number
Individual XIRR tells you how each holding is performing. Portfolio XIRR tells you whether your overall strategy is working. It is shown in the stats strip at the top of the Holdings tab, updated on every price refresh.
The Portfolio XIRR is computed across all trades in all 4 asset classes. USD trades (GL_EQ and GL_MF) are converted to ₹ at the configured FX rate before the calculation, so every rupee deployed anywhere in your portfolio is treated equally.
What Portfolio XIRR Tells You
- Is your stock-picking adding value over index funds? If Portfolio XIRR < Nifty 500 CAGR over the same period, the honest answer is: probably not — your MF or ETF holdings might be doing better than your individual stock picks.
- Is your capital deployment strategy efficient? XIRR penalises large idle periods between deployments. If you held cash for 18 months before investing, Portfolio XIRR captures that drag.
- Is the whole better than the parts? Compare Portfolio XIRR to the highest individual XIRR holdings. If one stock has 68% XIRR and your portfolio has 14%, concentration elsewhere is dragging overall performance.
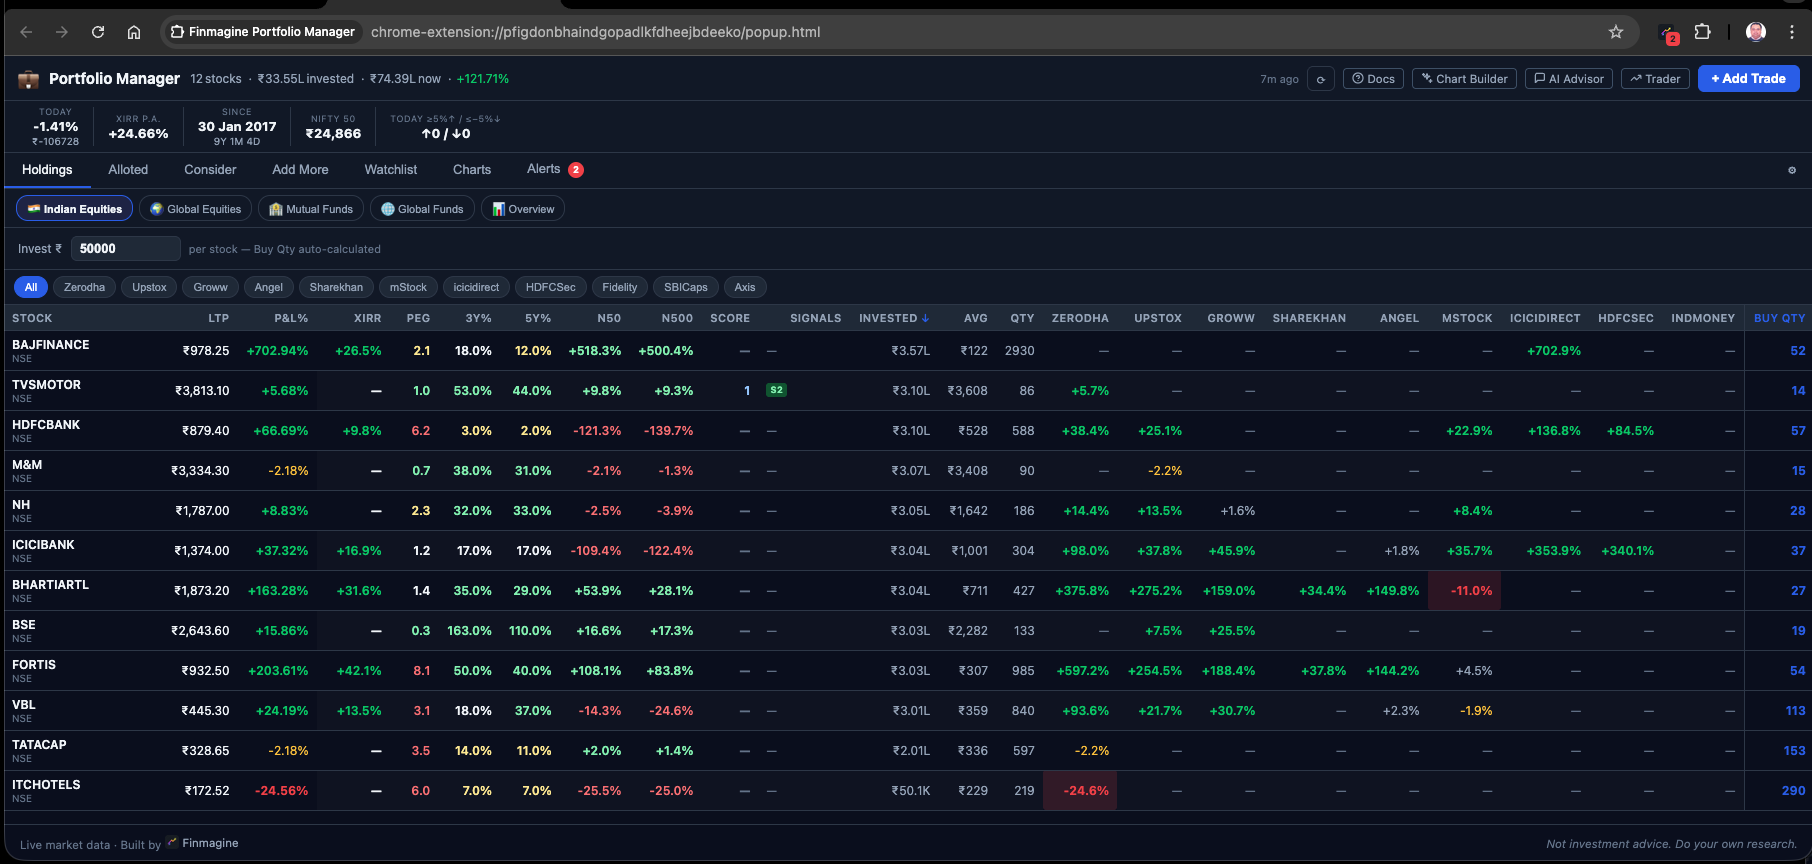
The Two-Column Sort Strategy
The Holdings table is fully sortable. The most powerful combination for identifying your best and worst allocations:
- Sort by XIRR descending — Your best-performing positions by annualised return rise to the top. These are your "do more of this" signals.
- Sort by N500 ascending — Your biggest underperformers vs the broad market sink to the bottom. These are your "should I be here?" audit questions.
Stocks in the bottom quartile by N500 (significantly lagging the index) AND below 10% XIRR are the ones worth scrutinising most carefully. They are costing you both relative and absolute returns. The P&L% column would never surface this combination — it could show them all as positive and "fine".
Finmagine Portfolio Manager — Article Series
📚 8-Article Series
- 1
- 2
- 3You are here: XIRR & Index Beat: Are You Really Beating the Market?
- 4
- 5
- 6
- 7
- 8
Finmagine Portfolio Manager
Per-broker stop-loss discipline, live prices, XIRR, Index Beat, Charts — for Indian Equities, US Stocks, Mutual Funds & Global ETFs. Local-first portfolio tracking, optional cloud backup.
Learn More about Portfolio Manager →