🌟 Finmagine Portfolio Manager — Now on the Chrome Web Store
Multi-broker tracker: Indian & global stocks, MFs, ETFs • Decision Journal, History Chart, Corporate Actions • Free
This article covers the Watchlist tab in depth — how it automatically includes your Holdings, the 23 fundamental columns it shows, the colour-coding system for instant screening, sortability, lazy loading, and how to use it as a decision-making tool before buying your next stock.
📑 In This Article
1. Why a Watchlist Needs More Than Just Price
Most stock watchlists do one thing: show you the current price and how much it has moved. This is useful for traders who are focused on entry timing. But for investors tracking fundamentals, it is almost useless.
When you are evaluating whether DMART deserves a place alongside ITC in your portfolio, or whether you should add more HDFC Bank relative to Kotak, you need to compare P/E ratios, return on equity, debt levels, operating margins, and promoter confidence — side by side, in a single view.
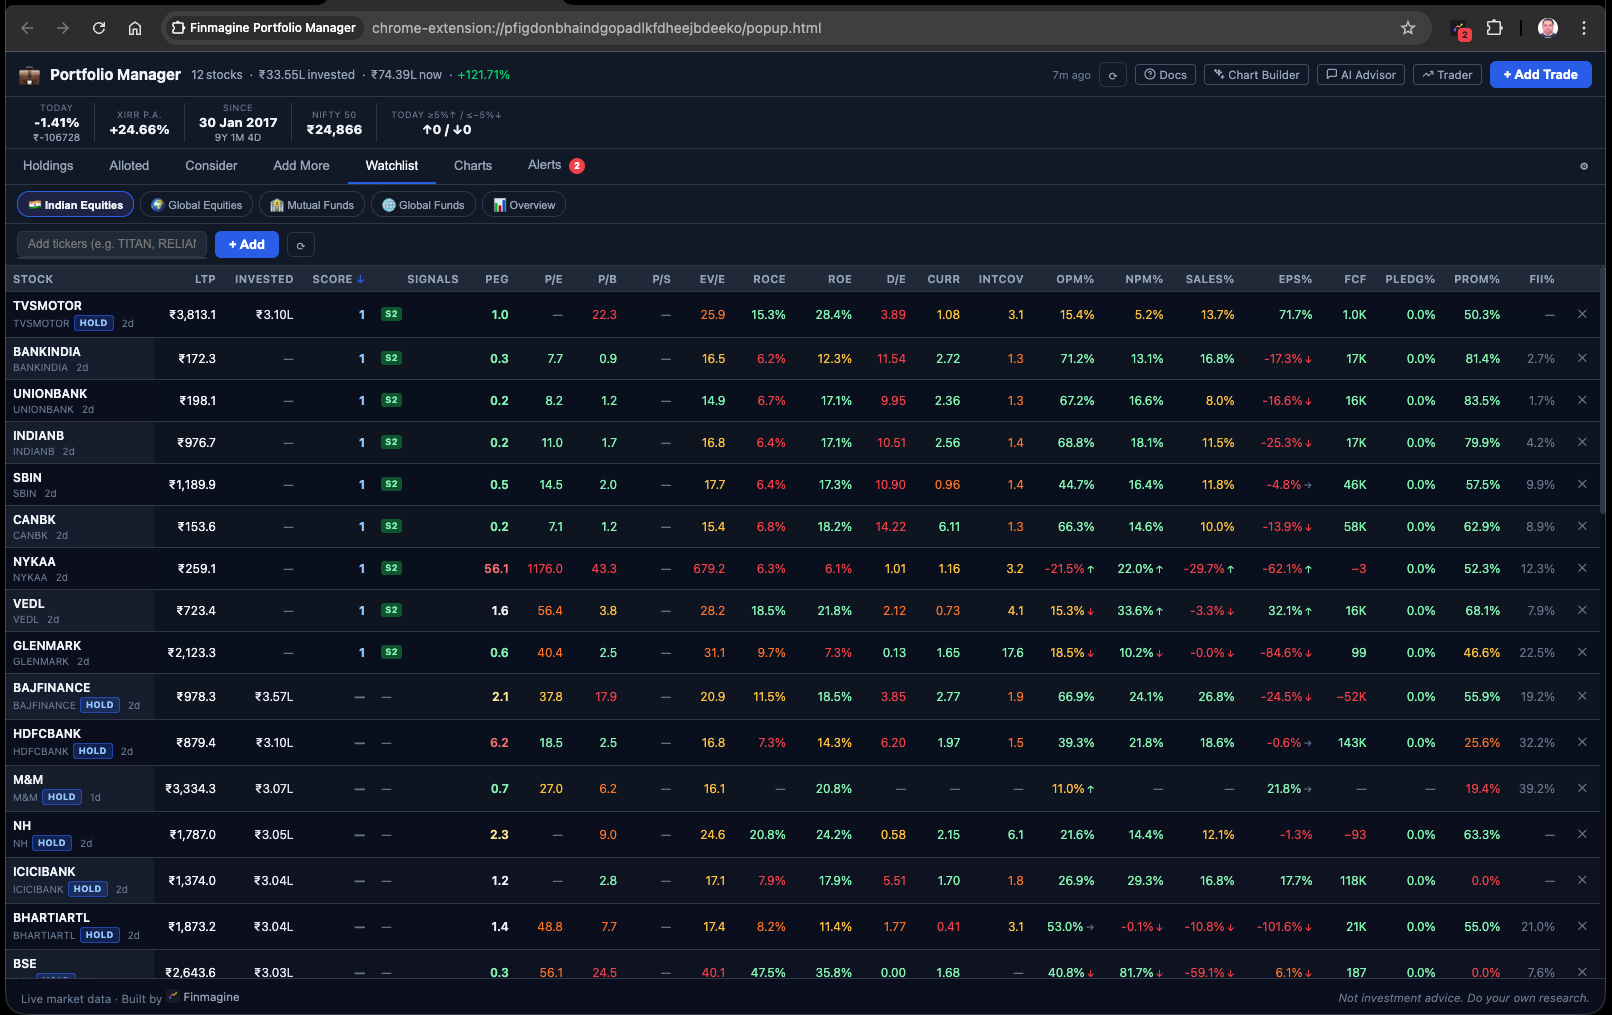
This is what the Watchlist tab in Finmagine Portfolio Manager is designed for. Instead of a price ticker, it is a fundamental comparison table that shows 23 data points per stock, all pulled from Screener.in and cached for 90 days so the extension stays fast.
The Watchlist tab is not a trading watchlist — it is a research shortlist. Its job is to help you decide which stocks deserve attention before you open their full Screener.in page or Finmagine report.
You can add any NSE-listed stock to the watchlist manually. Any stock you already hold in your portfolio is automatically included with a HOLD badge — so you can compare potential new additions directly against what you already own.
2. Holdings Auto-Included — The HOLD Badge
When you open the Watchlist tab, your current Holdings from all Indian asset classes (IN_EQ and IN_MF) are automatically added to the top of the list. These rows carry a HOLD badge in the Stock column so you can always tell which stocks you already own.
This matters for comparison. If you are considering buying TITAN and you already hold ITC and DMART, you want to see all three in the same table and ask: where is the quality highest? Where is the valuation most attractive?
What Auto-Include Does
- Holdings rows appear at the top with a HOLD badge
- Their fundamentals are fetched with the same 90-day cache as manually-added stocks
- Removing a stock from Holdings also removes the HOLD badge — but keeps it in the Watchlist if you added it manually
- The HOLD badge is read-only — you cannot delete a HOLD row from the Watchlist tab; manage Holdings in the Holdings tab instead
- Manual watchlist-only stocks (non-portfolio) have no LTP displayed — they show
—in P/B and P/S since those need the current price
The non-HOLD stocks are ones you have added manually by typing an NSE ticker in the Watchlist tab's add bar. These are your research candidates — stocks you are studying but do not yet own.
Resist the urge to add 50 stocks to the watchlist. The best use case is a shortlist of 5–15 names you are actively comparing against your existing Holdings. A focused watchlist is easier to act on.
3. The 23 Columns Explained
Each row in the Watchlist table contains 23 columns. Here is a complete reference, grouped by category:
Group 1: Identity & Price
| Column | What It Shows | Source |
|---|---|---|
| Stock | NSE ticker + HOLD badge if in portfolio | Stored locally |
| LTP | Last traded price (live via Yahoo Finance) | Yahoo Finance |
| Score | Finmagine composite score (0–100) | Computed from fundamentals |
| Signals | 5 ChartInk momentum signals (Stage 2, Near High, High Volume, VCP, IPO) | ChartInk (cached) |
Group 2: Valuation Ratios
| Column | What It Shows | Why It Matters |
|---|---|---|
| PEG | Price/Earnings-to-Growth ratio | Valuation relative to growth; PEG < 1 = potentially cheap |
| P/E | Price to Earnings (TTM) | Core valuation multiple; compare within sector |
| P/B | Price to Book value | Asset-heavy sectors; key for banks and NBFCs |
| P/S | Price to Sales (TTM revenue) | Useful when earnings are low or negative |
| EV/E | EV/EBITDA | Capital-structure-neutral valuation; good for debt-heavy companies |
Group 3: Profitability & Returns
| Column | What It Shows | Why It Matters |
|---|---|---|
| ROCE | Return on Capital Employed (%) | How efficiently total capital generates profit; >15% is good |
| ROE | Return on Equity (%) | Return on shareholder capital; >15% preferred |
| OPM% | Operating Profit Margin | Core business profitability; compare across peers |
| NPM% | Net Profit Margin | Bottom-line efficiency after all costs and taxes |
Group 4: Financial Health
| Column | What It Shows | Why It Matters |
|---|---|---|
| D/E | Debt to Equity ratio | Leverage; < 1 preferred for non-financials |
| CurR | Current Ratio | Short-term liquidity; > 1.5 is comfortable |
| IntCov | Interest Coverage ratio | How many times EBIT covers interest; > 3 is safe |
| FCF | Free Cash Flow (latest annual, ₹ Cr) | Cash after capex; positive FCF = self-funding business |
Group 5: Growth Rates
| Column | What It Shows | Why It Matters |
|---|---|---|
| Sales% | 3-year revenue CAGR (%) | Top-line momentum |
| EPS% | 3-year EPS CAGR (%) | Earnings growth quality |
Group 6: Ownership Quality
| Column | What It Shows | Why It Matters |
|---|---|---|
| Pledg% | Promoter shares pledged (%) | > 20% is a red flag; pledging signals cash stress |
| Prom% | Promoter holding (%) | Skin in the game; watch for consistent reduction |
| FII% | Foreign Institutional Investor holding (%) | Institutional confidence in the business |
| ✕ | Remove from watchlist button | Deletes manually-added rows (HOLD rows cannot be deleted here) |
Stock · LTP · Score · Signals · PEG · P/E · P/B · P/S · EV/E · ROCE · ROE · D/E · CurR · IntCov · OPM% · NPM% · Sales% · EPS% · FCF · Pledg% · Prom% · FII% · ✕
4. Colour-Coding: Green / Amber / Red Thresholds
Having 23 numbers per stock is only useful if you can read them quickly. The Watchlist tab applies colour-coded backgrounds to each cell based on predefined thresholds:
- Green — the metric is in a healthy range (e.g. ROCE > 15%, D/E < 0.5)
- Amber — the metric is marginal (e.g. ROCE 10–15%, D/E 0.5–1.0)
- Red — the metric is concerning (e.g. ROCE < 10%, Pledg% > 20%)
This means you can scan the entire table visually and immediately spot which stocks have a row of mostly green (strong fundamentals) vs a row with several red cells (structural weaknesses).
Sample Watchlist View
Here is how a 5-stock watchlist might look after fetching fundamentals:
| Finmagine Portfolio Manager — Watchlist Tab (Sample) | ||||||||||||||||||||||
| Stock | LTP | P/E | P/B | ROCE | ROE | D/E | OPM% | NPM% | FCF | Sales% | EPS% | Pledg% | Prom% | |||||||||
|---|---|---|---|---|---|---|---|---|---|---|---|---|---|---|---|---|---|---|---|---|---|---|
| HOLD TITAN | 3,442 | 87.4 | 35.2 | 44.1 | 38.7 | 0.1 | 11.3 | 8.2 | +2,840 | 21.4 | 19.8 | 0 | 52.9 | |||||||||
| HOLD ITC | 415 | 24.8 | 7.1 | 32.4 | 27.5 | 0.0 | 32.8 | 25.1 | +14,200 | 9.2 | 8.7 | 0 | 44.9 | |||||||||
| DMART | — | 88.1 | 12.9 | 18.2 | 16.4 | 0.2 | 8.4 | 5.2 | +1,420 | 15.6 | 22.3 | 0 | 74.9 | |||||||||
| ADANIENT | — | 62.4 | 9.8 | 11.4 | 7.8 | 3.4 | 20.1 | 4.8 | −2,100 | 28.4 | 31.2 | 0 | 72.6 | |||||||||
| PAGEIND | — | 55.6 | 28.3 | 48.2 | 51.7 | 0.1 | 21.4 | 15.3 | +890 | 8.1 | 7.4 | 0 | 59.7 | |||||||||
* DMART / ADANIENT / PAGEIND rows show LTP as — because they are watchlist-only (not held); P/B and P/S also show — for these rows.
Looking at this table, ADANIENT immediately stands out with red D/E, red FCF, and amber ROCE — despite strong revenue and EPS growth. PAGEIND has outstanding ROCE/ROE but expensive valuation multiples. TITAN has red valuation but green quality everywhere. This is the kind of instant multi-dimensional comparison the Watchlist is designed for.
— for LTP-derived metrics like P/B and P/S.The colour thresholds are set for general equity. Banks and NBFCs have different D/E norms, different FCF patterns, and P/B as a primary metric. For financial sector stocks, treat the red/amber on D/E and FCF as noise and focus on P/B, ROE, and NIM instead.
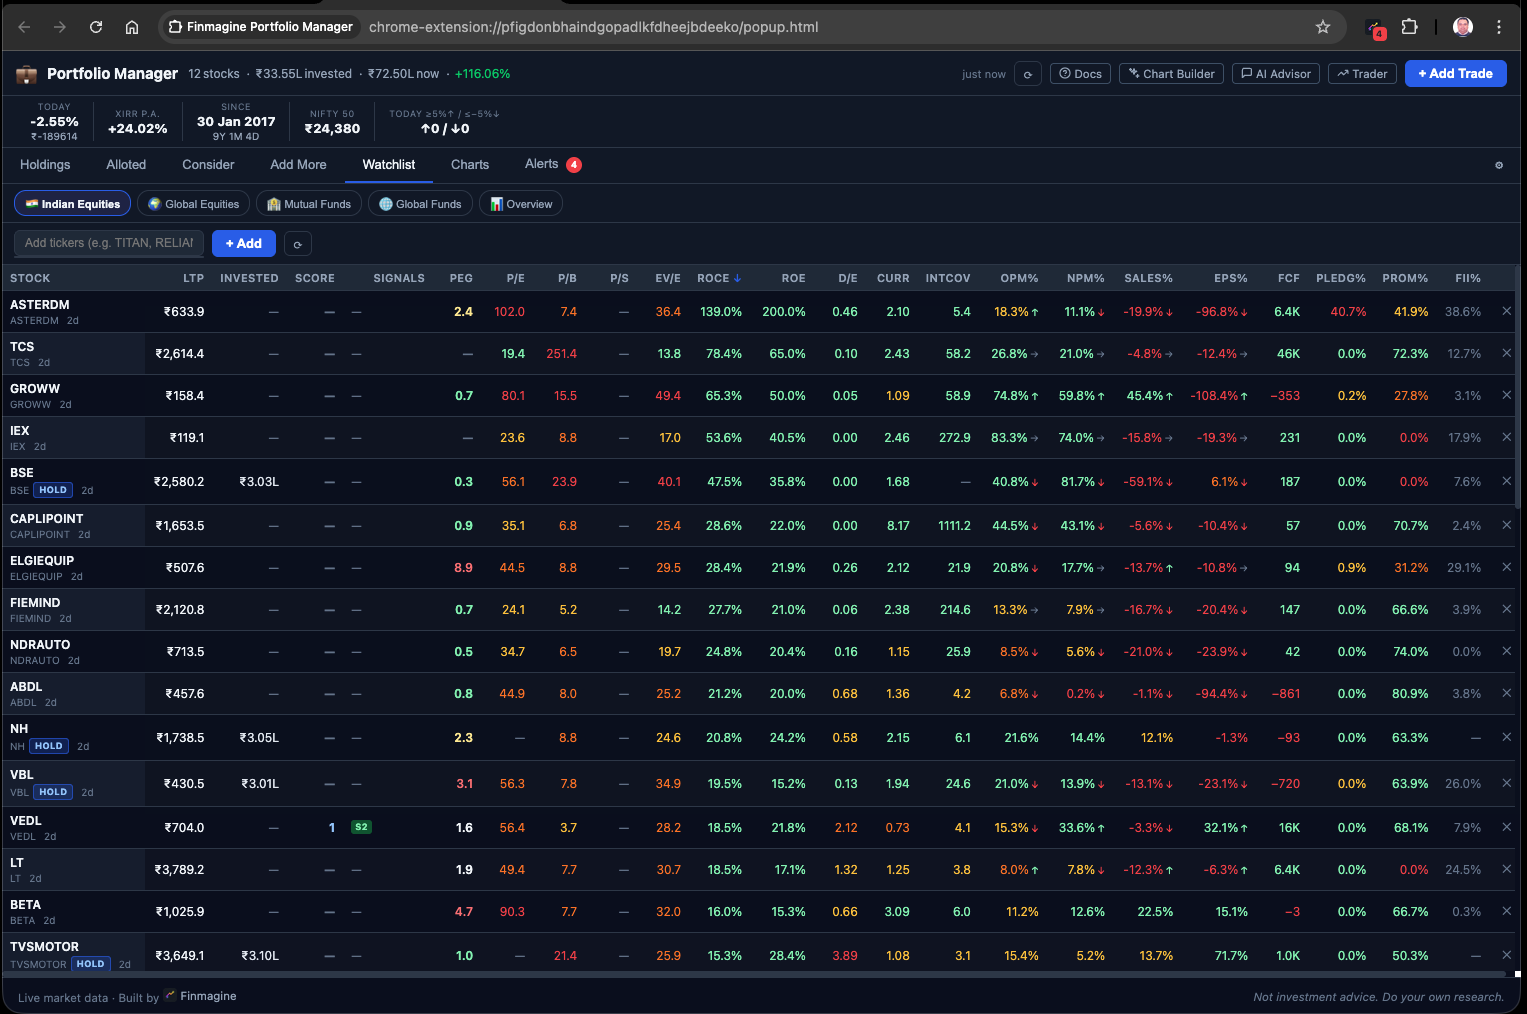
5. Sorting and Ranking Your Shortlist
Every column header in the Watchlist table is clickable — clicking it sorts the entire table by that column (ascending on first click, descending on second click). This turns the watchlist into a dynamic screener.
Practical Sort Strategies
Sort by ROCE (descending) — Find the Best Capital Allocators
Click ROCE and sort high-to-low. This surfaces companies that generate the most profit per unit of capital deployed. When ROCE consistently exceeds cost of capital, the business compounds shareholder value over time.
Sort by D/E (ascending) — Find the Financially Strongest
Sort D/E low-to-high to find companies with the least leverage. In a rising interest rate environment, these businesses are most insulated from financial stress.
Sort by EPS% (descending) — Find the Fastest-Growing
Sort by 3-year EPS CAGR to see which companies have grown profits fastest. Compare this with their P/E to see if the growth rate justifies the valuation.
Sort by Pledg% (descending) — Spot the Red Flags
Sort pledging high-to-low to immediately see which promoters have pledged significant shareholding. Any company with Pledg% above 30% warrants deeper investigation before investing.
Sort by P/E ascending (cheapest first), then visually scan ROCE to find cheap stocks that are also high-quality. This is essentially a manual PEG filter — low valuation + high returns = potential compounders trading at a discount.
6. Lazy Loading and the 90-Day Cache
Fetching 23 fundamental data points for each stock requires loading the full Screener.in page for that stock. If you had 15 stocks in your watchlist, that would mean 15 network requests every time you opened the extension — slow, and potentially throttled by Screener.
The Watchlist tab solves this with two mechanisms: lazy loading and long-duration caching.
Lazy Loading
When you open the Watchlist tab, the table renders immediately with whatever cached data is available. Stocks that have no cached data yet show a loading spinner in their row. The extension fetches their Screener.in data in the background, one by one, and fills in the cells as each fetch completes.
You do not need to wait for all stocks to load before you can see the ones that are already cached.
90-Day Fundamental Cache
Once a stock's fundamentals are fetched, they are stored in chrome.storage.local with a 90-day expiry timestamp. Most financial ratios — ROCE, ROE, margins, D/E — are reported quarterly or annually and do not change significantly day-to-day. A 90-day cache is a sensible balance between freshness and performance.
Cache Architecture
- LTP (live price): Not cached — fetched fresh every time via Yahoo Finance
- Signals (ChartInk): Short-duration cache (minutes to hours)
- Fundamentals (Screener.in): 90-day cache — most stable data
- CAGR %: 90-day cache — changes only quarterly with new results
- PEG: 24-hour cache — more price-sensitive than pure fundamentals
The Refresh Button
The Watchlist tab has a ⟳ refresh button. Clicking it triggers a fresh Screener.in fetch for all watchlist stocks regardless of cache age. Use this after a quarterly result season to pick up updated margins, ROCE, and EPS growth figures.
Stocks that are in the watchlist but not in your Holdings do not have a live price. This means P/B and P/S — which require current market cap — will show — for those rows. To see live price-dependent metrics, you need to hold the stock. This is a known limitation of the current version.
7. A Practical Watchlist Workflow
Here is how to integrate the Watchlist tab into a weekly or monthly research routine:
Step 1: Build Your Initial Shortlist
Identify 10–15 companies that appear in screens you trust — Finmagine Rankings, Screener screeners, or analyst recommendations. Add their NSE tickers to the Watchlist. Your Holdings are already there automatically with HOLD badges.
Step 2: Let It Load (Once)
The first time you open the Watchlist after adding stocks, it fetches fundamentals from Screener.in. This takes 20–30 seconds depending on the number of stocks and your internet speed. After that, it uses the 90-day cache, so subsequent opens are instant.
Step 3: Sort and Identify Candidates
Sort by ROCE descending. Note the top 5. Sort by D/E ascending. Note which stocks appear in both lists. These are your highest-quality businesses with the strongest balance sheets — the best long-term candidates.
Step 4: Compare Valuations
For your quality candidates, look at P/E and PEG. Is the current price justified by growth? Sort by EPS% descending and check whether the P/E is proportionate to that growth rate.
Step 5: Check for Red Flags
Sort by Pledg% descending and D/E descending. Any company with both high pledging and high debt warrants removal from your shortlist unless you have a specific thesis.
Step 6: Make the Decision
Your shortlist should now have 3–5 stocks that score well across ROCE, ROE, margins, debt, and have acceptable valuations. Check their Holdings tab entries (if you own any) — are they in the Alloted or Add More tabs? Use those signals alongside the Watchlist comparison to make your final call.
After each quarter's result season (April, July, October, January), hit the Watchlist ⟳ refresh button to pick up new ROCE, margins, and EPS% figures. The 90-day cache means these are the most-stale data points in your table, and quarterly results can shift them significantly — especially for companies in a turnaround.
Watchlist identifies quality candidates → Holdings tab confirms position sizing → Alloted/Consider/Add More tabs determine entry discipline → Alerts tab monitors stop-loss levels. The Watchlist is the starting point of the investment decision process, not the end.
🃏 Key Concepts — Flashcard Review
Click any card to reveal the answer. Use these to reinforce the main concepts from this article.
📚 Finmagine Portfolio Manager — Article Series
Finmagine Portfolio Manager
Per-broker stop-loss discipline, live prices, XIRR, Index Beat, Charts — for Indian Equities, US Stocks, Mutual Funds & Global ETFs. Local-first portfolio tracking, optional cloud backup.
Learn More about Portfolio Manager →