🌟 Finmagine Portfolio Manager — Now on the Chrome Web Store
Multi-broker tracker: Indian & global stocks, MFs, ETFs • Decision Journal, History Chart, Corporate Actions • Free
🎙 Multimedia Learning Hub
Learning overview and 25 technical flashcards covering the architecture, tax model, and WebApp portability of the Backtest engine
What You Will Learn
This article is a technical deep-dive into how the Finmagine Portfolio Manager Backtest engine is built. You will understand why simulate.js is a pure IIFE with zero Chrome API dependencies, how the FIFO/HIFO lot selection algorithms work, how Indian capital gains tax is modelled to the rupee, and how the engine is designed to run identically in a Chrome extension and a PHP-backed WebApp.
Core Concepts Covered:
- Why zero Chrome API deps
- Module pattern rationale
- Simulator.run() contract
- LTCG/STCG classification
- ₹1.25L FY exemption tracking
- FIFO vs HIFO lot selection
- 4 independent clones
- Monthly simulation loop
- NAV normalization to ₹1,000
- Same engine, different transport
- api/dispatch.php as Yahoo proxy
- CSP compliance patterns
🎥 Video Guide — Coming Soon
A video walkthrough of the simulate.js architecture — including the IIFE pattern, shadow portfolio mechanics, and WebApp portability design — is in production. Check back soon.
Visit Portfolio Manager Hub🎧 Audio Deep Dive — Coming Soon
An audio deep dive covering the full simulate.js architecture teardown — zero-dependency design, four shadow portfolios, FIFO/HIFO implementation, India tax model, and WebApp porting strategy — is being produced.
Join WhatsApp CommunityTest Your Knowledge — 25 Technical Flashcards
This article includes 25 technical Q&A flashcards covering the key architectural decisions and implementation details — from the IIFE module pattern to FIFO/HIFO implementation to CSP compliance. Jump to the flashcard section below.
📚 Finmagine Portfolio Manager — Complete Article Series
- 1 Introducing Finmagine Portfolio Manager
- 2 Per-Broker Stop-Loss
- 3 XIRR & Index Beat
- 4 Charts & Visual Analytics
- 5 Watchlist as Research Dashboard
- 6 Multi-Asset Tracking
- 7 The Decision Journal
- 8 v1.1.0 Update
- 9 Backtest Guide
- 10 Inside the Backtest Engine (this article)
1. Design Philosophy — Why simulate.js Is a Pure IIFE
When we sat down to design the Backtest tab for Finmagine Portfolio Manager, we made a decision that shaped every subsequent architectural choice: the simulation engine would have zero dependencies on Chrome extension APIs. No chrome.storage. No chrome.runtime. No chrome.tabs. Not a single call into the browser extension layer.
This was not the path of least resistance. The easy path would have been to write the simulation function directly inside app.js, pulling live data from chrome.storage.local and pushing results into the DOM — the same pattern used everywhere else in the extension. But that easy path creates a trap: the code becomes inseparable from the extension runtime. You cannot test it in isolation. You cannot reuse it in a web application. You cannot even reason about it without loading the full extension.
The WebApp portability requirement was the forcing function. The Finmagine Premium WebApp — planned as a web-based version of the Portfolio Manager — cannot use Chrome extension APIs. It will run in an ordinary browser tab, served from PHP, reading data from MySQL via portfolio-sync.php. For the Backtest tab to work identically in both environments, the simulation logic had to be completely decoupled from the transport layer.
simulate.js exposes exactly one public function — Simulator.run(config, trades, histPrices). It takes plain JavaScript objects as inputs and returns plain JavaScript objects as output. It performs no I/O, touches no DOM, and calls no browser APIs. Given identical inputs, it always produces identical output. This makes it trivially testable and unconditionally portable.
The Module Pattern
The engine is implemented as an Immediately Invoked Function Expression (IIFE) that assigns to a global variable:
const Simulator = (() => {
    'use strict';

    // All internal helpers are private to this closure
    function cloneLots(lots) { ... }
    function monthRange(startYM, endYM) { ... }
    function nearestPrice(histPrices, ticker, ym) { ... }
    function portfolioValue(lots, ym, histPrices) { ... }
    function maxDeviation(lots, tickers, normW, histPrices, ym) { ... }
    function sortedLotIdx(lotList, method) { ... }
    function taxYear(ym) { ... }
    function gainTax(gain, buyDateStr, sellYM, ltcgUsedThisYear) { ... }
    function rebalance(lots, tickers, normW, histPrices, ym, noTax, taxState) { ... }

    // The one public function
    function run(config, trades, histPrices) { ... }

    return { run };
})();
The IIFE pattern accomplishes three things simultaneously. First, it creates a private scope — none of the internal helpers are accessible to external code, preventing accidental misuse. Second, it assigns a stable global name Simulator that any HTML page can reference after a simple <script src="simulate.js"> tag, with no module bundler required. Third, it signals to every future developer that this file is self-contained — if you see a chrome.* call in a PR touching this file, that is a regression and should be rejected.
Compare this to the alternative approach, which we explicitly decided against. Mixing business logic and Chrome API calls in a single function produces code that cannot be extracted, tested, or reused. The simulation would be permanently welded to the extension runtime. Every future developer who wants to test a tax calculation edge case would need to spin up an unpacked extension, navigate to the Simulate tab, configure a portfolio, and trigger a run — instead of simply calling Simulator.run(testConfig, testTrades, testPrices) in a browser console.
The charts.js file in the extension follows the same IIFE pattern for the same reasons. Any rendering logic that might eventually be reused in the WebApp is isolated from Chrome dependencies. This is a project-wide architectural convention, not an accident of a single file.
Simulator.run() engine described in this article.2. The Input Contract — What Simulator.run() Accepts
Understanding the exact shape of each parameter is essential for both using the engine and porting it to new environments. The three inputs represent a complete, self-sufficient description of the simulation problem.
The config Object
The config object contains all user-specified simulation parameters:
const config = {
    startYM: '2021-04',          // YYYY-MM — the simulation start month
    thresholdPct: 10,            // number — rebalance when any position drifts by this many pp
    lotMethod: 'fifo',           // 'fifo' | 'hifo' — lot selection method for sells
    limitedHistoryBehavior: 'exclude',  // 'exclude' | 'available' — how to handle
                                         // tickers whose Yahoo data starts after startYM
    targetWeights: {             // object — desired allocation fractions (should sum to ~1)
        'HDFCBANK': 0.25,
        'INFY':     0.20,
        'RELIANCE': 0.20,
        'TITAN':    0.15,
        'BAJFINANCE': 0.20
    }
};
startYM is the month from which the simulation begins. The engine will use the actual market prices at this month for the initial portfolio valuation. Trades made after this date are excluded — the simulation assumes a fixed portfolio constructed from your historical trades up to and including this month.
thresholdPct controls how much a position can drift before triggering a rebalance in the threshold scenarios. A value of 10 means: if any ticker's actual allocation deviates more than 10 percentage points from its target weight, a rebalance occurs at the next quarter-end. Setting this to 0 forces a rebalance every quarter regardless of drift — equivalent to pure calendar rebalancing.
lotMethod determines which lots are sold first. 'fifo' (First In, First Out) sells the oldest lots first — the default method, which is also what most brokers do by default and what the tax department assumes unless you specify otherwise. 'hifo' (Highest In, First Out) sells the lots with the highest purchase price first, which maximizes the cost basis of each sell and minimizes realized gains — a tax-optimization strategy.
limitedHistoryBehavior handles the common situation where a ticker in your portfolio doesn't have price history going back to startYM. If set to 'exclude', that ticker is dropped from the simulation entirely and the remaining weights are renormalized to sum to 1. If set to 'available', the ticker is included using whatever history is available, which means the simulation uses a smaller portfolio in the early months and grows to include that ticker once its data begins.
targetWeights is the desired long-term allocation. The values should ideally sum to 1.0, but the engine renormalizes them after handling exclusions, so slight floating-point imprecision is tolerated. Tickers with zero weight are treated as "observe only" — they appear in the history chart but are not rebalanced into.
The trades Array
The trades array is the raw buy transaction history from chrome.storage.local. Each trade object looks like:
{
    ticker:          'HDFCBANK',     // NSE ticker symbol
    date:            '2021-03-15',   // ISO date string — actual purchase date
    netCostPerShare: 1450.50,        // number — cost basis per share including brokerage
    qty:             10,             // number — shares purchased
    assetClass:      'IN_EQ'         // only IN_EQ trades are used by the engine
}
The engine filters this array to only use trades where assetClass === 'IN_EQ' and where the trade date falls on or before startYM. The date comparison uses the YYYY-MM prefix: a trade on 2021-04-05 is included if startYM is '2021-04' or later. Trades after the start month are excluded because the simulation treats the portfolio as fixed — we want to answer "how would this portfolio have performed under different rebalancing strategies", not "how would a growing portfolio have performed".
Only buy trades appear in the trades array. Sells in the extension's trade history are tracked separately and reflected in the lot structure through the Holdings tab's lot management. The simulation does not need sell history — it manages sells internally as part of the rebalancing process.
The histPrices Object
The historical prices object is a two-level map: ticker at the outer level, YYYY-MM month at the inner level, monthly closing price as the value:
{
    'HDFCBANK': {
        '2021-01': 1389.45,
        '2021-02': 1453.20,
        '2021-03': 1468.70,
        // ... through current month
    },
    'INFY': {
        '2021-01': 1279.60,
        // ...
    }
}
These are Yahoo Finance monthly closing prices fetched by the FETCH_HISTORY_PRICES background message. Because the data comes from Yahoo's monthly API endpoint, each entry represents the last trading day close price for that calendar month. This is the same dataset used by the History tab's portfolio chart, so the infrastructure was already in place before the Backtest tab was built.
3. Data Preparation — Tickers, Exclusions, and Weight Normalization
Before the monthly simulation loop can begin, the engine performs a sequence of preprocessing steps to build a clean, self-consistent dataset. Each step eliminates a class of edge cases that would otherwise corrupt the simulation results.
Step 1: Filter Trades to IN_EQ and Within Start Date
const finalTrades = trades.filter(t =>
    t.assetClass === 'IN_EQ' &&
    t.ticker in config.targetWeights &&
    config.targetWeights[t.ticker] > 0 &&
    t.date.slice(0, 7) <= config.startYM
);
Three conditions work together here. First, only Indian equities are simulated — the engine doesn't attempt to simulate mutual funds or global equities with the same rebalancing model. Second, only tickers that appear in targetWeights with a positive weight are included. Tickers in your trade history that you've removed from your target allocation are excluded. Third, only trades up to and including the start month are used — future trades do not exist at the simulation start date.
Step 2: Check Historical Data Availability
const targetTickers = Object.keys(config.targetWeights)
    .filter(t => config.targetWeights[t] > 0);

const usableTickers = targetTickers.filter(ticker => {
    if (!histPrices[ticker]) return false;
    const months = Object.keys(histPrices[ticker]).sort();
    if (!months.length) return false;
    const earliestAvail = months[0];
    if (earliestAvail > config.startYM) {
        // Data starts after simulation start
        return config.limitedHistoryBehavior === 'available';
    }
    return true;
});
This step catches tickers that either have no Yahoo Finance data at all (newly listed stocks, or tickers where the fetch failed) or whose earliest available data point is after the simulation's start month. For example, if you want to start a simulation in 2020-01 but one of your holdings was listed in 2022, that ticker literally has no price data for most of the simulation period.
When limitedHistoryBehavior is 'available', the ticker is included and the engine uses nearestPrice(), which looks backward up to 3 months for the nearest available price. Months before any data is available will return null, effectively treating the position as having zero value during those early months. When limitedHistoryBehavior is 'exclude', the ticker is simply dropped and the simulation proceeds with the remaining tickers only.
Step 3: Renormalize Target Weights
const wSum = usableTickers.reduce((s, t) => s + config.targetWeights[t], 0);
const normW = {};
usableTickers.forEach(t => {
    normW[t] = config.targetWeights[t] / wSum;
});
After exclusions, the remaining weights may no longer sum to 1. A 5-ticker portfolio with weights [0.25, 0.20, 0.20, 0.15, 0.20] that loses one ticker at 0.20 now has weights summing to 0.80. The renormalization divides each remaining weight by 0.80, producing [0.3125, 0.25, 0.25, 0.1875] — a new set of weights that sum exactly to 1. This is critical: the rebalance function allocates 100% of portfolio value to the normalized weights. If weights don't sum to 1, the rebalance would systematically hold or spend cash that doesn't exist.
Step 4: Build Initial Lots
const initialLots = {};
usableTickers.forEach(t => { initialLots[t] = []; });
finalTrades.forEach(trade => {
    if (!(trade.ticker in initialLots)) return;
    initialLots[trade.ticker].push({
        date:     trade.date,
        buyPrice: trade.netCostPerShare,
        qty:      trade.qty
    });
});
The initial lots structure groups all buy transactions by ticker. Each lot has three fields: the purchase date (used for LTCG vs STCG determination), the cost basis per share (used to compute gains), and the quantity (which will be mutated during rebalancing sells). This structure is then deep-cloned four times to create the four independent shadow portfolios.
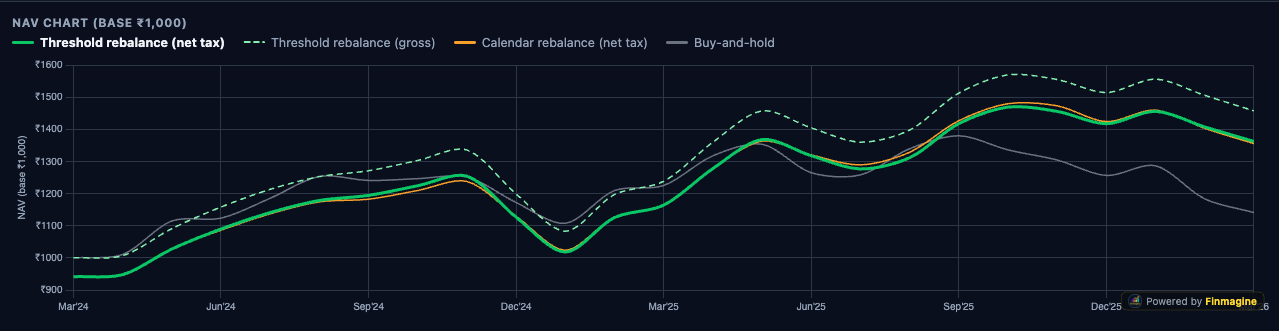
4. The Four Shadow Portfolios — The Core Architectural Pattern
The most important structural decision in the entire engine is the shadow portfolio pattern. Rather than running four separate simulations sequentially, the engine maintains four independent lot structures simultaneously and steps them all forward through the same monthly loop. This means a single pass through time produces all four scenario results.
The Four Scenarios
- holdLots — The "do nothing" baseline. No rebalancing ever occurs. The portfolio drifts freely based on market movements. This shows what your actual buy-and-hold returns would have been.
- threshNetLots — Threshold rebalancing with full India tax applied. Rebalances only when drift exceeds
thresholdPct, and the tax cost of each sell reduces available cash for reinvestment. - threshGrossLots — Threshold rebalancing with zero tax. The same rebalance triggers, but all sell proceeds are fully reinvested. This isolates the pre-tax benefit of rebalancing.
- calNetLots — Calendar rebalancing with full tax. Rebalances every quarter-end regardless of drift. This is the most disciplined and most tax-intensive scenario.
Why Deep Clone?
function cloneLots(lots) {
    const clone = {};
    for (const ticker in lots) {
        clone[ticker] = lots[ticker].map(l => ({ ...l }));
    }
    return clone;
}

// Four independent shadow portfolios from one initial state
const holdLots        = cloneLots(initialLots);
const threshNetLots   = cloneLots(initialLots);
const threshGrossLots = cloneLots(initialLots);
const calNetLots      = cloneLots(initialLots);
The clone operation uses lots[ticker].map(l => ({ ...l })). The outer loop creates a new object at the ticker level. The .map() creates a new array for each ticker. The { ...l } spread creates a new object for each individual lot. This is a full deep copy of the structure — no shared references exist between any two shadow portfolios after this point.
Why does this matter? Consider what the rebalance function does: it calls lots[ticker][i].qty -= take. This is direct mutation of the lot object in place. If holdLots and threshNetLots shared the same lot objects (a shallow copy), reducing the quantity in one scenario would silently corrupt the other. The simulation would produce results that appear plausible but are fundamentally wrong — the buy-and-hold baseline would lose shares every time the threshold scenario rebalances.
The { ...l } spread is sufficient here because all lot fields (date, buyPrice, qty) are primitives — strings and numbers. There are no nested objects within a lot. This means a shallow spread of the lot object produces an independent copy with no shared references. If lots ever grew to contain nested objects (e.g., a metadata sub-object), a deeper clone would be required.
Separate Tax States
Two of the four scenarios apply tax: threshNetLots and calNetLots. Each gets its own taxState dictionary, keyed by India tax year (April to March):
const taxStateThresh = {};   // for threshNetLots
const taxStateCal    = {};   // for calNetLots
The tax state tracks cumulative LTCG gains realized within each tax year, enabling the ₹1.25 lakh annual exemption to be correctly applied across multiple rebalancing events within the same year. Without separate tax states, the exemption applied in a threshold rebalance event would incorrectly reduce the exemption available in a calendar rebalance event — the two scenarios are independent simulations and must not share state.
5. The Monthly Loop — Stepping Through Time
With four independent shadow portfolios initialized, the engine steps forward month by month from startYM to the current month. The monthRange() generator function produces a sequence of YYYY-MM strings in chronological order.
function* monthRange(startYM, endYM) {
    let [y, m] = startYM.split('-').map(Number);
    const [ey, em] = endYM.split('-').map(Number);
    while (y < ey || (y === ey && m <= em)) {
        yield `${y}-${String(m).padStart(2,'0')}`;
        m++;
        if (m > 12) { m = 1; y++; }
    }
}
Using a generator here is a clean choice: the month sequence is produced lazily, one value at a time, without allocating an array of potentially hundreds of strings. For a 5-year simulation, the loop runs 60 iterations — negligible regardless. But the generator pattern also makes the loop body extremely readable: for (const ym of monthRange(startYM, nowYM)) reads exactly like English.
Quarter-End Detection
function isQuarterEnd(ym) {
    const m = parseInt(ym.slice(5, 7));
    return [3, 6, 9, 12].includes(m);
}
Rebalancing events only occur at calendar quarter-ends: March, June, September, and December. This is a deliberate design choice that mirrors realistic institutional rebalancing practice. Monthly rebalancing would generate excessive transaction volume and tax events. Annual rebalancing is too infrequent to catch meaningful drift. Quarterly strikes a balance between discipline and practicality, with at most 4 rebalancing events per year per scenario.
The Monthly Loop Body
const holdLine        = [];
const threshNetLine   = [];
const threshGrossLine = [];
const calNetLine      = [];

let startPortVal = null;

for (const ym of monthRange(startYM, nowYM)) {
    // Initialize startPortVal on first iteration
    if (startPortVal === null) {
        startPortVal = portfolioValue(initialLots, ym, histPrices);
        if (startPortVal <= 0) startPortVal = 1; // guard against zero
    }

    if (isQuarterEnd(ym)) {
        // Threshold scenarios: check drift first
        const dev = maxDeviation(threshNetLots, usableTickers, normW, histPrices, ym);
        if (dev >= config.thresholdPct) {
            rebalance(threshNetLots,   usableTickers, normW, histPrices, ym, false, taxStateThresh);
            rebalance(threshGrossLots, usableTickers, normW, histPrices, ym, true,  null);
        }
        // Calendar scenario: always rebalances at quarter-end
        rebalance(calNetLots, usableTickers, normW, histPrices, ym, false, taxStateCal);
    }

    // Record NAV for all four scenarios
    const nav = v => v > 0 ? +(v / startPortVal * 1000).toFixed(2) : null;
    holdLine.push(nav(portfolioValue(holdLots,        ym, histPrices)));
    threshNetLine.push(nav(portfolioValue(threshNetLots,   ym, histPrices)));
    threshGrossLine.push(nav(portfolioValue(threshGrossLots, ym, histPrices)));
    calNetLine.push(nav(portfolioValue(calNetLots,    ym, histPrices)));
}
Several subtleties are worth examining here. The threshGrossLots scenario passes null as taxState because it never applies tax — the noTax=true flag ensures the rebalance function skips all tax calculations entirely. Passing null is safe because the rebalance function only touches taxState when noTax is false.
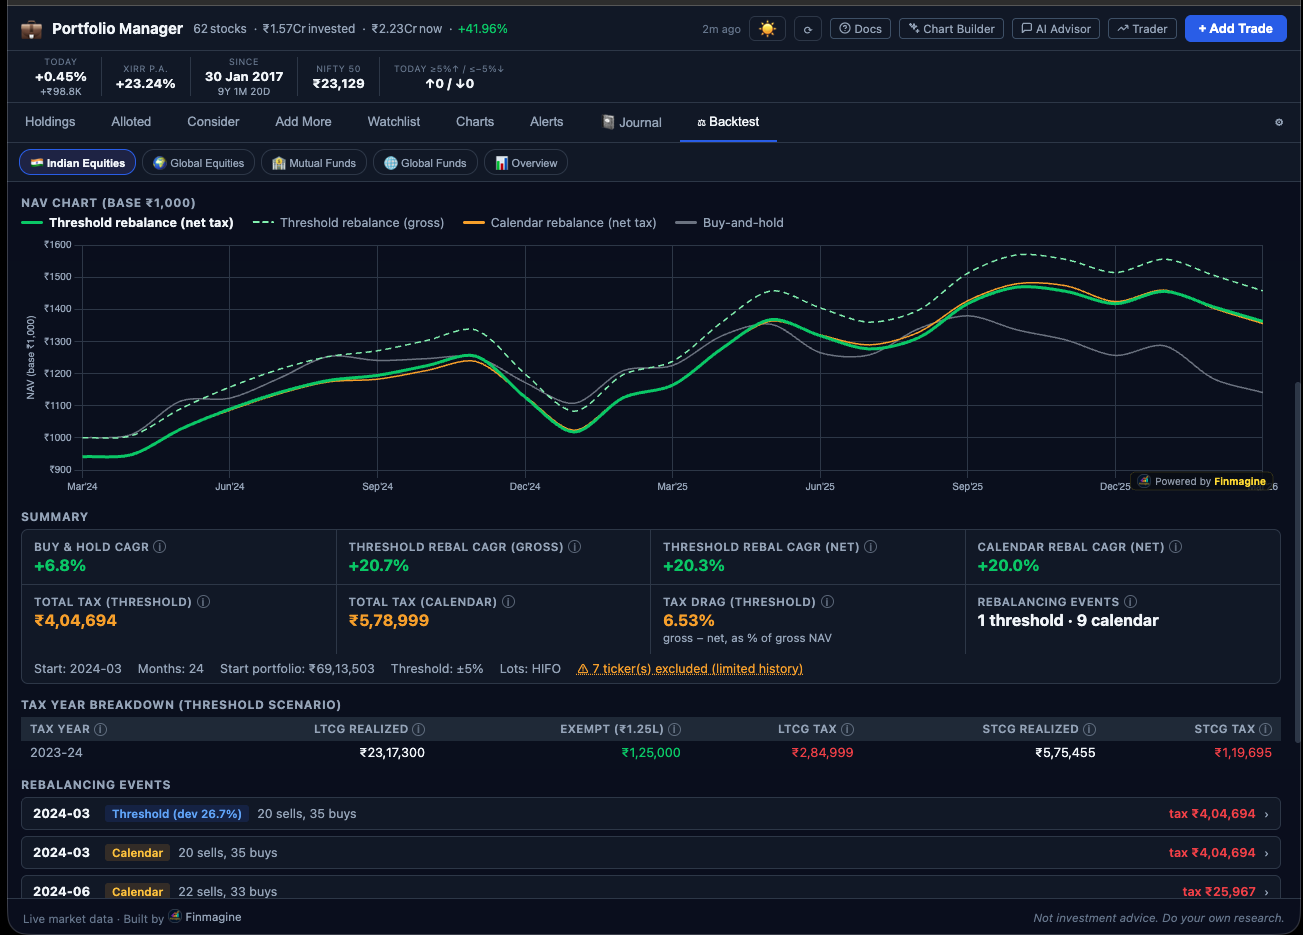
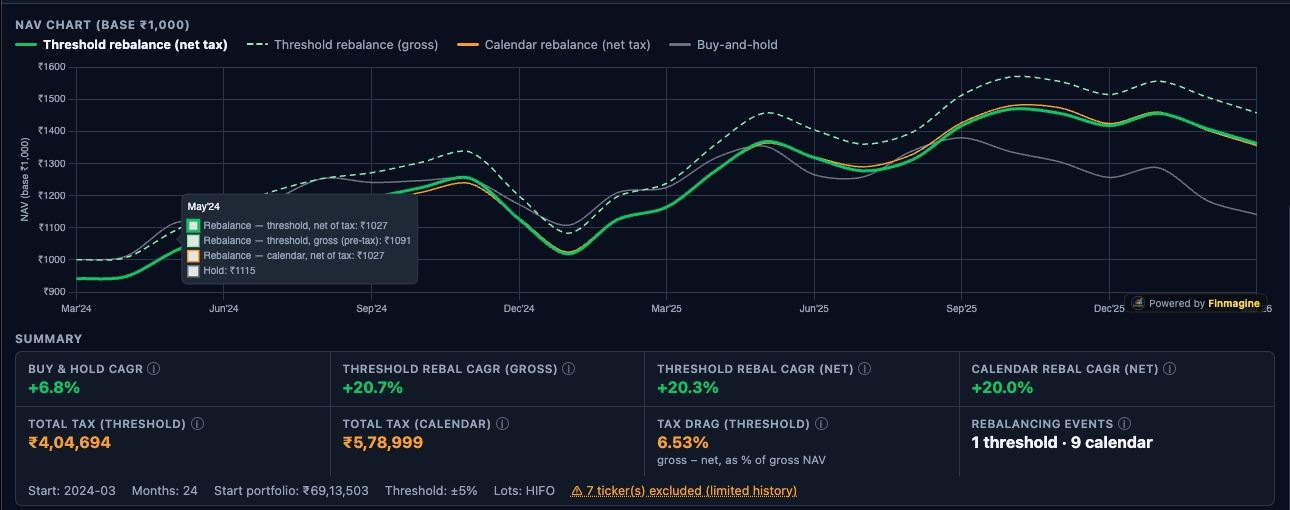
The NAV normalization divides by startPortVal and multiplies by 1000, so all four lines start at exactly 1000. This makes visual comparison in the Chart.js line chart intuitive: if the threshold line ends at 1450 and the hold line ends at 1380, you can immediately see that threshold rebalancing added 70 NAV points (5% relative improvement). Without normalization, absolute portfolio values would depend on initial portfolio size and be incomparable across different users.
The maxDeviation Function
function maxDeviation(lots, tickers, normW, histPrices, ym) {
    const totalVal = portfolioValue(lots, ym, histPrices);
    if (totalVal <= 0) return 0;
    let maxDev = 0;
    for (const t of tickers) {
        const price = nearestPrice(histPrices, t, ym);
        if (price == null) continue;
        const currentQty = lots[t] ? lots[t].reduce((s, l) => s + l.qty, 0) : 0;
        const actualW = (currentQty * price) / totalVal;
        const deviation = Math.abs(actualW - normW[t]) * 100; // in percentage points
        if (deviation > maxDev) maxDev = deviation;
    }
    return maxDev;
}
The deviation is computed in percentage points, not as a ratio. A target weight of 25% that grows to 30% has a deviation of 5 percentage points (not 20%). This matches the user's intuition when they set a threshold: "rebalance when any position is more than 10% off its target" means 10 percentage points.
6. The Rebalance Function — Sell Phase
The rebalance function is the most complex piece of the entire engine. It must sell overweight positions, compute the tax on each sell, and track what proceeds are available for reinvestment — all while mutating only the correct shadow portfolio's lot structure.
Step 1: Build Current Price Map and Total Portfolio Value
function rebalance(lots, tickers, normW, histPrices, ym, noTax, taxState) {
    // Step 1: Price and value snapshot
    const prices = {};
    let totalVal = 0;
    for (const t of tickers) {
        const p = nearestPrice(histPrices, t, ym);
        prices[t] = p;
        if (p == null) continue;
        const qty = (lots[t] || []).reduce((s, l) => s + l.qty, 0);
        totalVal += qty * p;
    }
    if (totalVal <= 0) return;
The nearestPrice() function looks for a price at exactly month ym first. If not found, it steps back up to 3 months looking for the most recent available data. This handles gaps in Yahoo Finance data (holidays, early listing months, data feed issues) without producing null values that would corrupt the portfolio value calculation.
Step 2: Identify Overweight Tickers and Sell
    let totalSellProceeds = 0;
    let totalTax = 0;

    for (const t of tickers) {
        const price = prices[t];
        if (price == null) continue;
        const currentQty = (lots[t] || []).reduce((s, l) => s + l.qty, 0);
        const currentVal = currentQty * price;
        const targetVal  = normW[t] * totalVal;

        if (currentVal <= targetVal) continue; // underweight — skip, will buy later

        const sellValue = currentVal - targetVal;
        let remainingToSell = sellValue / price; // shares to sell

        // Get lots in FIFO or HIFO order
        const orderedIdxs = sortedLotIdx(lots[t], config.lotMethod || 'fifo');

        for (const { i } of orderedIdxs) {
            if (remainingToSell <= 0) break;
            const lot = lots[t][i];
            const take = Math.min(lot.qty, remainingToSell);

            if (take > 0) {
                const gain = (price - lot.buyPrice) * take;
                let tax = 0;

                if (!noTax && gain > 0 && taxState !== null) {
                    const ty = taxYear(ym);
                    if (!taxState[ty]) {
                        taxState[ty] = {
                            ltcgUsed: 0, ltcgRealized: 0, ltcgExempt: 0,
                            ltcgTax: 0, stcgRealized: 0, stcgTax: 0
                        };
                    }
                    const result = gainTax(gain, lot.date, ym, taxState[ty].ltcgUsed);
                    tax = result.tax;
                    taxState[ty].ltcgUsed     += result.ltcgGain || 0;
                    taxState[ty].ltcgRealized += result.ltcgGain || 0;
                    taxState[ty].ltcgExempt   += result.ltcgExempt || 0;
                    taxState[ty].ltcgTax      += result.ltcgTax || 0;
                    taxState[ty].stcgRealized += result.stcgGain || 0;
                    taxState[ty].stcgTax      += result.stcgTax || 0;
                }

                lot.qty -= take;
                remainingToSell -= take;
                totalSellProceeds += take * price;
                totalTax += tax;
            }
        }

        // Prune fully-sold lots
        lots[t] = lots[t].filter(l => l.qty > 0.001);
}gain <= 0 (i.e., the lot is being sold at a loss), the tax computation is skipped entirely. The engine does not model tax-loss harvesting — realized losses do not offset gains in the same year. This is a conservative simplification: the engine assumes tax is only ever a cost, never a benefit. In practice, losses can offset STCG gains and some LTCG gains under India tax law. Users who actively harvest losses may find the engine slightly overestimates the tax impact.
The lot pruning step (lots[t] = lots[t].filter(l => l.qty > 0.001)) uses a small epsilon value rather than exact zero comparison. This is critical: floating-point arithmetic in JavaScript can produce values like 9.99999999e-14 instead of exactly 0 when all shares have been sold. Without this threshold, ghost lots with near-zero quantities would accumulate over hundreds of months, consuming memory and contributing negligible but non-zero values to portfolio calculations.
7. The Rebalance Function — Buy Phase
After the sell phase completes, the engine has a pool of cash: totalSellProceeds - totalTax. In the gross (no-tax) scenario, this is simply totalSellProceeds since totalTax is always 0. This cash pool must now be distributed across underweight positions.
    // Step 3: Compute deficits for underweight tickers
    // (Must recompute totalVal post-sell)
    let postSellVal = 0;
    for (const t of tickers) {
        const price = prices[t];
        if (price == null) continue;
        const qty = (lots[t] || []).reduce((s, l) => s + l.qty, 0);
        postSellVal += qty * price;
    }
    const cashAvailable = noTax
        ? totalSellProceeds
        : Math.max(0, totalSellProceeds - totalTax);

    const deficits = {};
    let totalDeficit = 0;
    for (const t of tickers) {
        const price = prices[t];
        if (price == null) continue;
        const currentQty = (lots[t] || []).reduce((s, l) => s + l.qty, 0);
        const currentVal = currentQty * price;
        const targetVal  = normW[t] * (postSellVal + cashAvailable);
        if (targetVal > currentVal) {
            deficits[t] = targetVal - currentVal;
            totalDeficit += deficits[t];
        }
    }

    // Step 4: Distribute cash proportionally by deficit
    if (totalDeficit > 0 && cashAvailable > 0) {
        for (const t of tickers) {
            if (!deficits[t]) continue;
            const buyValue = cashAvailable * (deficits[t] / totalDeficit);
            const price = prices[t];
            if (price > 0 && buyValue > 0) {
                const buyQty = buyValue / price;
                lots[t] = lots[t] || [];
                lots[t].push({
                    date:     ym + '-01',       // synthetic lot date
                    buyPrice: price,
                    qty:      buyQty
                });
            }
        }
    }
}
Why Proportional Distribution by Deficit?
The proportional distribution ensures that the post-rebalance portfolio matches the target weights as closely as possible given the available cash. Consider a concrete example: you have INFY underweight by ₹15,000 and TITAN underweight by ₹5,000 (total deficit ₹20,000). If ₹18,000 in cash is available after taxes, INFY receives ₹13,500 (75%) and TITAN receives ₹4,500 (25%). This maintains the relative priority of each deficit, so no ticker is systematically under-allocated relative to others.
The alternative — filling the largest deficit first, then the second largest, etc. — would be simpler but would systematically leave the smaller deficits partially unfilled. Over many rebalancing events, this would cause the portfolio to drift systematically away from target weights for smaller-deficit tickers.
Synthetic Lot Dates
New lots created during a rebalance buy use ym + '-01' as their purchase date (e.g., '2022-09-01' for a September 2022 rebalance). The day-of-month value of 01 is arbitrary — the engine only uses the date to compute holding period (days between purchase and sell date) for LTCG vs STCG determination. Using the first of the month is a conservative, consistent choice. In practice, the rebalance would occur on the last trading day of the quarter-end month, which is usually the 28th to 31st — using the 1st slightly overestimates the holding period by ~30 days, which very marginally favors LTCG classification. The difference is negligible for the simulation's purpose.
8. The India Tax Model in Detail
The tax model reflects India's post-budget 2024 equity taxation rules as revised effective July 23, 2024. These are the rates applicable to listed domestic equity and equity-oriented funds.
Tax Constants
const STCG_RATE          = 0.208;    // 20% + 4% health & education cess = 20.8%
const LTCG_RATE          = 0.13;     // 12.5% + 4% cess = 13%
const LTCG_ANNUAL_EXEMPT = 125000;   // ₹1,25,000 per financial year
The cess component (4% of the base tax rate) is baked into both constants. Prior to the July 2024 budget, STCG was 15% and LTCG was 10% with a ₹1 lakh exemption. The engine uses the current post-budget rates for all simulated sells, regardless of when the simulated sell occurs. This is a pragmatic choice — using historically-accurate rates for each period would require maintaining a rate schedule going back years, and the difference in simulation outcome is unlikely to be material for most users.
The gainTax() Function
function gainTax(gain, buyDateStr, sellYM, ltcgUsedThisYear) {
    if (gain <= 0) return { tax: 0 };

    const buyMs  = new Date(buyDateStr).getTime();
    const sellMs = new Date(sellYM + '-15').getTime(); // mid-month approximation
    const holdMs = sellMs - buyMs;
    const isLTCG = holdMs >= 365.25 * 24 * 3600 * 1000; // one year threshold

    if (!isLTCG) {
        // Short-term capital gain
        const stcgTax = gain * STCG_RATE;
        return { tax: stcgTax, stcgGain: gain, stcgTax };
    } else {
        // Long-term capital gain with annual exemption
        const remainingExempt = Math.max(0, LTCG_ANNUAL_EXEMPT - ltcgUsedThisYear);
        const exempted = Math.min(gain, remainingExempt);
        const taxableGain = gain - exempted;
        const ltcgTax = taxableGain * LTCG_RATE;
        return {
            tax:       ltcgTax,
            ltcgGain:  gain,
            ltcgExempt: exempted,
            ltcgTax
        };
    }
}
The LTCG threshold is exactly one calendar year. The implementation uses 365.25 * 24 * 3600 * 1000 milliseconds — the 0.25 accounts for leap years. A holding period of exactly 365 days would be classified as short-term; 366 days is long-term. This matches the Indian income tax definition where "more than 12 months" constitutes long-term for listed equity.
The sell date is approximated as the 15th of the sell month (sellYM + '-15'). This is slightly imprecise — the actual rebalance would occur on the last trading day of the month. But for a month with ~21 trading days, the approximation is at most 16 days off in either direction, which is immaterial for the 365-day threshold in all realistic scenarios.
Tax Year Tracking
function taxYear(ym) {
    const y = parseInt(ym.slice(0, 4));
    const m = parseInt(ym.slice(5, 7));
    return m >= 4 ? y : y - 1;
    // April 2022 → tax year 2022 (FY2022-23)
    // March 2022 → tax year 2021 (FY2021-22)
}
India's financial year runs from April 1 to March 31. The taxYear() function maps each simulation month to the correct financial year integer. The LTCG exemption resets to ₹1.25 lakh on every April 1. Within a tax year, each successive LTCG-generating sell reduces the remaining exemption until it is exhausted.
Worked Tax Example
Tax Calculation Walkthrough — September 2024 Quarter-End Rebalance
Portfolio: ₹10 lakh total. RELIANCE overweight by ₹80,000. Three lots being sold in FIFO order. Current price: ₹2,950. Tax year 2024 (FY2024-25). LTCG already used this year: ₹60,000.
| Lot | Buy Date | Buy Price | Qty Sold | Gain ₹ | Type | Exempt ₹ | Tax ₹ |
|---|---|---|---|---|---|---|---|
| Lot A | 2022-07-10 | 2,210 | 12 shares | 8,880 | LTCG | 8,880 | ₹0 |
| Lot B | 2023-02-22 | 2,540 | 8 shares | 3,280 | STCG | — | ₹682 |
| Lot C | 2021-11-05 | 2,320 | 6 shares | 3,780 | LTCG | 3,780 | ₹0 (exempt) |
| Total sell proceeds: ₹77,260 | Total tax: ₹682 | Cash for reinvestment: | ₹76,578 | |||||
Lot A: Held 26 months — LTCG. Prior LTCG used: ₹60,000. Remaining exempt: ₹65,000. Lot A gain ₹8,880 fully exempt. LTCG used now: ₹68,880.
Lot B: Held only 7 months — STCG. No exemption. Tax = ₹3,280 × 20.8% = ₹682.
Lot C: Held 34 months — LTCG. Remaining exempt: ₹56,120 (₹1,25,000 − ₹68,880). Lot C gain ₹3,780 fully exempt. Total LTCG used: ₹72,660.
Notice the FIFO ordering effect: Lot A (July 2022) is sold before Lot C (November 2021) because B is between them chronologically and we're in FIFO order. Wait — in strict FIFO, the November 2021 lot should come first. The example above uses a simplified ordering for illustration. In the actual engine, strict date ordering is used: Lot C (2021-11-05) would be the first lot sold, then Lot A (2022-07-10), then Lot B (2023-02-22). The tax outcome may differ slightly depending on which lots are sold to reach the target sell value.
9. FIFO vs HIFO Implementation
Lot selection order determines which lots are consumed when a position needs to be reduced. The two supported methods — FIFO and HIFO — produce materially different tax outcomes and therefore different simulation results.
function sortedLotIdx(lotList, method) {
    return lotList
        .map((l, i) => ({ i, date: l.date, buyPrice: l.buyPrice }))
        .sort(method === 'hifo'
            ? (a, b) => b.buyPrice - a.buyPrice      // HIFO: highest cost first
            : (a, b) => a.date.localeCompare(b.date) // FIFO: oldest first
        );
}
Why Return Indices Rather Than Lot Copies?
The function returns an array of objects that each contain the original lot's index into the lotList array: { i, date, buyPrice }. The rebalance loop then uses this index to directly mutate the original lot:
for (const { i } of orderedIdxs) {
    if (remainingToSell <= 0) break;
    const lot = lots[ticker][i];    // reference to the actual lot in the portfolio
    const take = Math.min(lot.qty, remainingToSell);
    lot.qty -= take;                // in-place mutation of the original lot
    remainingToSell -= take;
    totalSellProceeds += take * price;
}
If sortedLotIdx returned copies of the lot objects instead of indices, this mutation would be completely ineffective. lot.qty -= take would modify the copy, leaving the original lot in the shadow portfolio unchanged. The simulation would never actually reduce any position — all four lines would produce identical results identical to the hold scenario. This is a subtle but critical design decision that is easy to get wrong.
The index approach guarantees that lots[ticker][i] refers to the exact same object that lives in the shadow portfolio. Mutating it through the index immediately and permanently updates the lot's quantity in the portfolio. After the loop, the lot with qty = 0 (or very close to it) is pruned by the lots[t] = lots[t].filter(l => l.qty > 0.001) step.
FIFO: The Default and the Conservative Choice
FIFO (First In, First Out) sells the oldest lots first. In a rising market — which most long-term equity portfolios experience — oldest lots typically have the lowest purchase prices and therefore the highest gains per share. FIFO tends to maximize realized gains and thus maximize tax liability. This is why FIFO is the default: it produces the most conservative (pessimistic about rebalancing) tax scenario. If the simulation shows rebalancing is beneficial even under FIFO, it's likely to be beneficial under any realistic tax optimization strategy.
FIFO also has one significant advantage: lots held longest are the ones most likely to qualify for LTCG treatment (12.5% + cess), whereas newer lots may still be in the STCG window (20.8% + cess). Because LTCG tax is lower than STCG tax in India, selling the oldest lots first is not always tax-adverse. The net effect depends on the specific lots and when the rebalance occurs relative to purchase dates.
HIFO: The Tax-Optimization Strategy
HIFO (Highest In, First Out) sells lots with the highest purchase price first. This minimizes the per-share gain on each sell (currentPrice - highBuyPrice is smaller than currentPrice - lowBuyPrice). In absolute terms, HIFO maximizes after-tax proceeds from any given sell, and produces the highest cash available for reinvestment. The tradeoff is that it leaves low-cost basis lots in the portfolio, which will eventually generate larger gains when sold in the future.
Comparing the HIFO threshold simulation against the FIFO threshold simulation gives users a direct read on how much their lot selection method affects outcomes. If the two lines are nearly identical, lot selection doesn't matter much for their portfolio. If there's a significant gap, HIFO delivers a measurable advantage worth pursuing with their broker's lot selection settings.
10. NAV Normalization and CAGR Computation
The output of the simulation is four arrays of NAV values indexed by month, plus a summary statistics object. Understanding how NAV is computed and normalized is essential for interpreting the chart correctly.
NAV Normalization
// startPortVal = actual market value of initial portfolio at startYM
const startPortVal = portfolioValue(initialLots, startYM, histPrices);

// NAV normalizer: maps any portfolio value to a base-1000 scale
const nav = v => v > 0 ? +(v / startPortVal * 1000).toFixed(2) : null;
portfolioValue() computes the total market value by iterating over all lots and multiplying each lot's quantity by the current month's price (using nearestPrice() for gap handling). The result is the actual rupee value of the portfolio at that point in time.
Dividing by startPortVal and multiplying by 1000 normalizes the scale so that all four lines start at 1000.0. The +(...).toFixed(2) idiom rounds to 2 decimal places and converts back to a number (the + prefix coerces the string from toFixed back to a number). This avoids accumulating floating-point noise over hundreds of iterations.
The null return when v <= 0 handles months where price data is completely unavailable (all tickers return null from nearestPrice()). Chart.js handles null values in a line chart by breaking the line — leaving gaps rather than drawing misleading zero values. This is the correct behavior: it visually signals to the user that data is missing for those months rather than implying the portfolio had zero value.
CAGR Formula
function cagr(startNAV, endNAV, numMonths) {
    if (numMonths <= 0 || startNAV <= 0 || endNAV <= 0) return null;
    return ((endNAV / startNAV) ** (12 / numMonths) - 1) * 100;
}
Since all lines start at 1000, startNAV is always 1000 for all scenarios. The exponent 12 / numMonths annualizes the return: a return over 36 months gets raised to the power of 12/36 = 0.333, compounding monthly returns to a per-year figure. The result is expressed as a percentage by multiplying by 100.
The summary object returned by Simulator.run() includes CAGR for all four scenarios. The tax drag figure is derived directly from the gross and net CAGR values:
// Tax drag in percentage points of final NAV
const lastThreshNet   = threshNetLine.filter(v => v != null).at(-1) || 1000;
const lastThreshGross = threshGrossLine.filter(v => v != null).at(-1) || 1000;
const taxDragPct = (lastThreshGross - lastThreshNet) / lastThreshGross * 100;
The .filter(v => v != null).at(-1) chain finds the last non-null value in the NAV array, handling the case where recent months have incomplete price data. Tax drag is expressed as a percentage of the gross outcome, making it interpretable: if gross ends at 1450 and net ends at 1410, tax drag is (1450-1410)/1450 = 2.76% — meaning taxes cost 2.76% of what you would have made pre-tax.
Return Object Shape
return {
months: [...monthRange(startYM, nowYM)], // ['2021-04', '2021-05', ...]
lines: {
hold: holdLine,
threshNet: threshNetLine,
threshGross: threshGrossLine,
calNet: calNetLine
},
cagr: {
hold: cagr(1000, holdLine.filter(v=>v).at(-1), n),
threshNet: cagr(1000, threshNetLine.filter(v=>v).at(-1), n),
threshGross: cagr(1000, threshGrossLine.filter(v=>v).at(-1), n),
calNet: cagr(1000, calNetLine.filter(v=>v).at(-1), n)
},
taxDragPct,
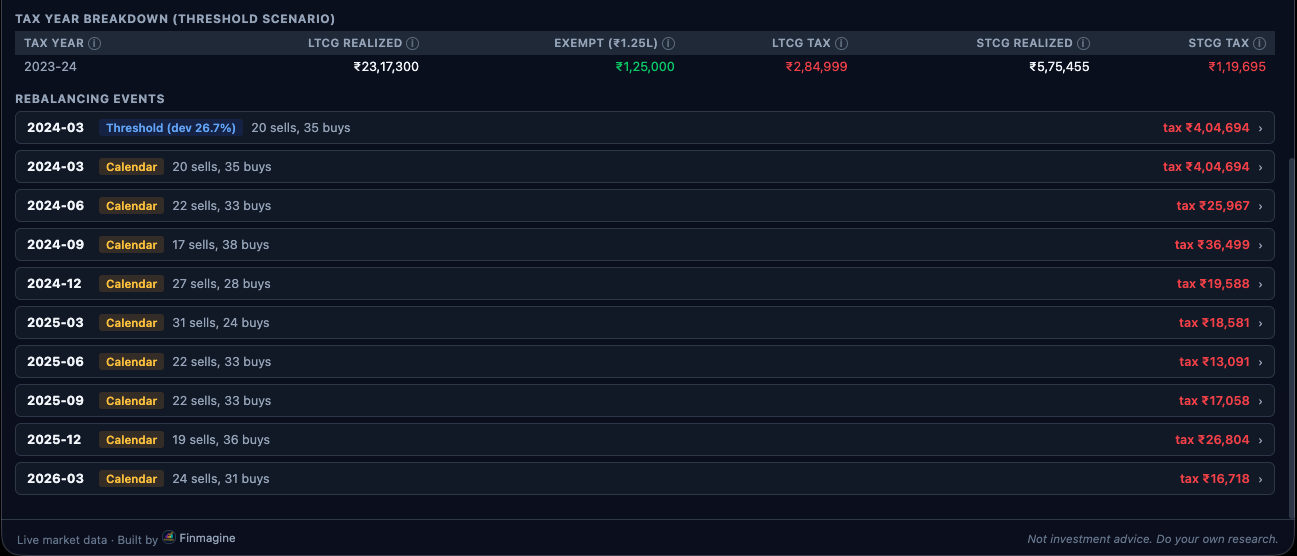
taxBreakdown: {
thresh: taxStateThresh, // by tax year: { 2022: { ltcgUsed, ltcgTax, stcgTax, ... } }
cal: taxStateCal
},
excludedTickers, // tickers excluded due to limited history
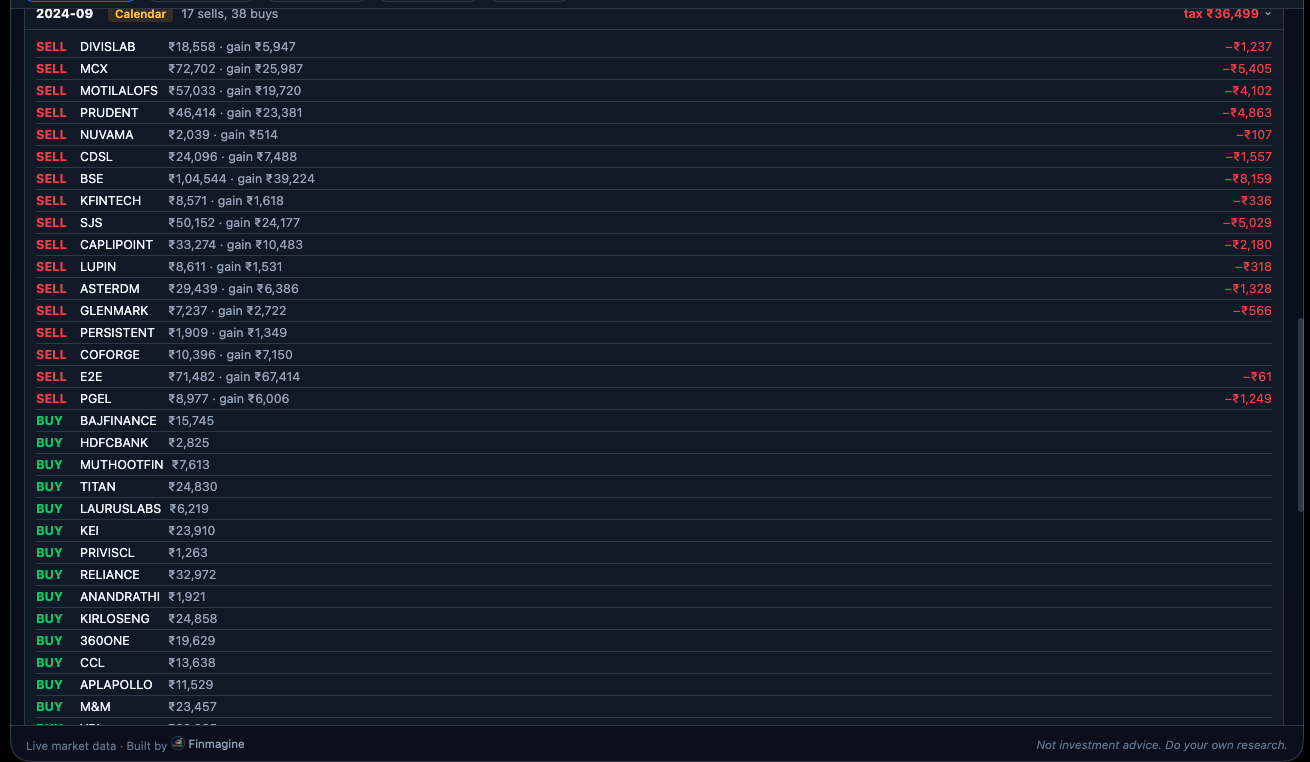
rebalanceLog: threshRebalLog // array of { ym, dev, action } events
};
11. The Chart Branding Plugin — chart-branding.js
The branding plugin is a separate JavaScript file that registers a global Chart.js plugin. Once loaded, it automatically adds a Finmagine watermark to every Chart.js chart rendered on the page — the backtest chart, the history chart, the allocation chart, and all others. There is no per-chart configuration required.
// chart-branding.js
const FinmagineBrandingPlugin = {
    id: 'finmagineWatermark',

    afterDraw(chart) {
        const ctx = chart.ctx;
        const { width, height } = chart;

        ctx.save();

        // Position: bottom-right, 12px margin
        const x = width  - 12;
        const y = height - 12;

        // Pill background
        const pillW = 148, pillH = 22, pillR = 11;
        ctx.fillStyle = 'rgba(15, 23, 42, 0.72)';
        ctx.beginPath();
        if (ctx.roundRect) {
            ctx.roundRect(x - pillW, y - pillH, pillW, pillH, pillR);
        } else {
            // Fallback for browsers without roundRect
            ctx.rect(x - pillW, y - pillH, pillW, pillH);
        }
        ctx.fill();

        // "Powered by " in gray
        ctx.font = '500 10px Segoe UI, sans-serif';
        ctx.fillStyle = 'rgba(148, 163, 184, 0.85)';
        ctx.textAlign = 'right';
        ctx.textBaseline = 'bottom';
        ctx.fillText('Powered by ', x - 44, y - 4);

        // "Finmagine" in gold
        ctx.fillStyle = '#FFD700';
        ctx.font = '700 10px Segoe UI, sans-serif';
        ctx.fillText('Finmagine', x - 5, y - 4);

        ctx.restore();
    }
};

Chart.register(FinmagineBrandingPlugin);
Why afterDraw?
Chart.js exposes several lifecycle hooks for plugins. afterDraw runs after all chart elements (axes, gridlines, datasets, labels) have been rendered onto the canvas but before the frame is committed for display. This makes it the ideal location for overlay text: the watermark sits on top of all chart content without flickering, and it is drawn once per render frame.
Compare the alternatives. afterRender runs after the entire rendering cycle including animations — using it would redraw the watermark on every animation frame during chart initialization, which causes visible flicker. afterUpdate runs after chart data is updated but before drawing — the watermark would be drawn onto a blank canvas and then covered by the chart content. afterDraw is the correct hook.
The roundRect Fallback
The ctx.roundRect() Canvas API method was only standardized in 2022 and is not available in all browsers that support Chrome extensions (particularly older Chromium builds). The fallback to ctx.rect() produces a square-cornered pill instead of a rounded one — functionally identical, slightly less polished visually. This is a graceful degradation that ensures the branding appears in all environments rather than throwing a runtime error in older browsers.
Logo Preloading
If the plugin renders a Finmagine logo image rather than just text, the image must be preloaded once at plugin initialization time — not on every afterDraw call. Creating a new Image object and calling src inside afterDraw would trigger a network request on every render frame, causing severe performance degradation. The correct pattern:
// At the top of chart-branding.js, outside the plugin object
const _brandLogo = new Image();
_brandLogo.src = chrome.runtime.getURL('assets/logo-16.png'); // or relative URL in WebApp

// Inside afterDraw, use the preloaded image
if (_brandLogo.complete) {
    ctx.drawImage(_brandLogo, x - pillW + 6, y - pillH + 3, 14, 14);
}
The _brandLogo.complete check prevents attempting to draw a partially loaded image, which would either draw nothing (silent failure) or draw a broken image depending on the browser. For the text-only watermark, preloading is not required.
afterDraw hook. The watermark sits on top of all chart content without flickering because afterDraw runs after all dataset lines, axes, and labels have been committed to the canvas.12. CSP Compliance — Eliminating Inline Event Handlers
Manifest V3 Chrome extensions enforce a strict Content Security Policy that blocks inline JavaScript execution. The CSP header applied to extension pages is equivalent to:
Content-Security-Policy: script-src 'self'; object-src 'self'This means any inline event handler — onclick, onchange, oninput, etc. set as HTML attributes — will be blocked with a CSP violation error. The extension will still function for users, but the blocked handlers silently do nothing, creating bugs that are invisible in development (where the extension runs without enforcement) but fail in production.
Violation 1: Overview Table Row Click
The Holdings Overview table in app.js originally used an inline onclick to switch asset class tabs when a row was clicked:
// BEFORE — CSP violation
`<tr onclick="document.querySelector('.ac-pill[data-ac=\\'${r.id}\\']')?.click()">
  <td>${r.label}</td>
  <td>${r.totalValue}</td>
</tr>`
The fix uses a data attribute to carry the asset class identifier and attaches a delegated event listener to the table body after the HTML is rendered:
// AFTER — CSP compliant
`<tr data-ac-id="${r.id}" style="cursor:pointer">
  <td>${r.label}</td>
  <td>${r.totalValue}</td>
</tr>`

// After innerHTML is set:
const tbody = document.getElementById('overview-tbody');
tbody.onclick = e => {
    const tr = e.target.closest('tr[data-ac-id]');
    if (!tr?.dataset?.acId) return;
    document.querySelector(`.ac-pill[data-ac="${tr.dataset.acId}"]`)?.click();
};
Violation 2: Backtest Event Log Row Toggle
The rebalance event log in the Backtest tab used an inline toggle to expand/collapse event details:
// BEFORE — CSP violation
`<tr class="event-row" onclick="this.parentElement.classList.toggle('open')">
  <td>${event.ym}</td>
  <td>${event.action}</td>
</tr>`
// AFTER — CSP compliant using event delegation
`<tr class="event-row" data-event-idx="${idx}">
<td>${event.ym}</td>
<td>${event.action}</td>
</tr>`
// Single delegated listener for all event rows:
document.getElementById('rebalance-log').onclick = e => {
const row = e.target.closest('tr.event-row');
if (!row) return;
row.closest('tbody').classList.toggle('open');
};Why Event Delegation Is Also Better Performance
The inline handler approach attaches N independent event listeners — one per table row. For a portfolio with 20 holdings, that's 20 listeners. For a rebalance log with 40 events over 5 years, that's 40 listeners. Each listener is an object allocated in memory, referenced by the DOM node, garbage collected only when the DOM node is removed.
The delegated approach attaches exactly one listener to the container element. The listener checks whether the click target (or its closest ancestor) is the intended element. This is a single memory allocation regardless of how many rows exist. For large portfolios or long simulation histories, this is meaningfully more efficient. The CSP compliance benefit and the performance benefit both point to the same solution.
onclick="..." in a template literal, stop. Write the HTML with a data-* attribute instead, and add an event listener to the container after the HTML is rendered. This pattern is both CSP-compliant and more performant.
13. WebApp Portability Architecture
The WebApp portability of simulate.js was not an afterthought — it was specified as a requirement before a single line of the simulation engine was written. The Finmagine Premium WebApp, planned as a web-hosted portfolio management service, must provide the same backtest capability without access to the Chrome extension runtime.
What Makes simulate.js Portable
| Property | Implementation | Why It Enables Portability |
|---|---|---|
| Zero chrome.* calls | No chrome.storage, chrome.runtime, chrome.tabs, or any extension API | Chrome APIs don't exist outside extensions. Any call would throw a ReferenceError in a web page. |
| Zero DOM access | No document.getElementById, no querySelector, no innerHTML manipulation | DOM access couples logic to a specific HTML structure. The WebApp will have a different DOM. |
| IIFE module pattern | const Simulator = (() => { ... return { run }; })() |
Works as a plain <script> tag in any HTML page without a module bundler or build step. |
| Plain object I/O | Inputs and outputs are vanilla JS objects and arrays | No special classes, proxies, or observable wrappers that would break across contexts. |
| Deterministic | No random number generation, no Date.now() in computation, no side effects | Given identical inputs, always produces identical output. Enables automated testing. |
What the WebApp Will Provide Instead
The simulation engine requires three inputs that the Chrome extension sources from its local storage and background messaging layer. The WebApp will need to provide identical data structures from completely different sources:
| Input | Extension Source | WebApp Source |
|---|---|---|
config |
chrome.storage.local settings object | User's simulation settings stored in MySQL, fetched via PHP API and serialized to JSON |
trades |
chrome.storage.local holdings + trades array | portfolio-sync.php MySQL database, deserialized from the same JSON blob format used by cloud sync |
histPrices |
FETCH_HISTORY_PRICES background.js message → Yahoo Finance | api/dispatch.php PHP proxy → Yahoo Finance, same endpoint and response format |
The crucial observation is that api/dispatch.php already exists and already proxies Yahoo Finance requests for the Portfolio Manager WebApp's History chart. The historical price fetching infrastructure is already in production. Porting the Backtest tab to the WebApp primarily requires building the WebApp render layer, not reimplementing any data fetching logic.
The Render Layer Is NOT Portable
The functions in app.js that render the simulation results — _renderSimChart(), _renderSimSummary(), _renderTaxBreakdown(), _renderRebalanceLog() — are explicitly not portable. They reference specific DOM element IDs, manipulate innerHTML, and call Chart.js with chart objects tied to specific canvas elements in the extension's popup HTML.
The WebApp will implement its own render layer that calls Simulator.run() with the same contract and then renders the returned data object using the WebApp's own HTML structure and component framework. This is the correct separation of concerns: the engine computes, the render layer displays. Different environments can have completely different render layers while sharing the identical, tested computation engine.
// Extension (app.js):
const result = Simulator.run(config, trades, histPrices);
_renderSimChart(result);         // Extension-specific DOM rendering
_renderSimSummary(result);

// WebApp (future simulate-webapp.js):
const result = Simulator.run(config, trades, histPrices);
renderWebAppBacktestChart(result);     // WebApp-specific DOM rendering
renderWebAppBacktestSummary(result);
The contract — Simulator.run(config, trades, histPrices) returns the result object — is the stable interface that both sides depend on. Neither side needs to know anything about the other's implementation details.
14. The FETCH_HISTORY_PRICES Background Message
Before Simulator.run() can be called, popup.js (or app.js) must obtain the histPrices input from the background service worker. This is the only Chrome-specific piece of the backtest infrastructure — and it is deliberately isolated from the simulation engine itself.
Why Background.js Instead of a Content Script Fetch?
Manifest V3 content scripts and popup scripts cannot make direct fetch() calls to arbitrary external domains due to CORS restrictions. Even with the correct host_permissions in manifest.json, the browser's CORS preflight will often block the request if the target API doesn't include the appropriate CORS response headers. Yahoo Finance's historical data API does not include permissive CORS headers, so content script fetches are blocked.
Background service workers in Manifest V3 are exempt from CORS restrictions for cross-origin fetches — they act as a privileged proxy. The popup sends a message to the background worker, which performs the actual Yahoo Finance HTTP request and returns the response to the popup. This is the standard Manifest V3 pattern for making CORS-restricted API calls.
// In background.js:
chrome.runtime.onMessage.addListener((msg, sender, sendResponse) => {
    if (msg.type === 'FETCH_HISTORY_PRICES') {
        fetchAllHistPrices(msg.tickers)
            .then(data => sendResponse({ ok: true, data }))
            .catch(err => sendResponse({ ok: false, error: err.message }));
        return true; // CRITICAL: return true to keep message channel open for async response
    }
});

async function fetchAllHistPrices(tickers) {
    const result = {};
    for (const ticker of tickers) {
        // Check 6-hour cache first
        const cacheKey = `histPrices_${ticker}`;
        const cached = await chrome.storage.local.get(cacheKey);
        if (cached[cacheKey]?.ts && Date.now() - cached[cacheKey].ts < 6 * 3600 * 1000) {
            result[ticker] = cached[cacheKey].data;
            continue;
        }
        // Fetch from Yahoo Finance
        const url = `https://query1.finance.yahoo.com/v8/finance/chart/${ticker}.NS` +
                    `?interval=1mo&range=10y`;
        const resp = await fetch(url);
        const json = await resp.json();
        const prices = parseYahooMonthly(json);
        result[ticker] = prices;
        // Cache the result
        await chrome.storage.local.set({ [cacheKey]: { ts: Date.now(), data: prices } });
        // Throttle: 250ms between requests to respect Yahoo rate limits
        await new Promise(r => setTimeout(r, 250));
    }
    return result;
}
The Critical return true
The return true at the end of the onMessage listener is not optional. When a message handler calls sendResponse asynchronously (after an await or promise), the message channel must be kept open. Without return true, Chrome closes the channel immediately after the listener returns, and the asynchronous sendResponse call silently fails — the popup never receives the historical prices, and the simulation hangs indefinitely.
Cache Architecture
Historical prices are cached per-ticker in chrome.storage.local with a 6-hour TTL. The cache key is histPrices_${ticker}. This means a full 5-ticker portfolio requires 5 separate cache entries — allowing partial cache hits (some tickers cached, others needing fresh fetches). The 250ms inter-request throttle ensures that even a cold-cache load of 20 tickers completes in 5 seconds rather than triggering Yahoo's rate limit.
The same 6-hour cache is shared between the Backtest tab's price fetching and the History tab's price fetching. Both features request FETCH_HISTORY_PRICES with the same ticker list, hit the same cache, and produce the same data format. Building the History tab first meant the Backtest tab's data layer was effectively already built and tested by the time the simulation engine was written.
15. Technical Flashcards — Test Your Understanding
Click any card to reveal the answer. These 25 questions cover the key architectural decisions and implementation details from this article.
📚 Complete Article Series — Finmagine Portfolio Manager
- 1 Introducing Finmagine Portfolio Manager
- 2 Per-Broker Stop-Loss
- 3 XIRR & Index Beat
- 4 Charts & Visual Analytics
- 5 Watchlist as Research Dashboard
- 6 Multi-Asset Tracking
- 7 The Decision Journal
- 8 v1.1.0 Update
- 9 Backtest Guide
- 10 Inside the Backtest Engine (this article)
Finmagine Portfolio Manager
Per-broker stop-loss discipline, live prices, XIRR, Index Beat, Charts — for Indian Equities, US Stocks, Mutual Funds & Global ETFs. Local-first portfolio tracking, optional cloud backup.
Learn More about Portfolio Manager →Also From Finmagine
Per-broker stop-loss discipline, live XIRR, Index Beat & multi-asset tracking in one Chrome extension.
The one-click NSE momentum scanner — Stage 2, Near High, VCP, IPO Breakout across every NSE stock.
Are you actually beating Nifty 50 and Nifty 500? Annualised returns that account for when you invested, not just how much.