Following along? Install Finmagine Trader first
Free NSE momentum scanner — no account needed • Chrome, Edge, Brave
Multimedia Learning Hub
Master Finmagine Trader through a complete guide, real examples, and 60 interactive flashcards
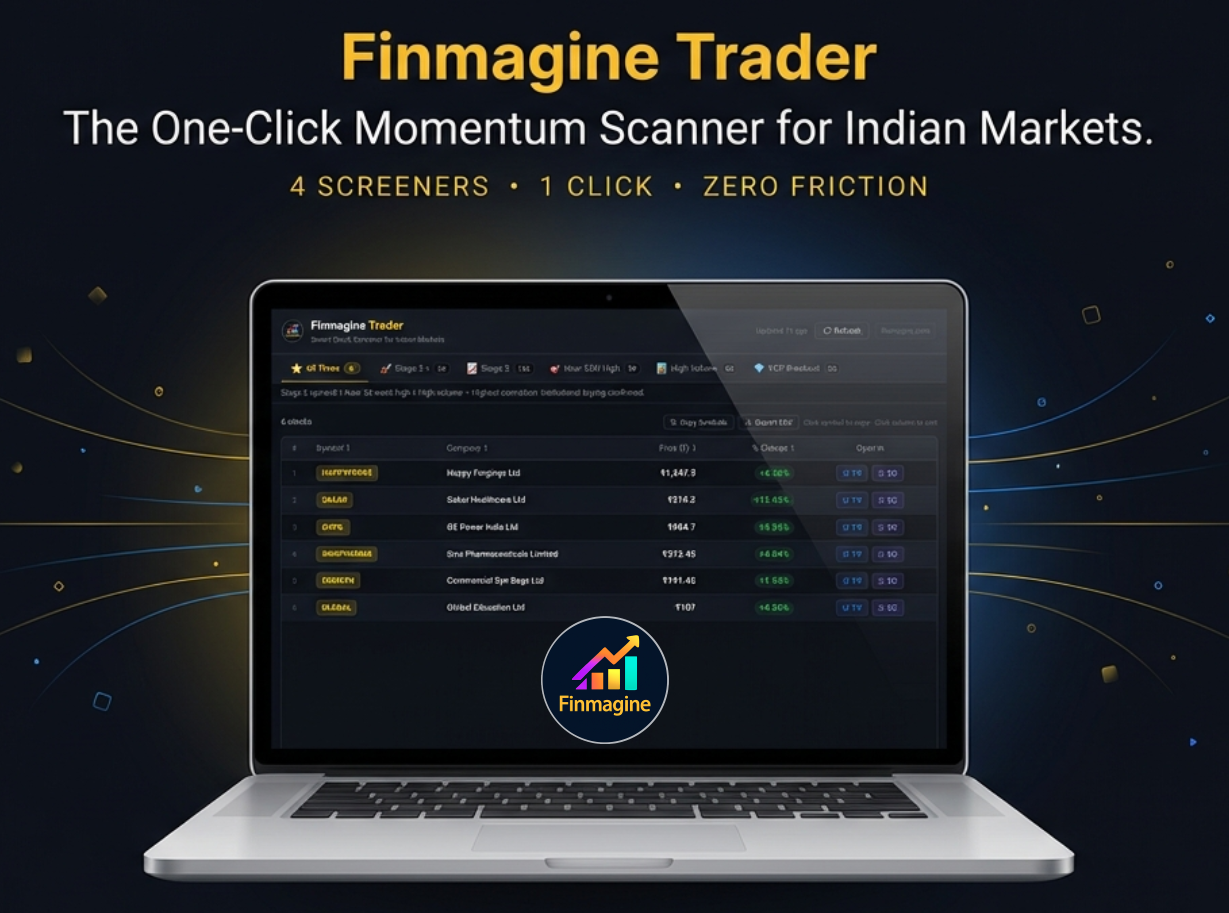
Finmagine Trader: One Click. Five Screeners. Highest-Conviction Picks.
Indian market traders spend hours each morning running manual scans. By the time they've checked Stage 2 trends, 52-week highs, and volume surges separately, the session has moved on. Finmagine Trader collapses that entire workflow into a single click.
- Stage 2 Uptrend (Stan Weinstein)
- Near 52-Week High (price discovery)
- High Volume Cash Market
- VCP Breakout (Minervini)
- All Three — Highest Conviction (~6 stocks)
- Stage 2 + Near High — Swing trades
- Stage 2 — Full momentum universe
- Near 52W High · High Volume · VCP
- No login or account required
- No data leaves your browser
- Results in under 10 seconds
- Copy Symbols → paste into TradingView
Scan 2000+ NSE Stocks in 10 Seconds
A complete dashboard walkthrough — all 6 strategy tabs explained, intersection logic demonstrated, and the full TradingView export workflow shown live. ~8 minutes.
From 45-Minute Manual Scans to 10 Seconds — Audio Deep Dive
The morning scanning problem, intersection logic, all 6 tabs explained, the complete 5-step TradingView workflow, and why zero results in All Three is the best market signal of all. Best for commute or post-market review. ~20 minutes.
Generated with NotebookLM · Script sourced from this guide · Covers all key topics in this article
Test Your Finmagine Trader Knowledge — 60 Flashcards
Click any card to reveal the answer. Search by topic to focus on a specific area. All 60 flashcards cover every key concept — from intersection logic and tab criteria to workflow, privacy, and market psychology.
The Problem With Manual Scanning
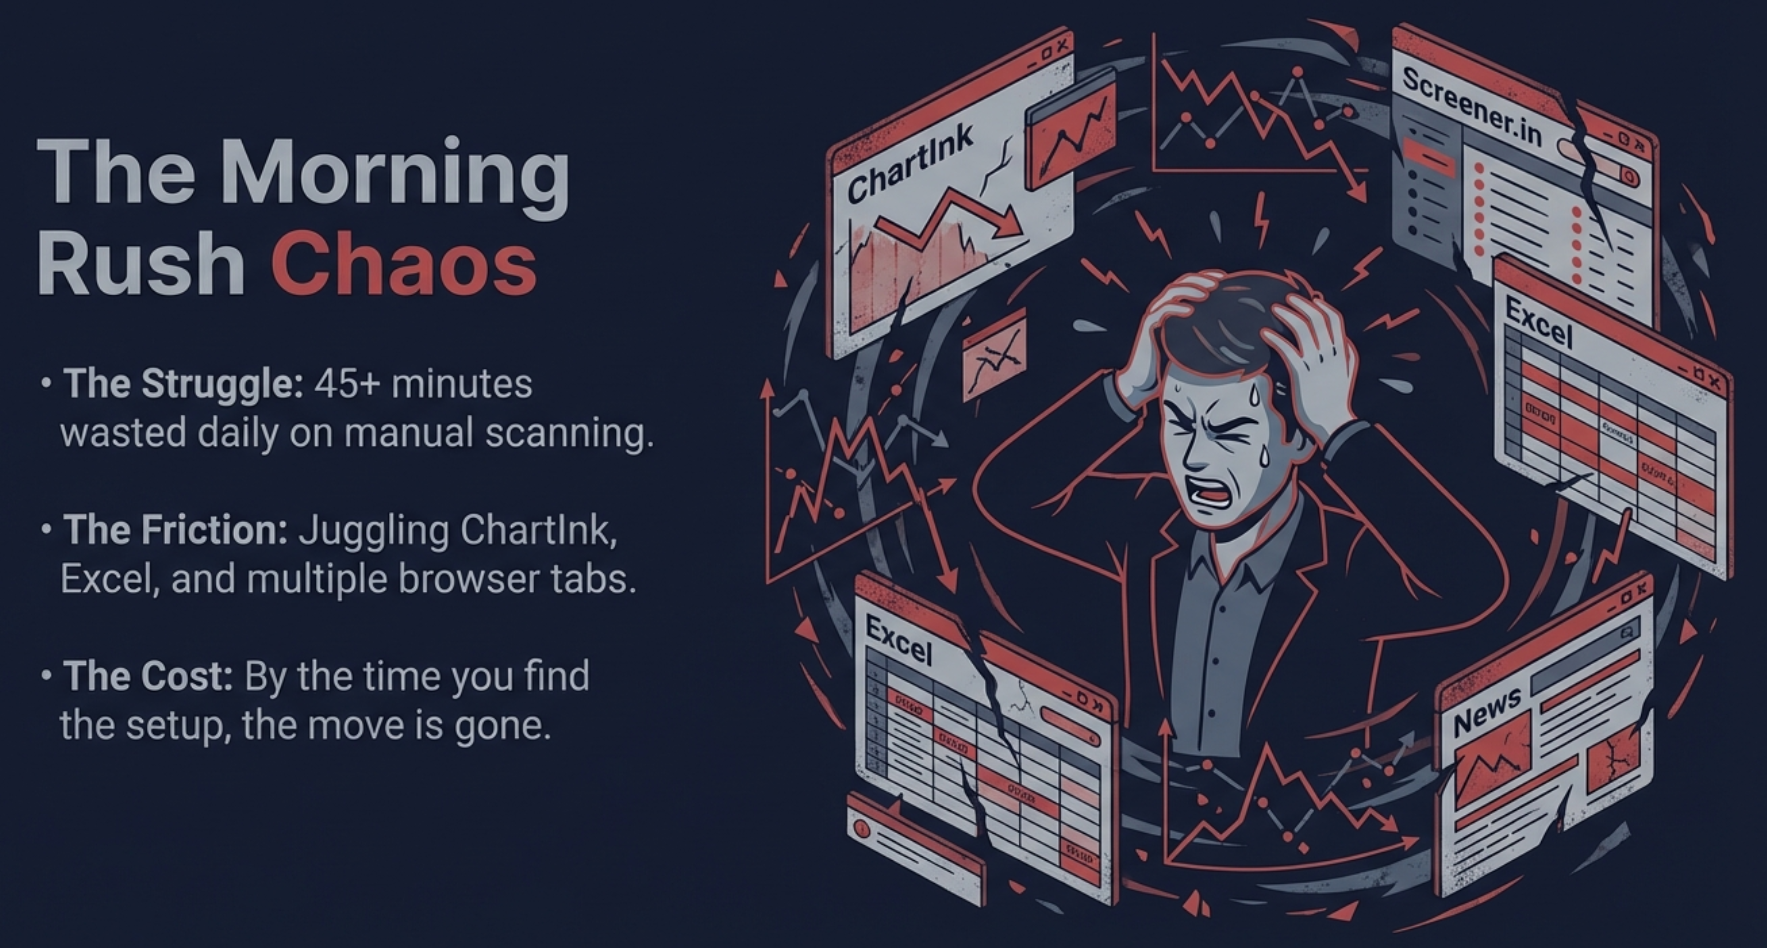
Every serious Indian market trader eventually discovers screeners. They spend hours building scan filters, watching YouTube videos to copy-paste the right parameters, then running each scan manually every morning before the market opens. Stage 2 stocks need one scan. Near 52-week highs need a second scan. Volume surges need a third. VCP setups need a fourth — and that one alone requires understanding Minervini's criteria well enough to translate them into filter clauses.
By the time a diligent trader has completed all five passes, cross-referenced the results, opened charts for the interesting intersections, and decided which ones actually merit attention — it is 10:30 AM. The opening momentum trades have already been made by those who either automated this process or had the lists ready the night before.
The deeper problem is consistency. Most traders run these scans diligently for two weeks, then skip a day because morning was busy, then skip another because the market was correcting so why bother, and eventually the daily scanning habit dissolves. The discipline required to maintain manual scanning across months is genuinely high — and most traders quietly admit they only scan when they "have time."
Every day you skip your scans is a day the market runs 6 high-conviction momentum setups past you unnoticed. Finmagine Trader eliminates the discipline problem entirely — the scan happens the moment you click the icon.
There is also the problem of fragmented workflows. Checking results means switching between multiple browser tabs, copying tickers into a charting app, then cross-referencing fundamentals in yet another window. Each friction point creates an opportunity to give up. Finmagine Trader was built to remove every single one of these friction points.
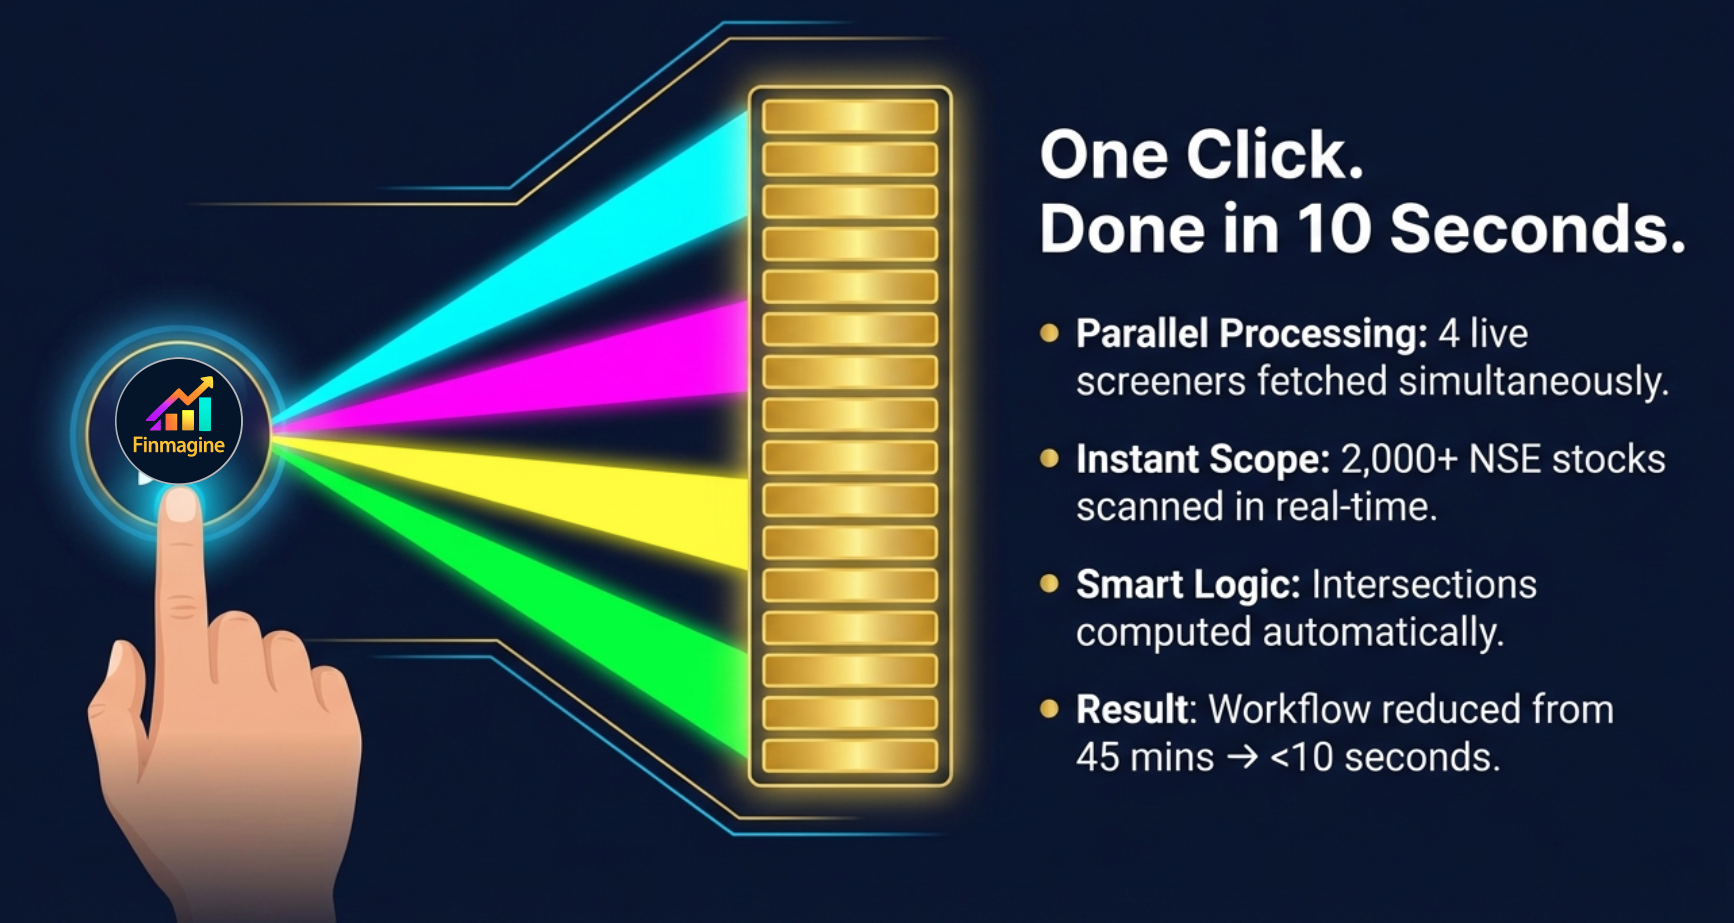
The extension fetches all five screeners simultaneously, computes the intersections automatically, and presents the results in a single unified dashboard. No account. No scan clause memorisation. No daily ritual beyond the one click that opens the dashboard. The morning scanning workflow shrinks from 45 minutes to under 10 seconds.
What Is Finmagine Trader?
Finmagine Trader is a free Chrome extension built specifically for Indian market momentum traders. It is not a website you visit, a subscription you pay for, or an account you create. It is an extension that lives in your Chrome toolbar and opens a complete momentum dashboard on demand — from any tab, at any time of day.
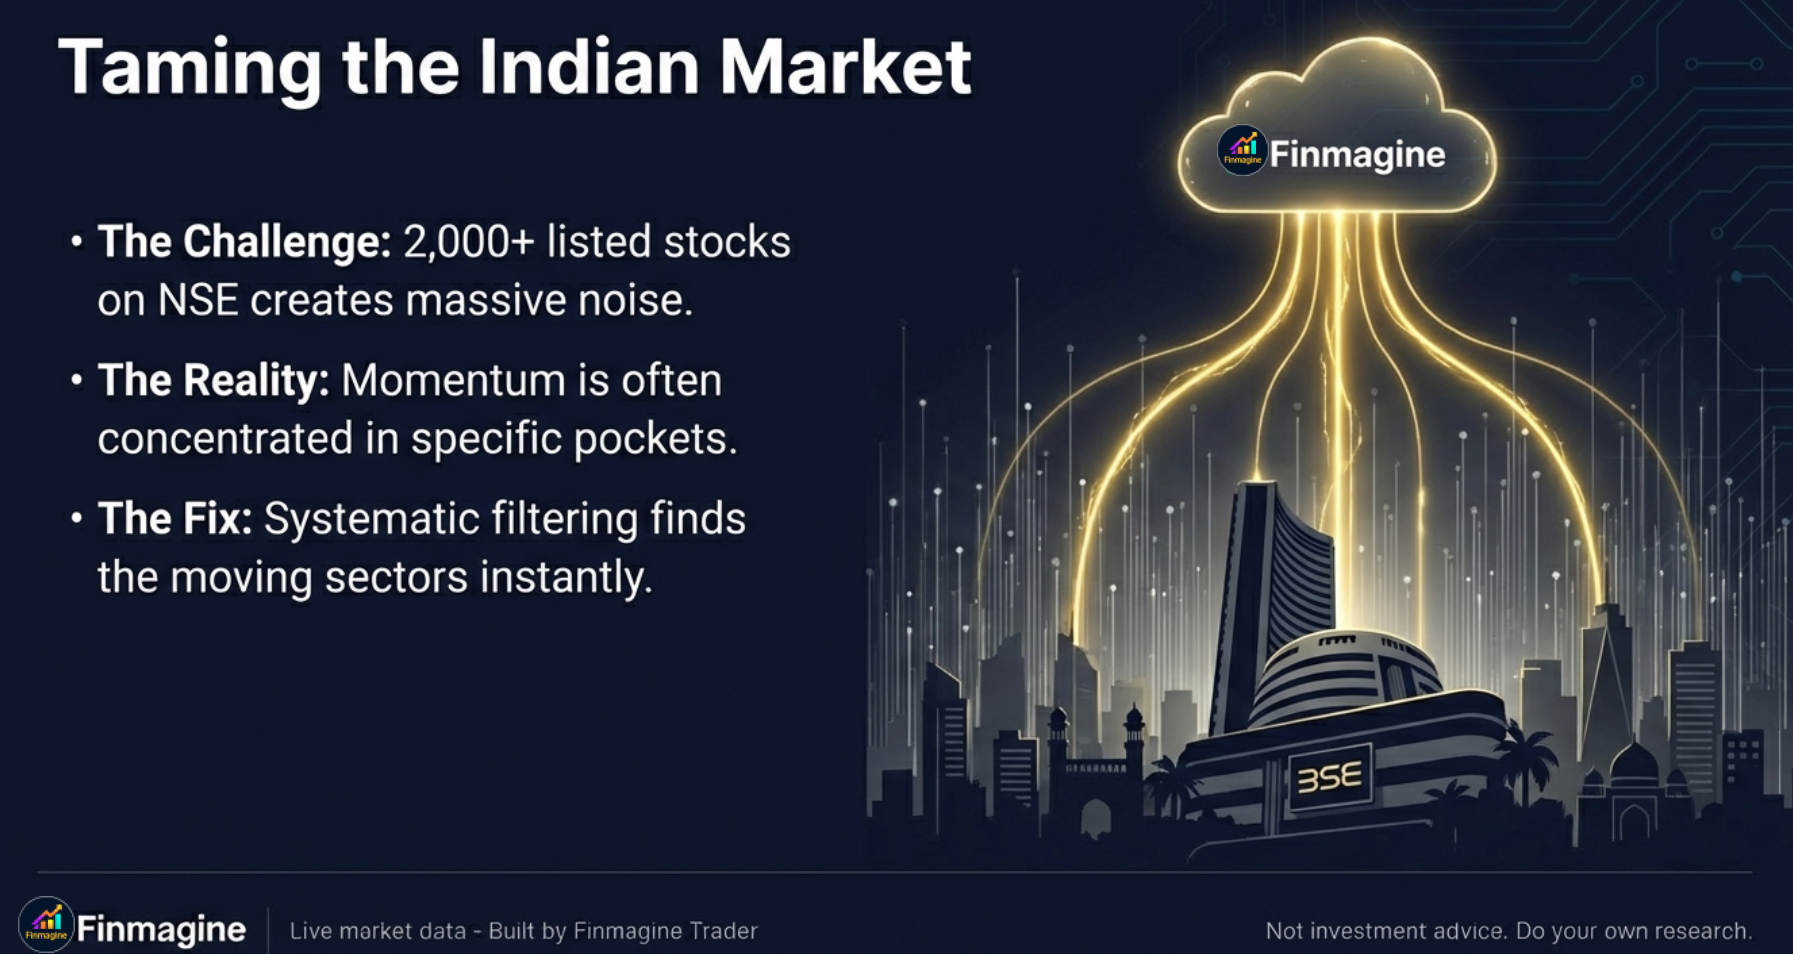
When you click the extension icon, a full-page dashboard opens. In the background, the extension immediately begins fetching data across all NSE-listed stocks — approximately 2,000+ companies — through five distinct screener queries running in parallel. Within 10 seconds, all seven strategy tabs are populated with live results. The data reflects the current trading day's activity, cached for 15 minutes to balance freshness with performance.
The key architectural insight behind Finmagine Trader is the intersection logic. Each individual screener returns 30-150+ stocks on a typical trading day. The extension computes which stocks appear across multiple screeners and surfaces those intersections in dedicated tabs. A stock appearing in Stage 2, simultaneously near its 52-week high, and trading on above-average volume is a fundamentally different — and higher conviction — candidate than one passing only a single filter.
Finmagine Trader runs 5 screeners in parallel, computes intersections, and presents results in under 10 seconds — every trading day, automatically. The same analysis that takes 45 minutes manually is completed before your morning coffee cools.
The extension requires no ChartInk account, no login credentials, no prior knowledge of scan clause syntax. It handles all of that internally. The trader's interface is simply: open the dashboard, look at the results, click to research the interesting ones further. The cognitive load of the scanning process is reduced to near zero.
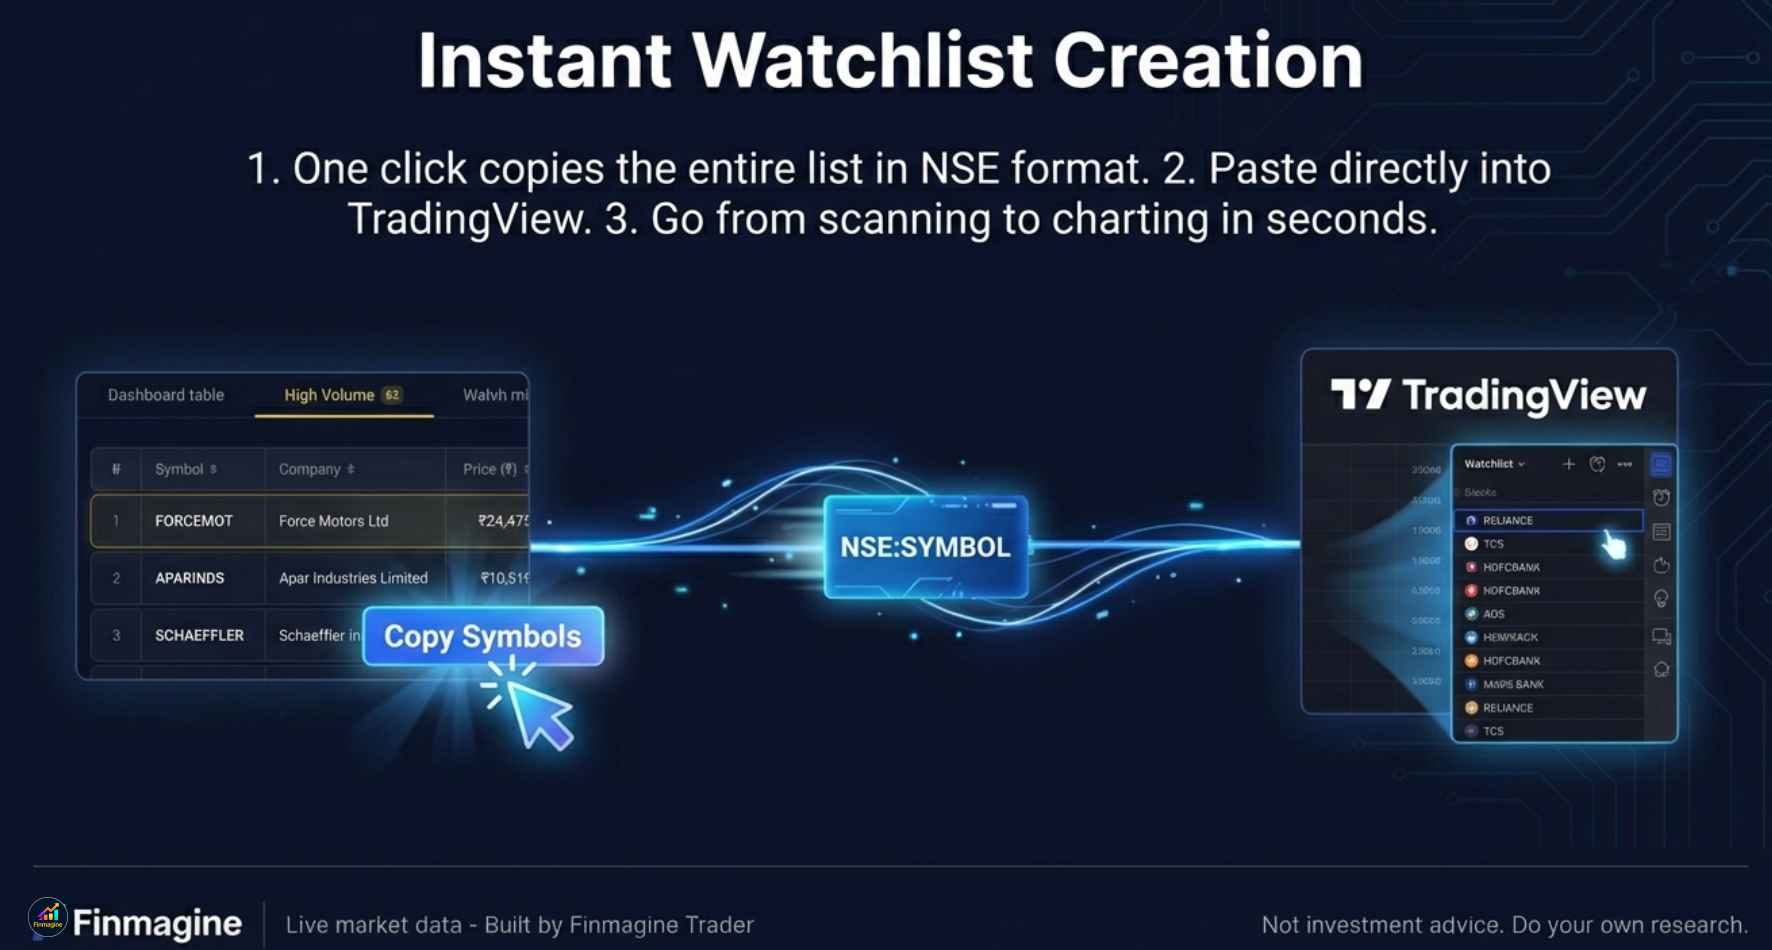
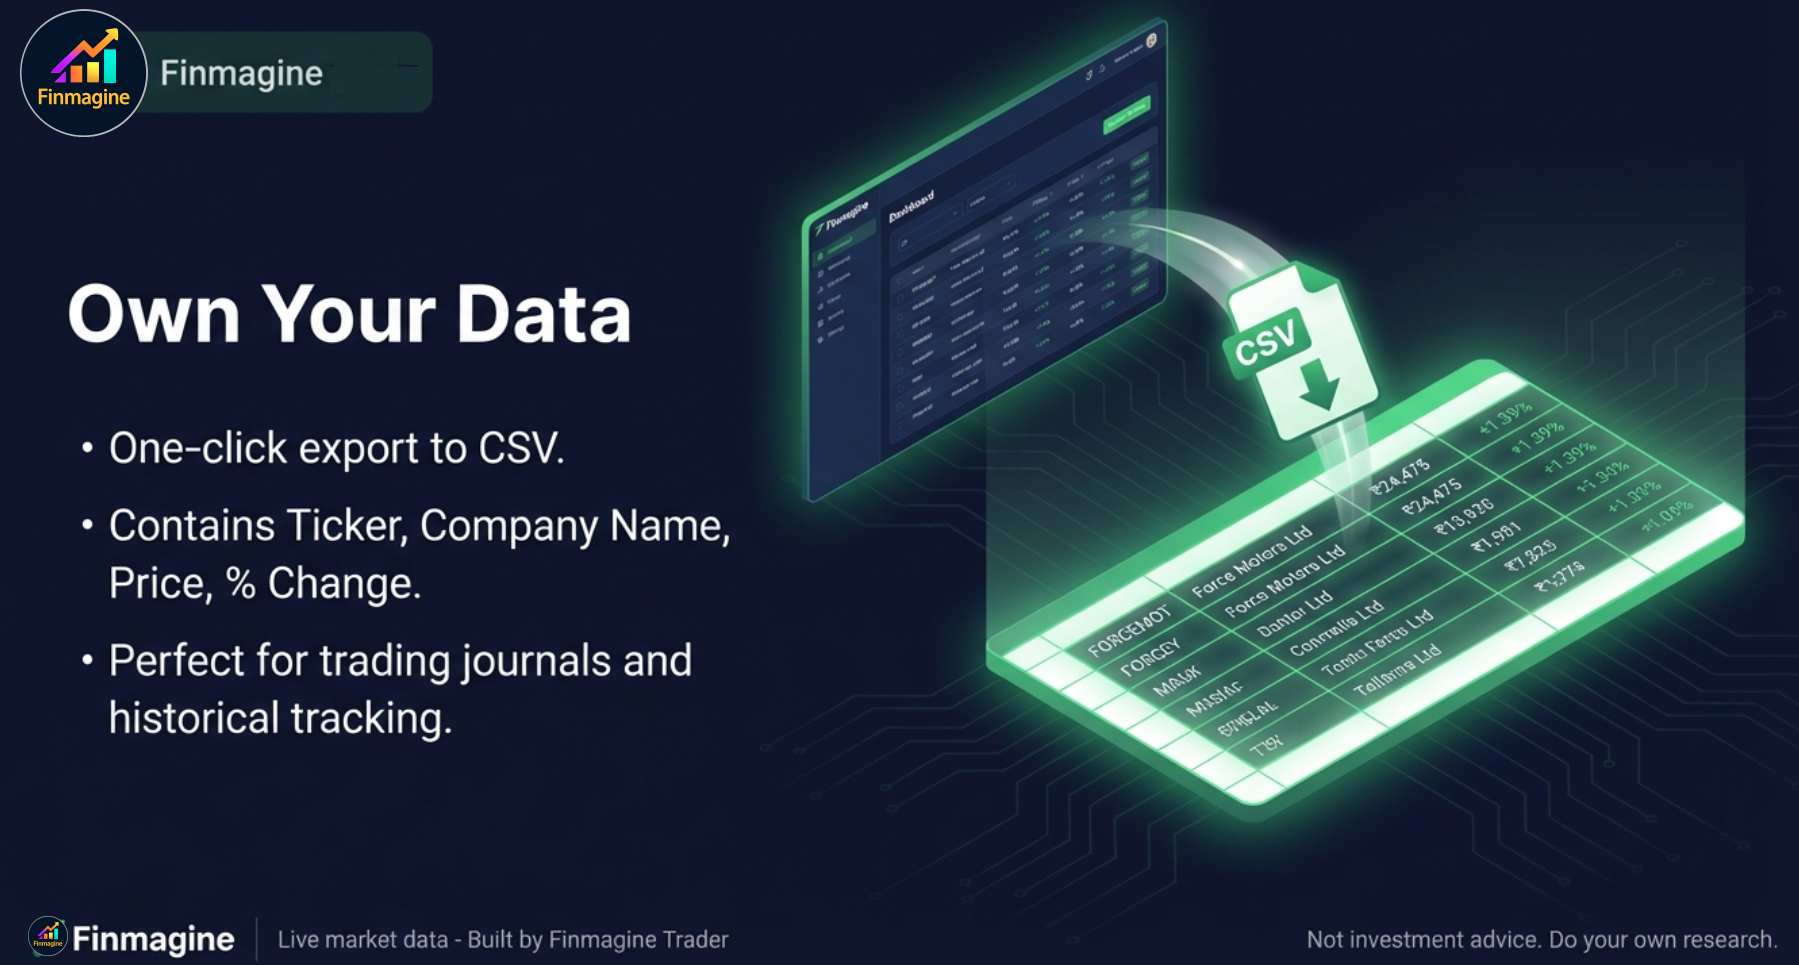
Two built-in features accelerate the next step in the workflow. The "Copy Symbols" button copies all tickers in the active tab in NSE:SYMBOL format — pasteable directly into TradingView's watchlist import. The "Export CSV" button downloads a file with Ticker, Company Name, Price, and Percentage Change — importable into TradingView or any portfolio tracking tool. From scan results to charting session takes fewer than 30 seconds.
What Finmagine Trader Is Not
It is not a buy/sell recommendation system. It does not tell you what to trade. It surfaces the stocks that currently meet multiple institutional momentum criteria simultaneously — what you do with that information is your decision, informed by your own chart analysis and risk assessment. Think of it as a pre-filtered starting list, not a trade signal.
The 7 Strategy Tabs Explained
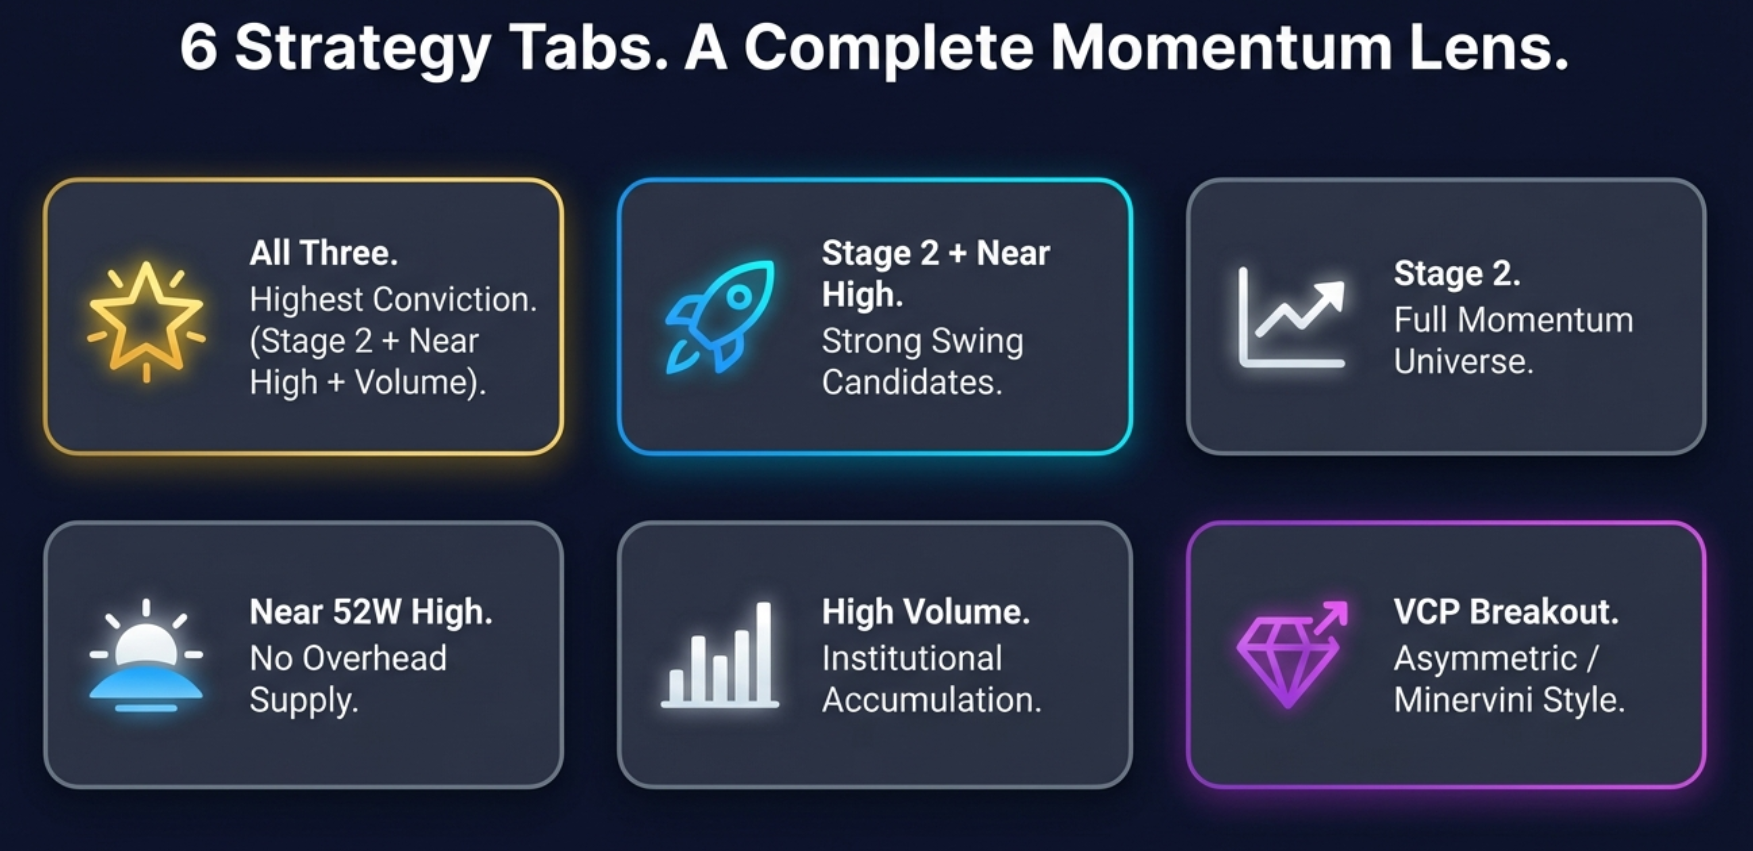
The dashboard presents seven tabs, each representing a different momentum lens. The tabs are ordered by conviction — the first tab shows the fewest stocks with the most signals confirmed simultaneously, while later tabs broaden the criteria to show larger universes. Understanding what each tab filters for — and why — lets you use the right tab for the right trading style.
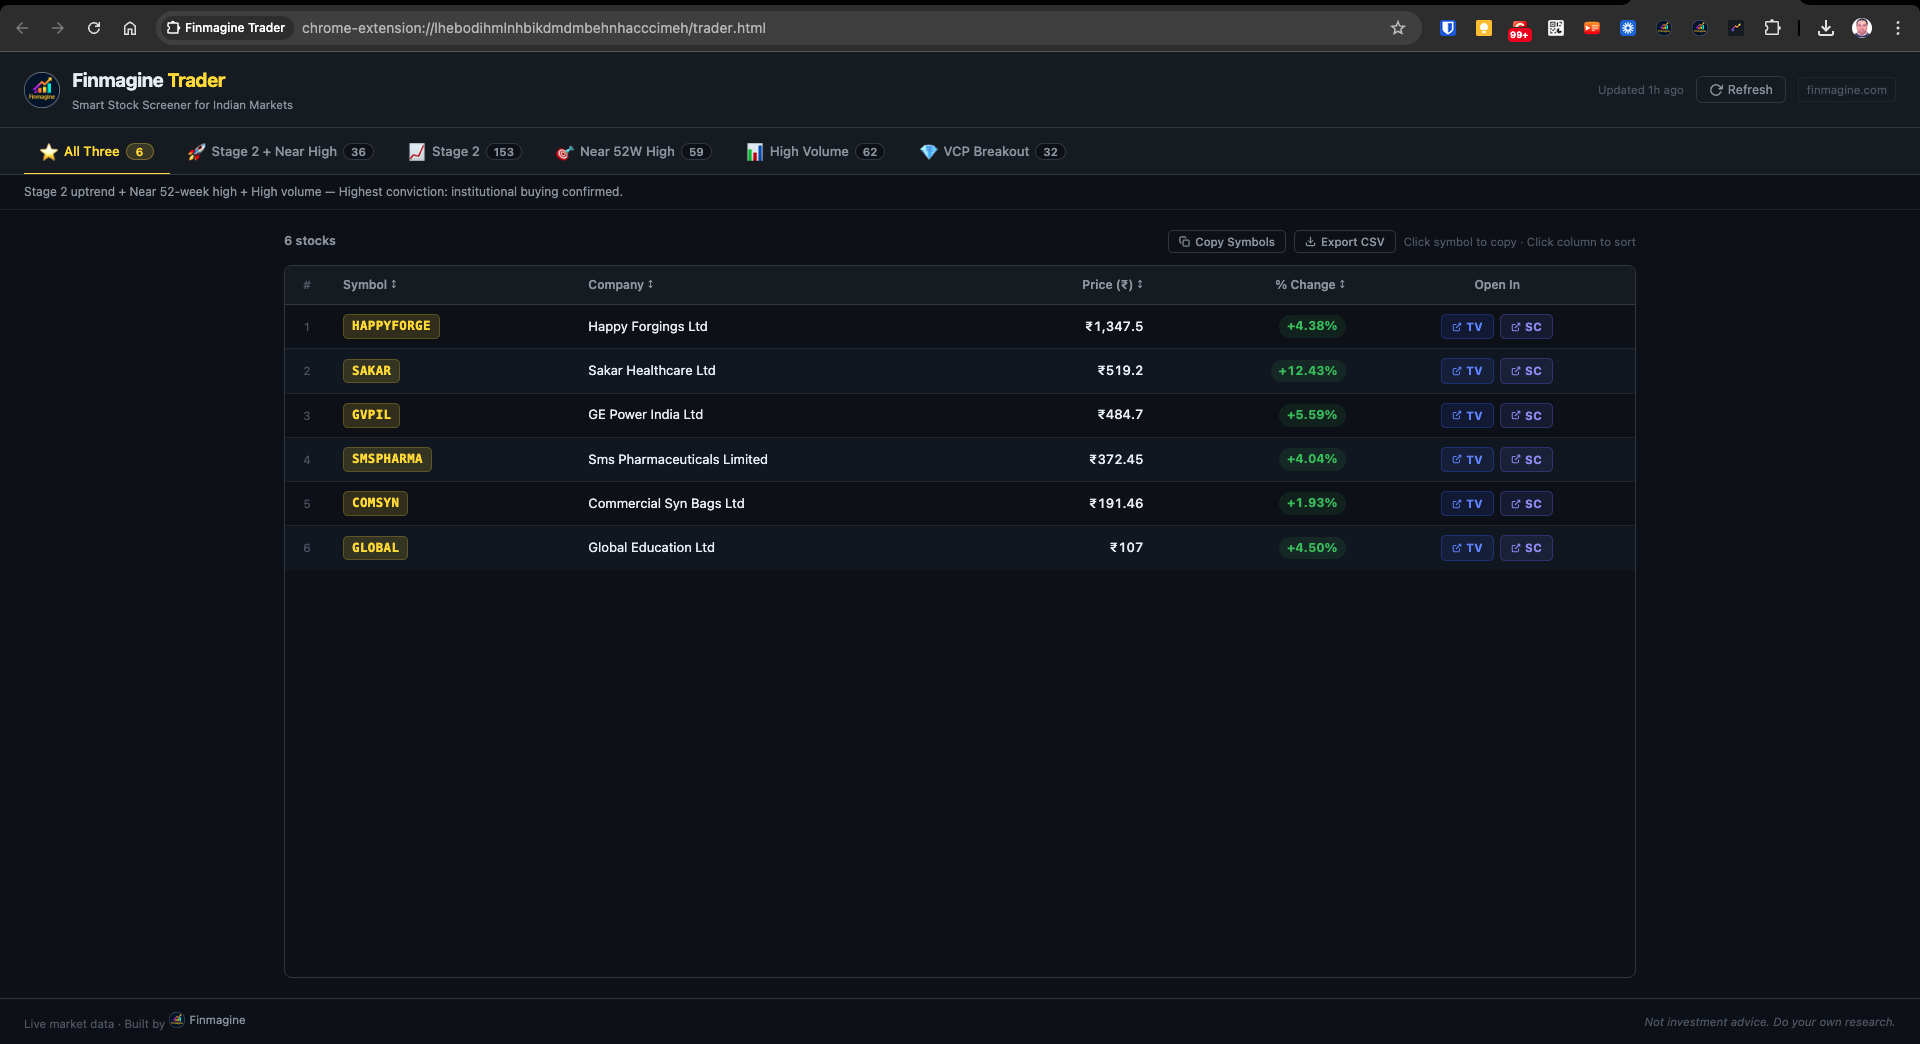
ALL THREE — Stage 2 + Near 52W High + High Volume
The most important tab of the seven. Shows only stocks that simultaneously pass Stage 2, Near 52-Week High, and High Volume criteria. On a typical trading day this returns 4-8 stocks. These are names where an institutional uptrend is in place, no overhead supply exists above current price, and institutional buying is confirmed through today's volume. All three independent signals agree — the highest-conviction subset of the day's momentum universe.
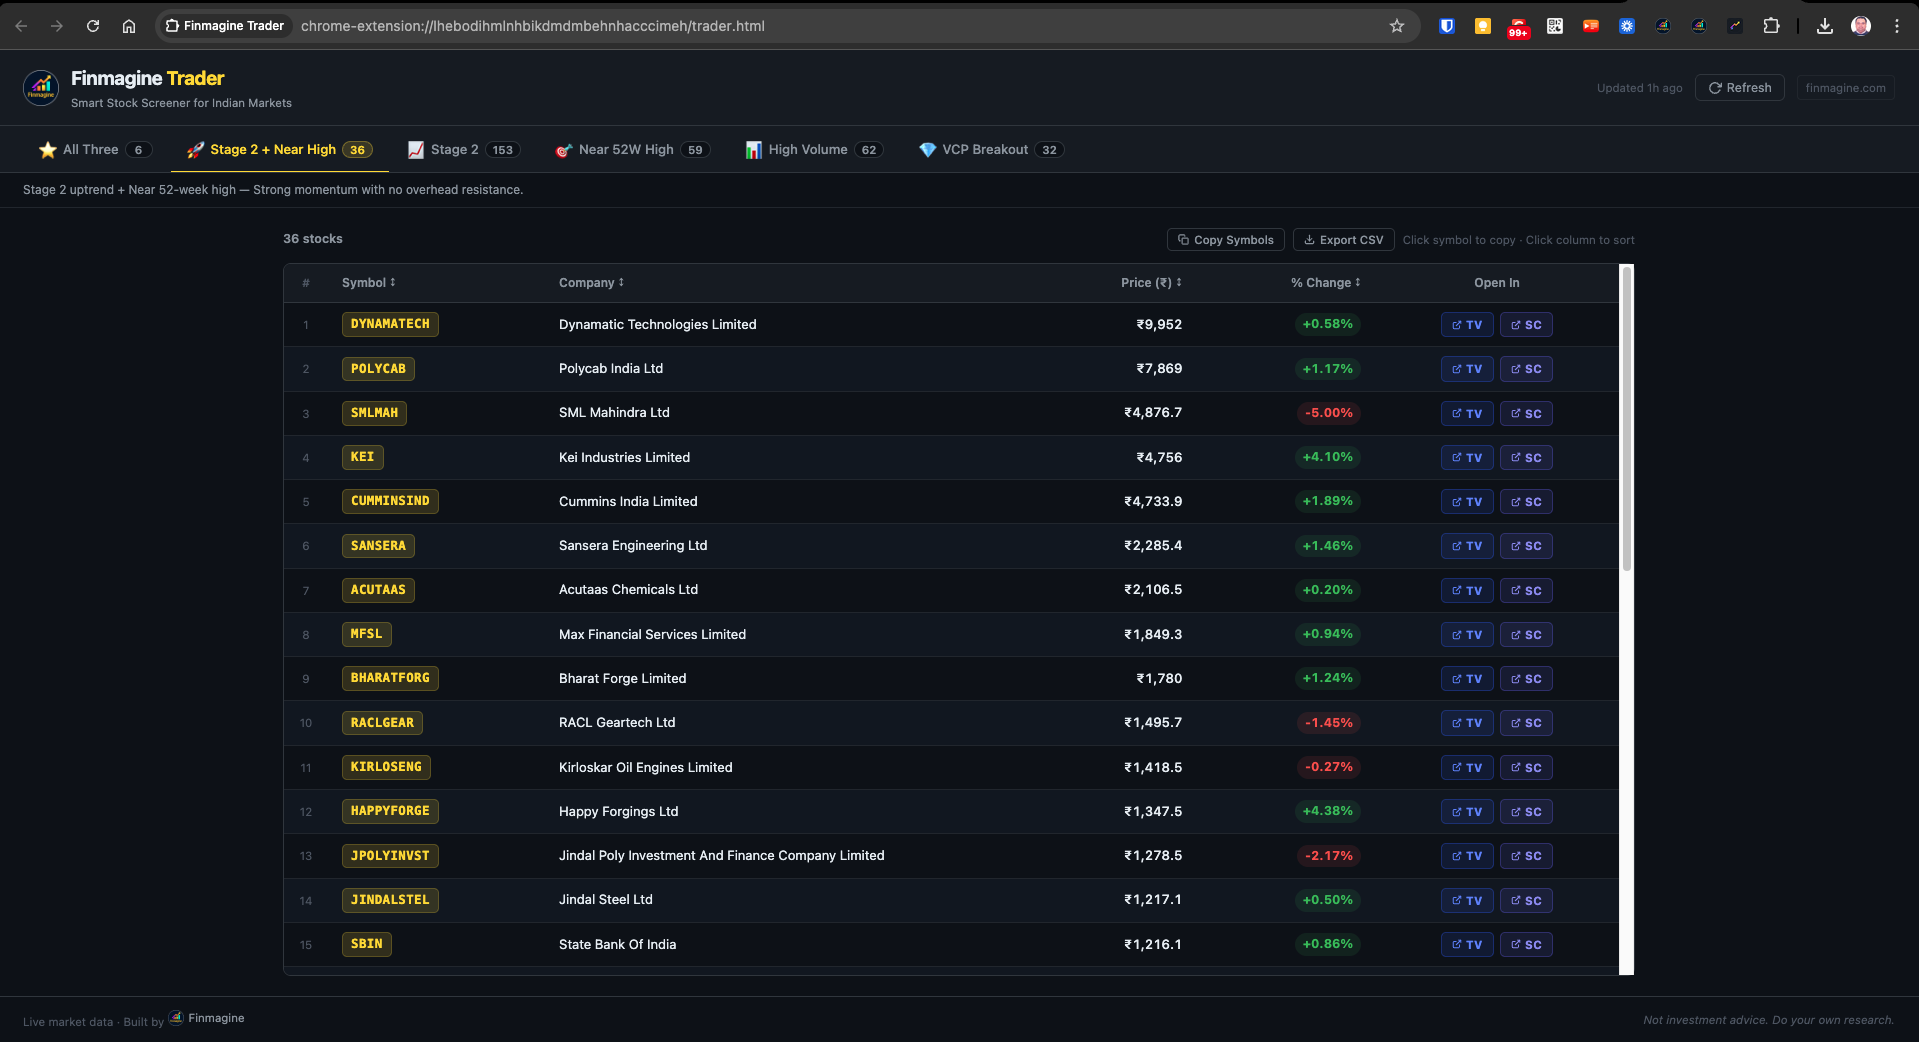
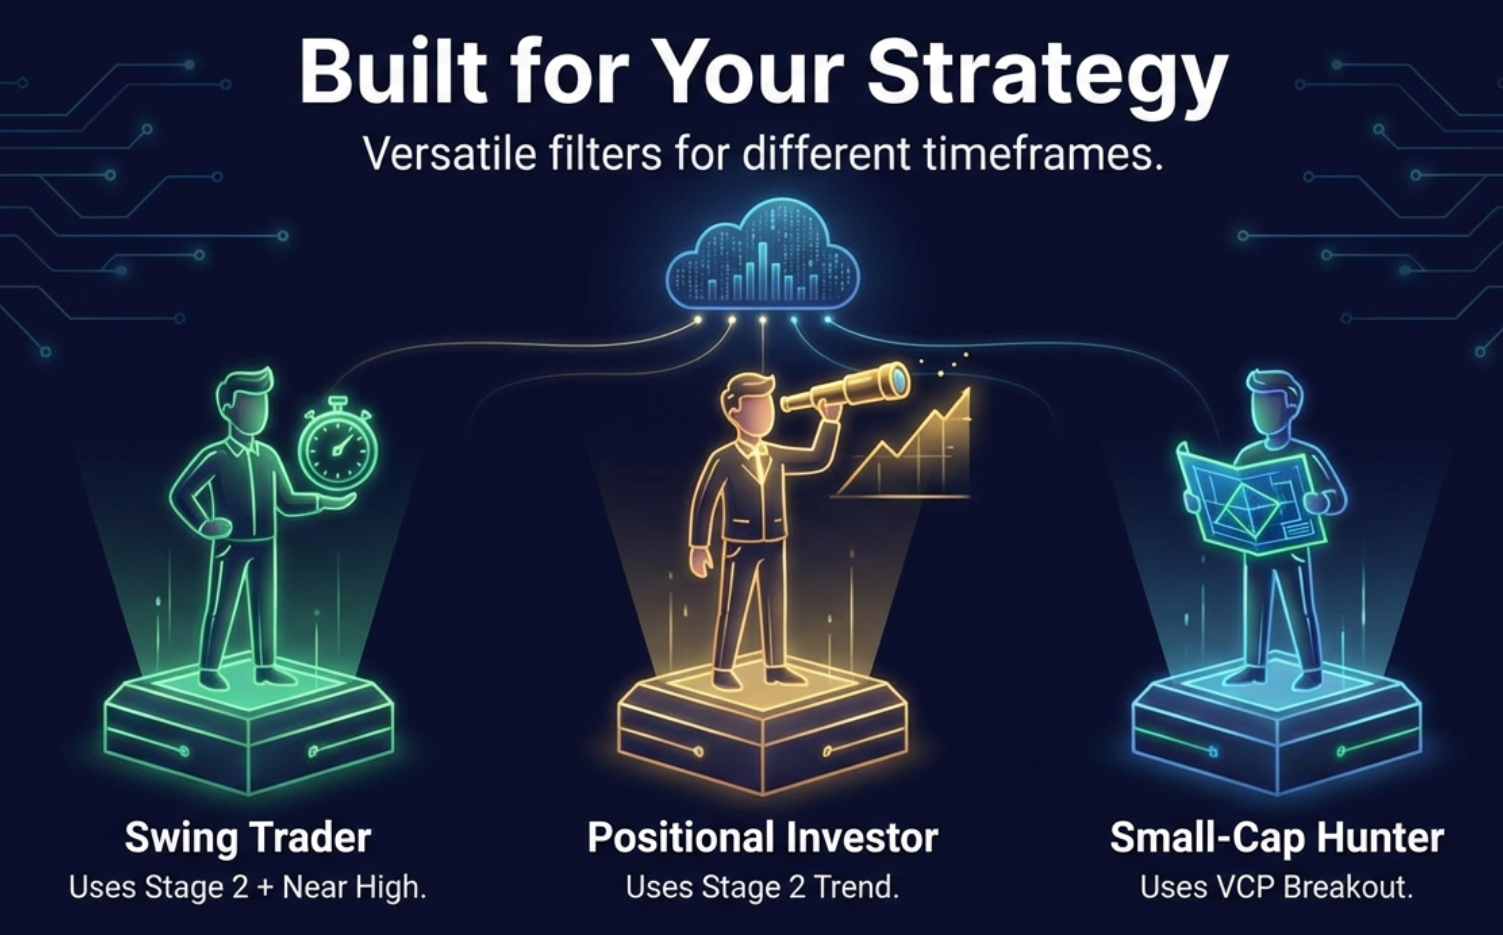
STAGE 2 + NEAR HIGH — The Swing Trader's Tab
Stocks in a confirmed Stage 2 institutional uptrend that are simultaneously near their 52-week high. No overhead resistance. Price is in discovery territory — every prior buyer is in profit, removing the supply pressure that typically caps rallies. Approximately 36 stocks on a typical day. These are the strongest candidates for swing trades (2-10 days) and short-to-medium positional plays where the reward-to-risk profile is cleanest.
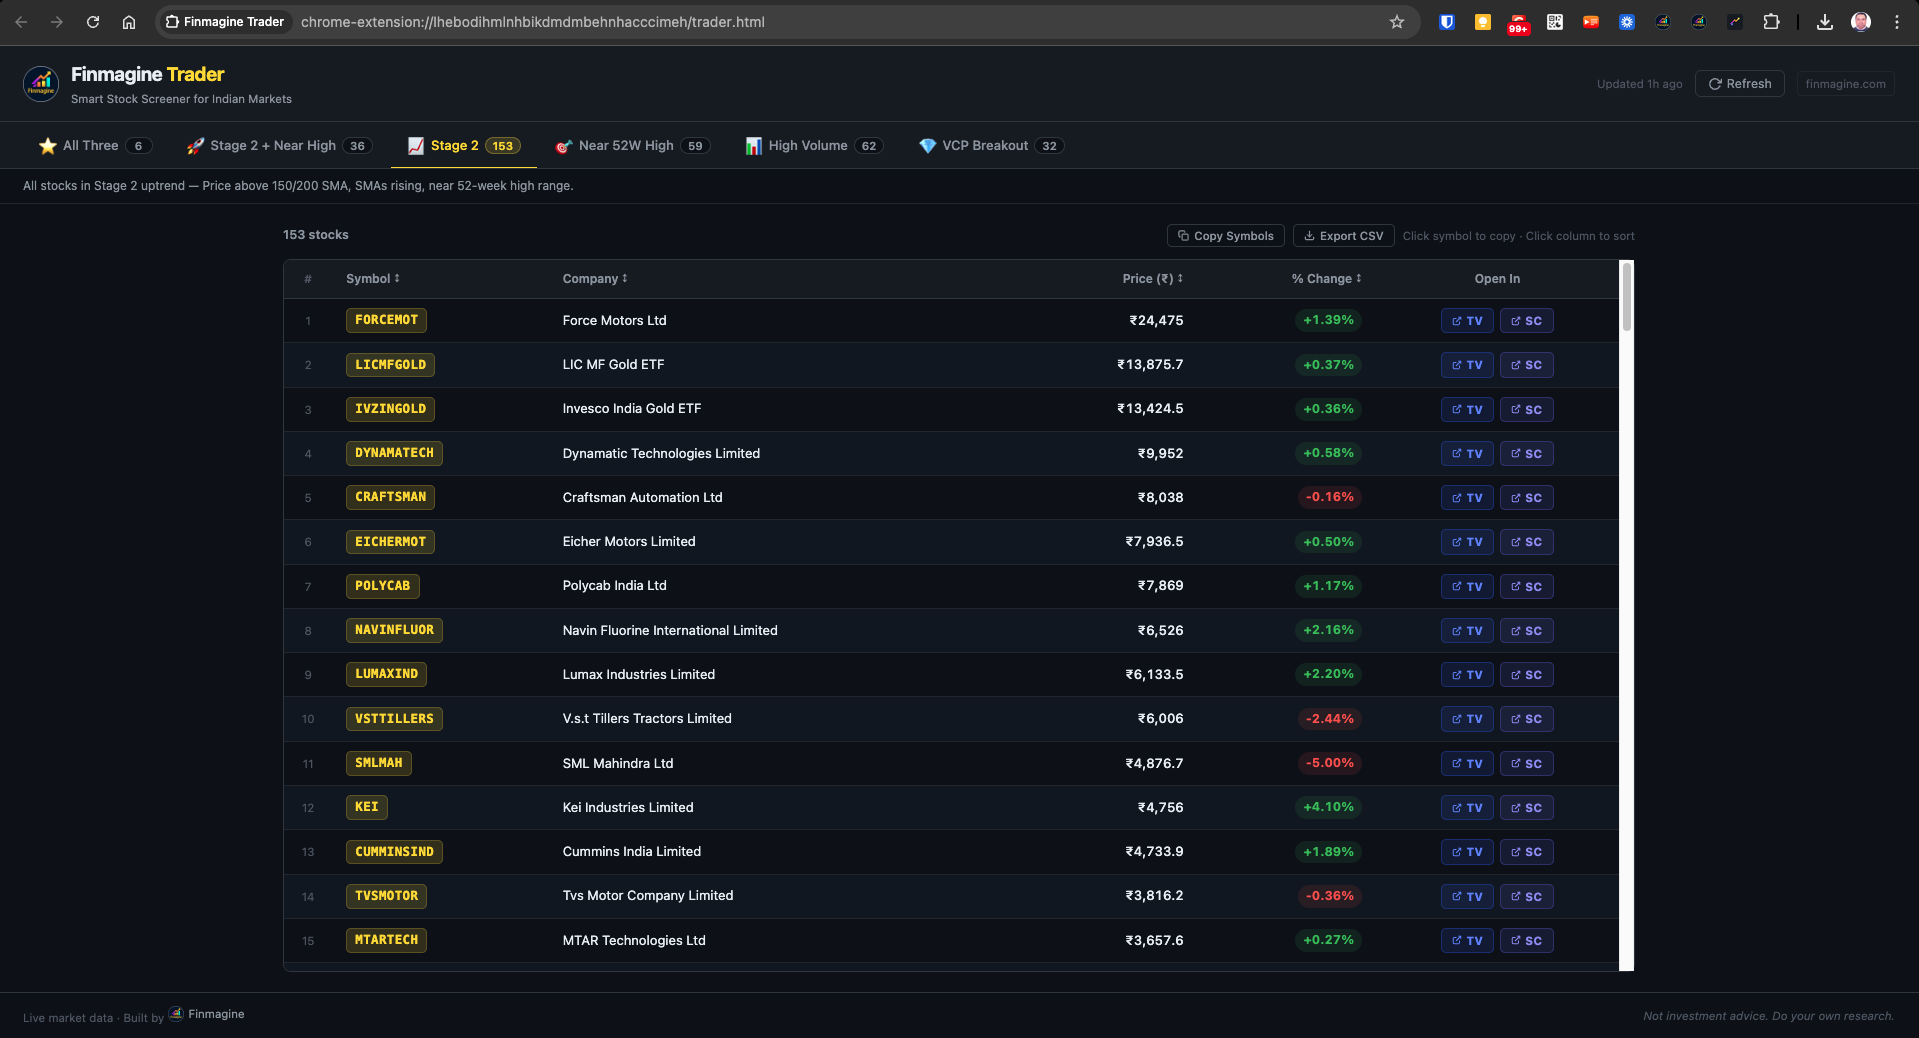
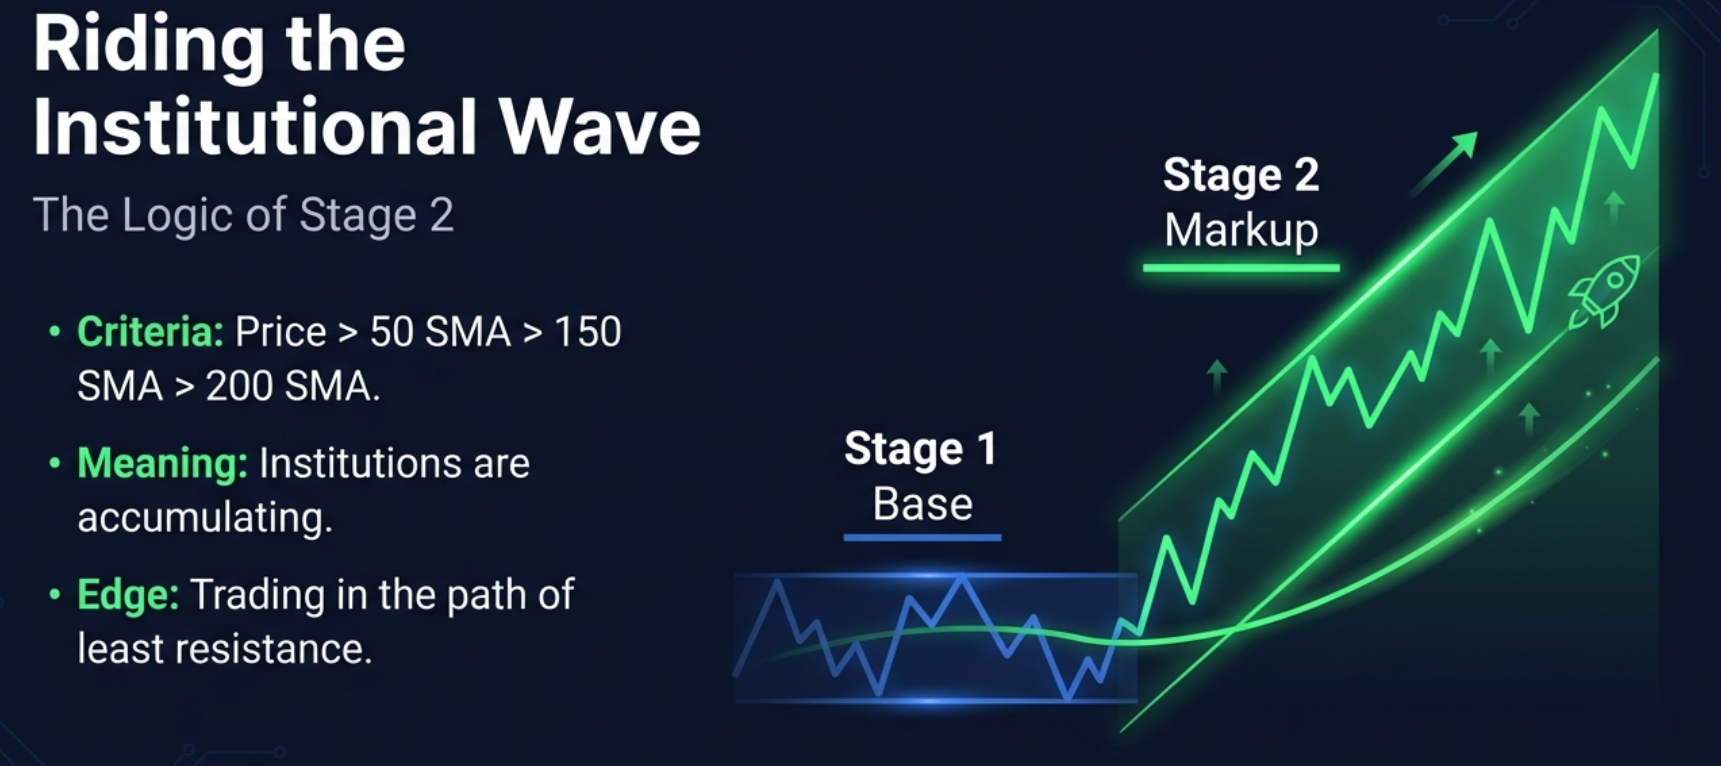
STAGE 2 — The Full Momentum Landscape
The broadest of the primary screeners. A stock in Stage 2 has its price above the rising 50-day, 150-day, and 200-day simple moving averages, with all three in proper alignment (50 SMA above 150 SMA above 200 SMA) and the 200 SMA trending upward. This is the Stan Weinstein definition of an institutional uptrend phase. Approximately 153 stocks on a typical day. Use this tab when you want to survey the full momentum landscape or identify stocks for longer-term positional watchlists.
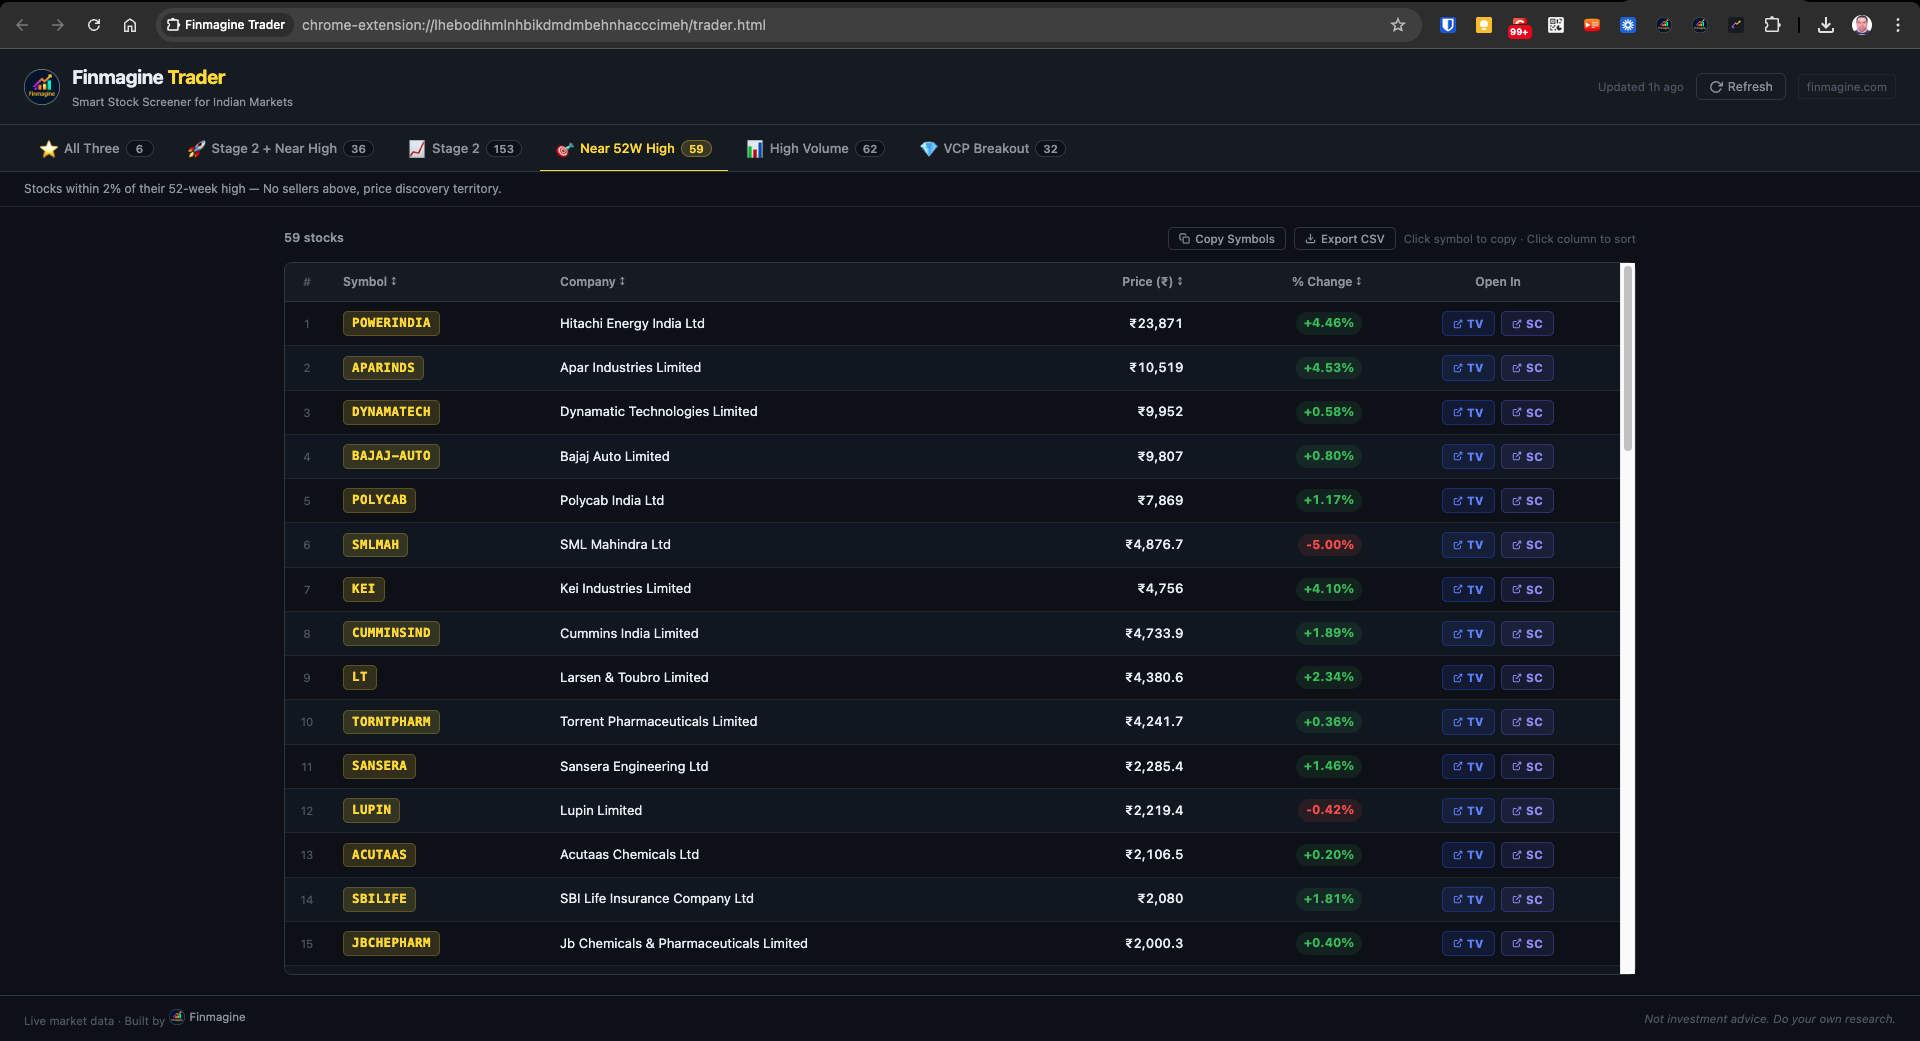
NEAR 52W HIGH — Discovery Territory
Stocks whose closing price is within 2% of their 52-week high. At this price level, every investor who has held the stock for the past year is in profit — meaning there is no supply pressure from trapped sellers waiting to break even. The stock is in price discovery territory. Approximately 59 stocks on a typical day. This is particularly powerful when combined with Stage 2 (filtered in the second tab) because it confirms no-overhead-resistance in a confirmed uptrend.
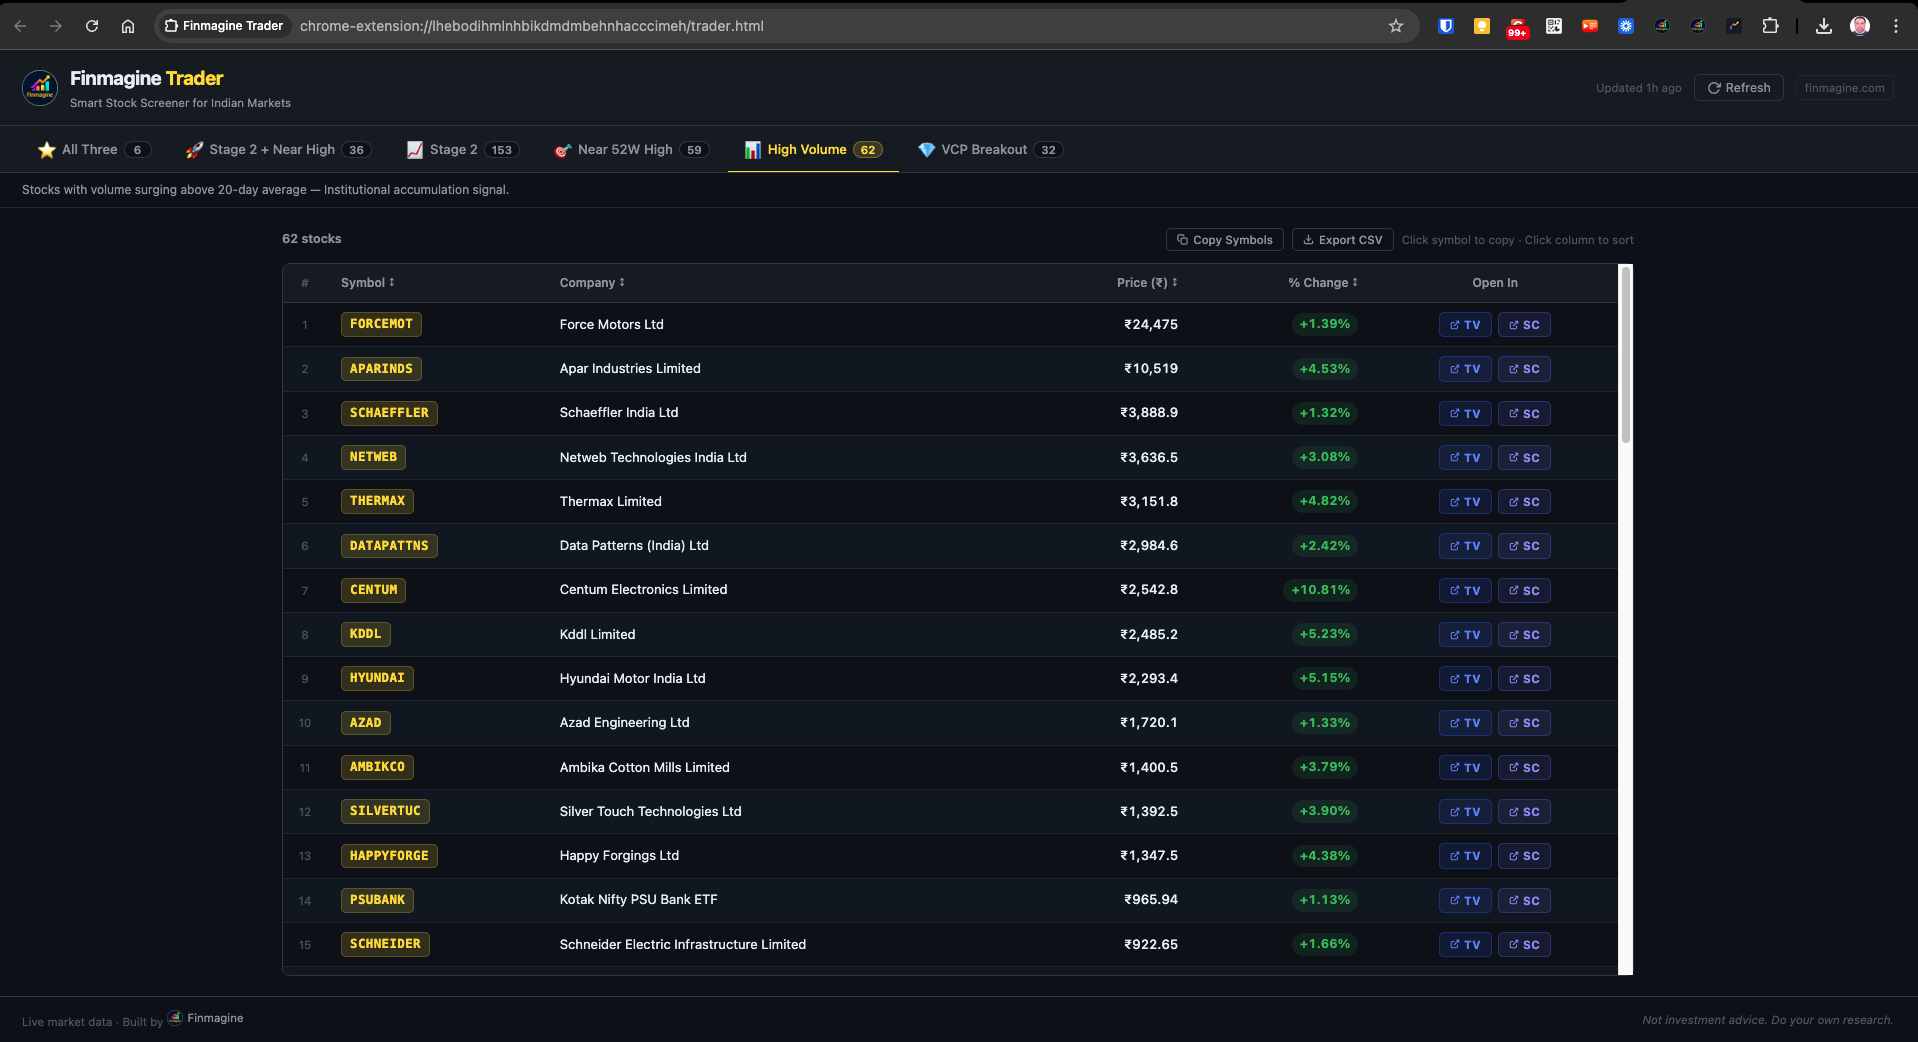
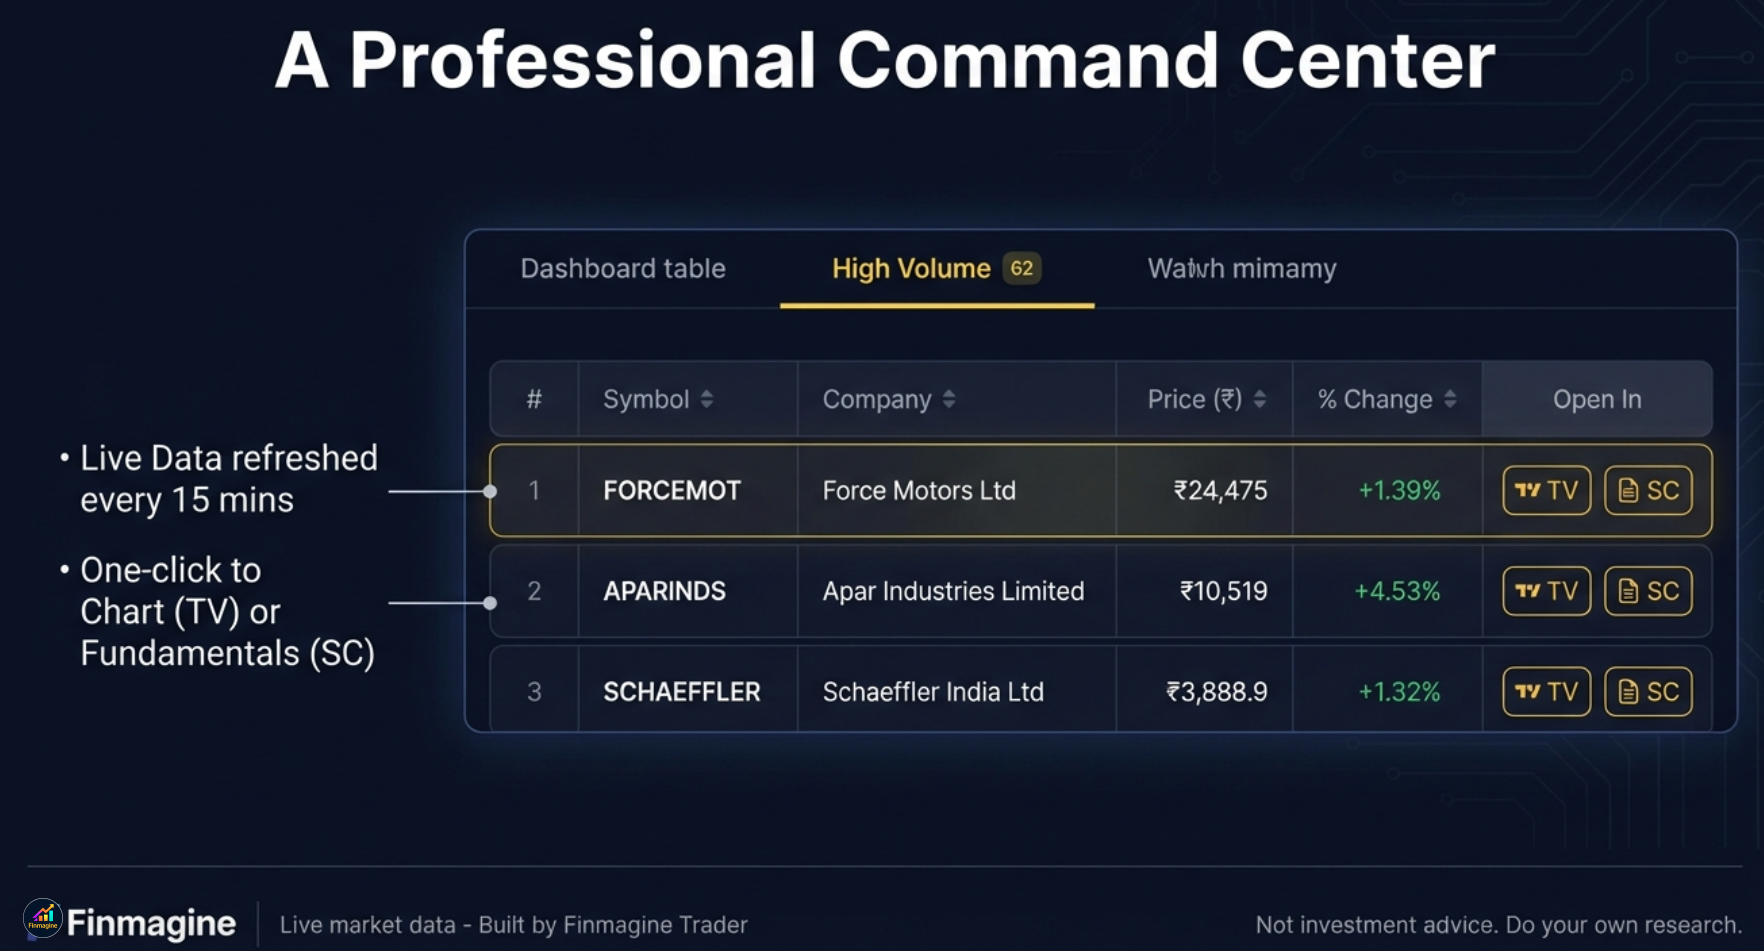
HIGH VOLUME — Institutional Accumulation
Stocks where volume is surging above the 20-day average alongside positive price action, filtered to exclude F&O (Futures and Options) stocks. The F&O exclusion is deliberate — non-derivative cash market stocks with volume surges represent cleaner institutional accumulation signals without the noise of derivative-driven activity. Approximately 62 stocks on a typical day. Volume is the footprint of institutional money — when volume surges in the direction of price, it confirms that large buyers are active.
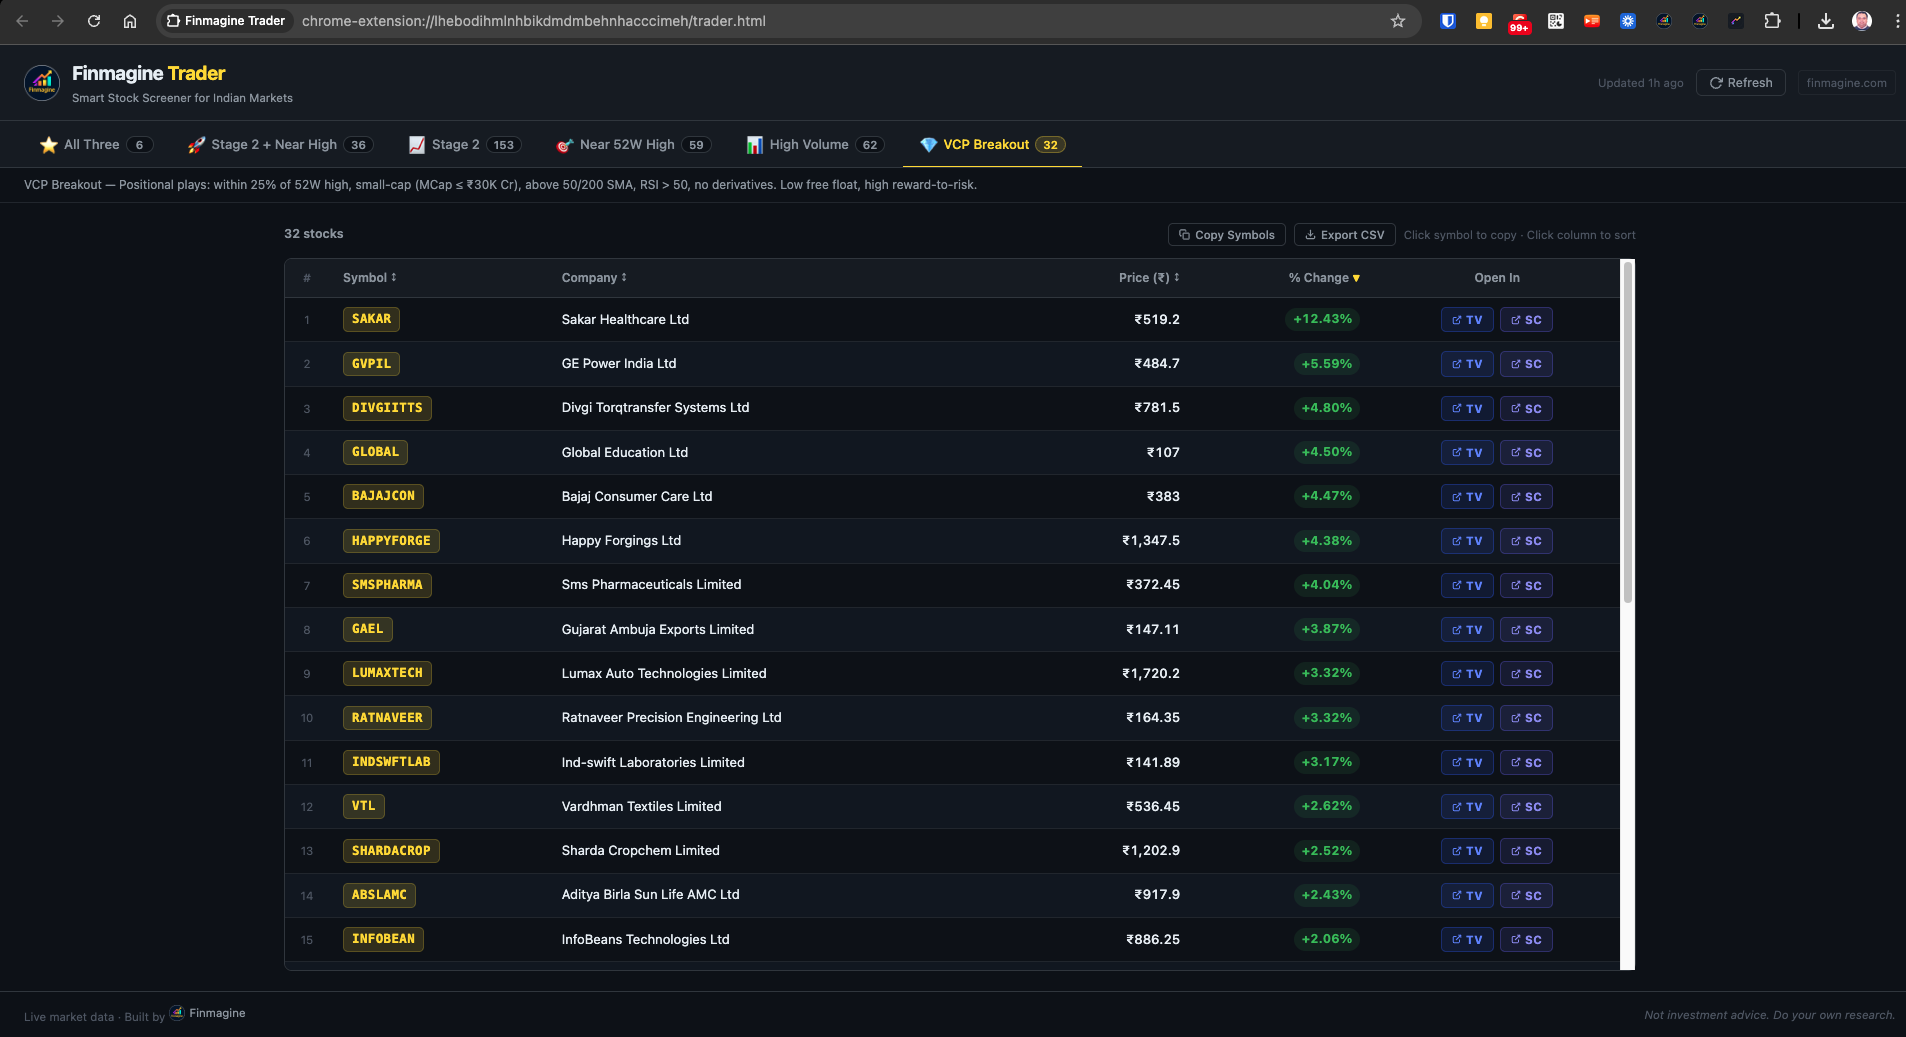
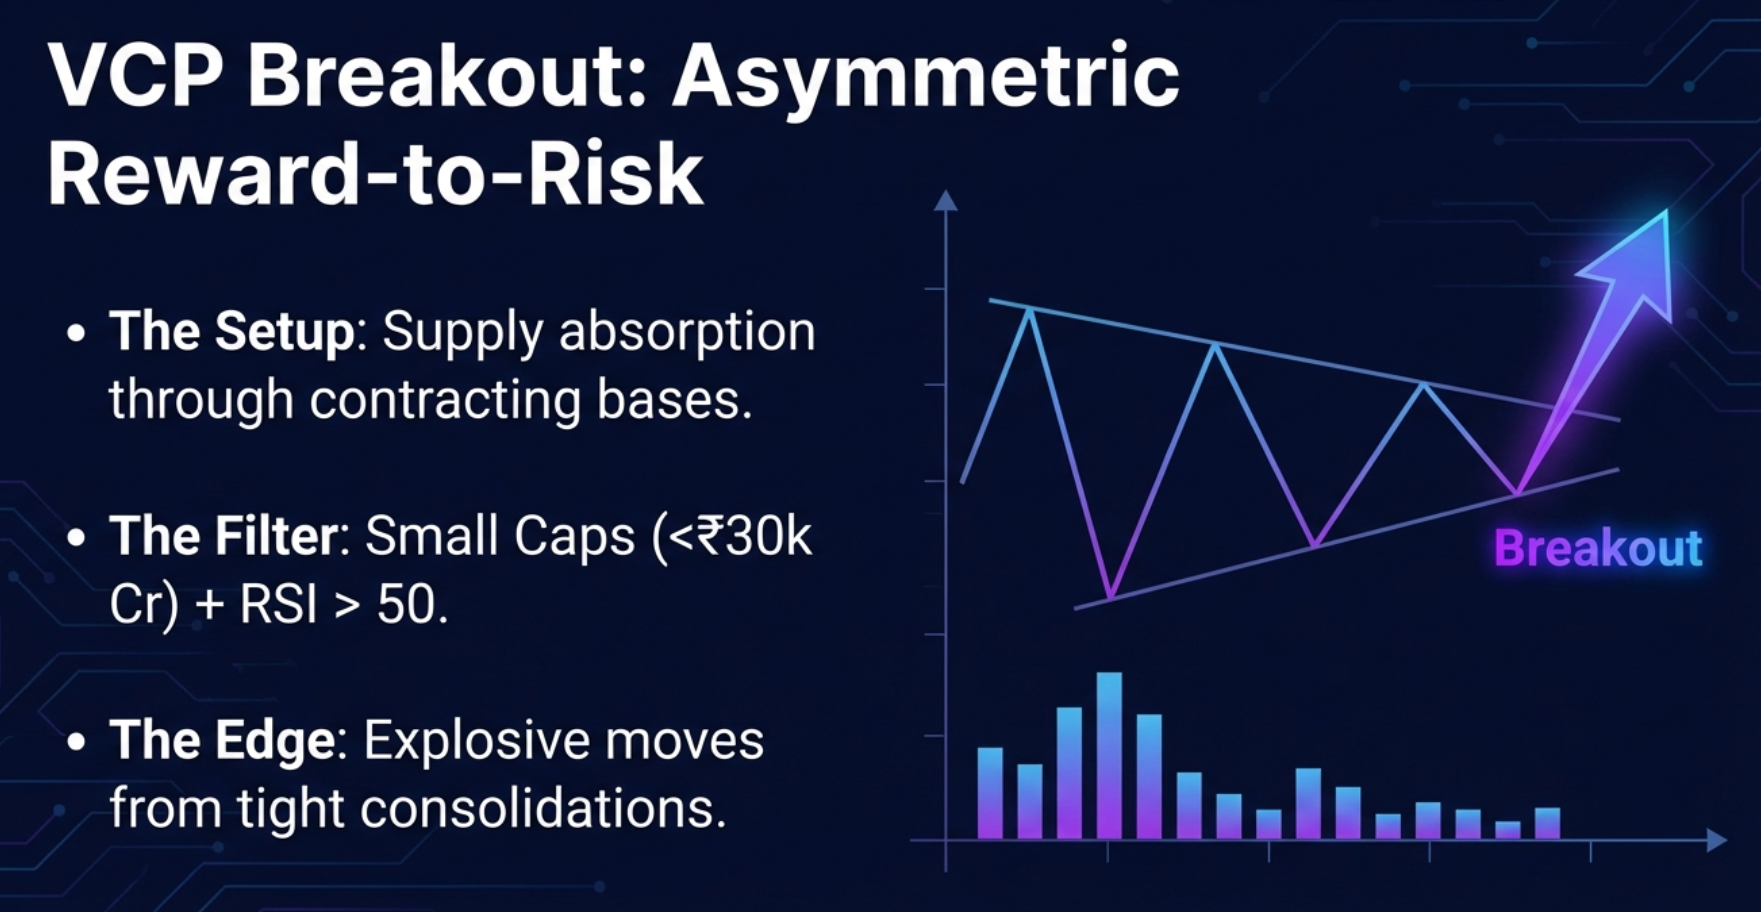
VCP BREAKOUT — Minervini's Setup
Mark Minervini's Volatility Contraction Pattern identifies stocks where price range contracts in successive bases before a breakout — indicating that supply is being absorbed by institutional buyers. Finmagine Trader's VCP filter adds specific criteria: Market Cap at or below ₹30,000 Crore (small-cap focus for larger percentage moves), price above both 50-day and 200-day SMAs, RSI above 50 confirming momentum, and no derivatives overlay (non-F&O). Approximately 32 stocks on a typical day. These are positional setups with asymmetric reward-to-risk — small-caps that institutions are quietly accumulating before a potential explosive move.
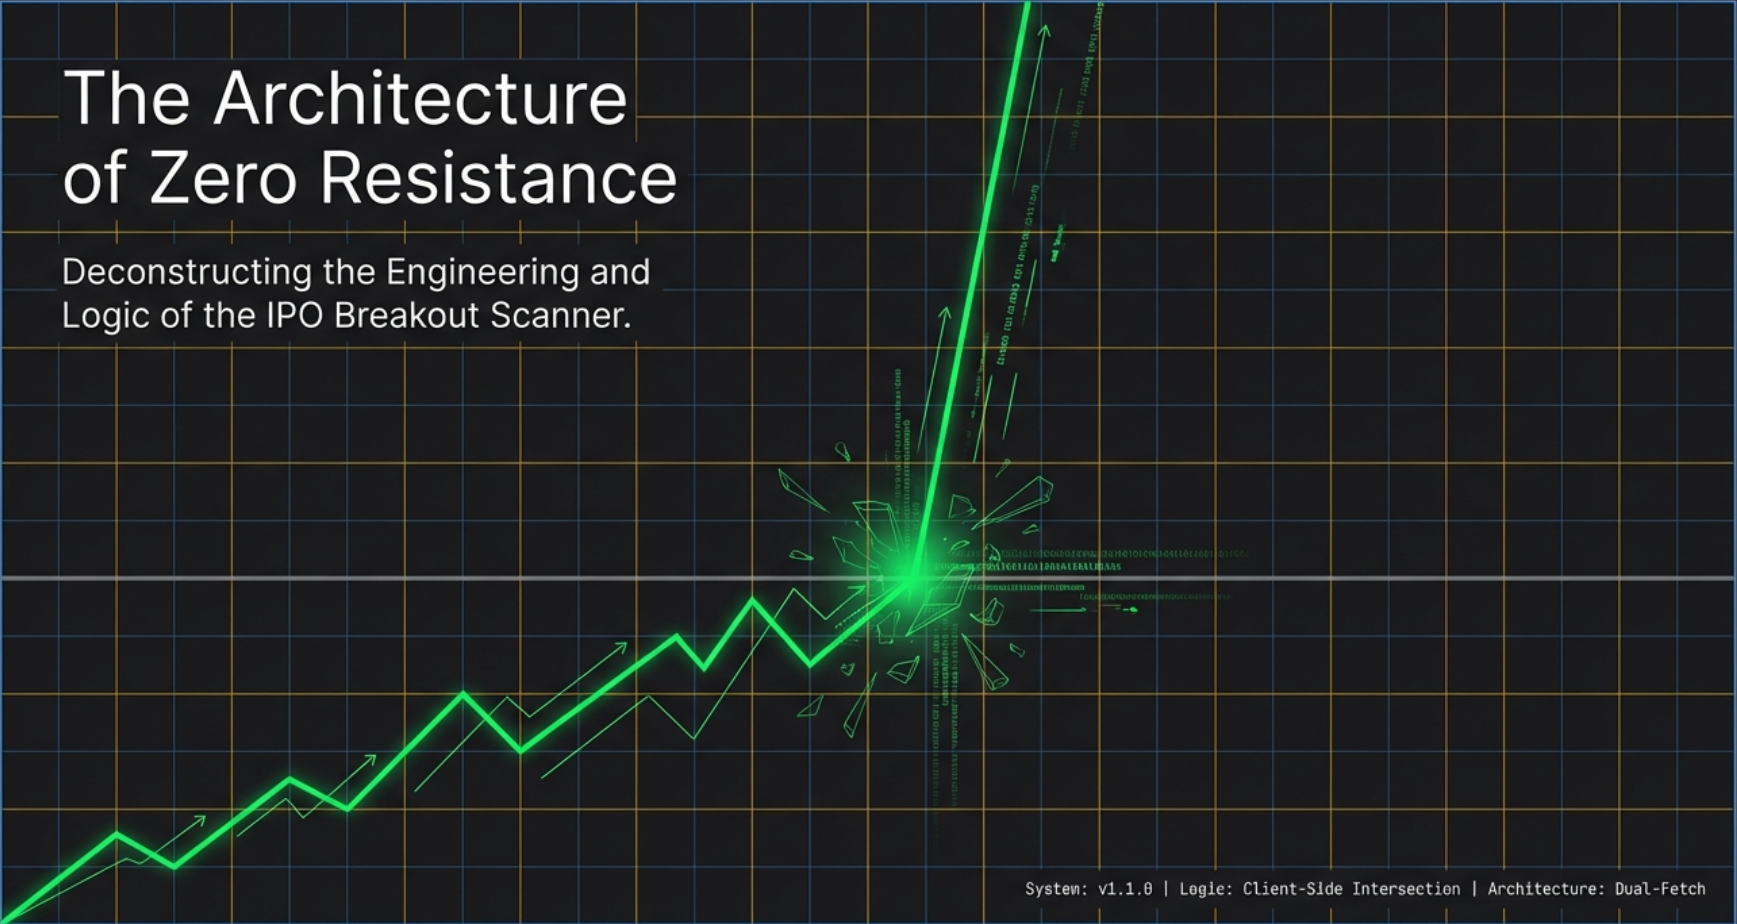
IPO BREAKOUT — Pure Price Discovery
The seventh tab targets a structurally unique setup: recently listed stocks (those without a 200-day SMA, indicating listing within the last ~10 months) that are approaching or at their all-time high on above-average institutional volume. Because these stocks have no price history above their current level, there are no prior buyers trapped above the price — zero overhead supply. The scanner uses a dual-fetch architecture to identify this universe, since most screener platforms don't expose a listing-date filter directly. Returns 0–5 stocks on most days. Zero is the correct output — this tab is a precision alert system, not a daily research feed. For the full architecture breakdown, see Article 6.
How to Choose Which Tab to Use
For daily focus: Start with All Three — it is the daily shortlist that deserves the most attention.
For swing trading ideas: Stage 2 + Near High gives the cleanest setups for 2-10 day holds.
For positional research: Browse Stage 2 for longer-term momentum candidates.
For small-cap asymmetric plays: VCP Breakout is purpose-built for this style.
For recently listed IPO opportunities: Check the IPO Breakout tab — zero results is normal and correct; when it speaks, pay close attention.
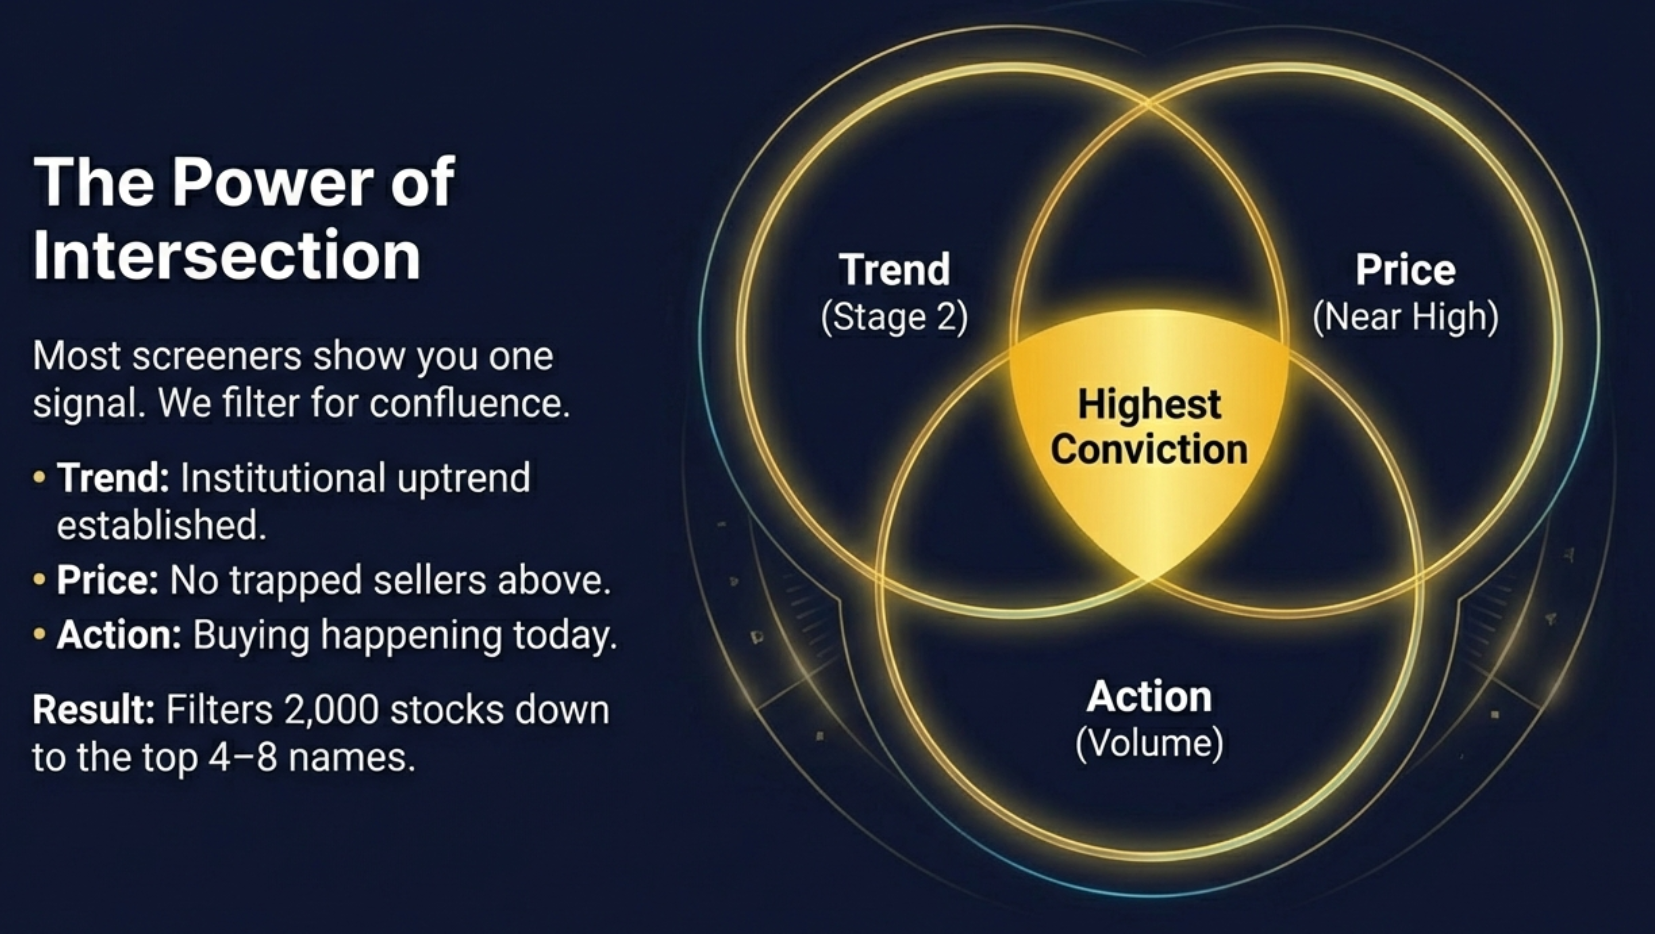
The Investment Logic Behind the Intersection
Each screener in Finmagine Trader captures a distinct, independently valid signal. Stage 2 confirms that institutions have established a long-term uptrend — the stock is being systematically accumulated over time. Near 52-week high confirms that this accumulation has pushed price into territory where no prior sellers are trapped above current levels. High Volume confirms that institutional activity is occurring today — not just historically, but in the present session.
When all three signals fire simultaneously on the same stock, they provide independent confirmation from three different angles: trend, price position, and current activity. The probability of a false signal is substantially lower when three independently constructed filters agree than when any single filter fires alone.
| Signal | What It Confirms | Stocks Found Alone | All Three Combined |
|---|---|---|---|
| Stage 2 | Institutional long-term uptrend in place | ~153 | ~6 |
| Near 52W High | No overhead supply, price in discovery territory | ~59 | ~6 |
| High Volume | Active institutional buying confirmed today | ~62 | ~6 |
The mathematics of intersection are powerful. Stage 2 alone returns over 150 candidates. Near 52-week high alone returns nearly 60. High volume alone returns over 60. If these screeners were random, their intersection would contain roughly 60 stocks (assuming 5,000 NSE stocks and independent 3% hit rates). The fact that only 4-8 stocks typically make the cut reflects that these signals are correlated — meaning stocks that pass all three are genuinely exceptional rather than coincidental intersections.
The stocks in the All Three tab have: an institutional uptrend confirmed over months (Stage 2) + no trapped sellers above current price (Near 52W High) + institutional buying confirmed today (High Volume). Three independent signals. One extremely small list. Maximum conviction.
This does not mean every stock in the All Three tab will go up. No screener guarantees that. What it means is that these stocks carry a constellation of characteristics associated with continuation moves in the research literature on momentum investing. They are worth examining on the chart. They deserve to be on your watchlist. Whether to trade them — and at what price, with what position size, and with what exit plan — remains the trader's judgment call.
"The screener finds the candidates. The chart tells you whether the candidate is ready. Your risk management tells you how much to bet. All three together constitute a complete process — the screener alone is just the first filter."
How to Install and Use Finmagine Trader
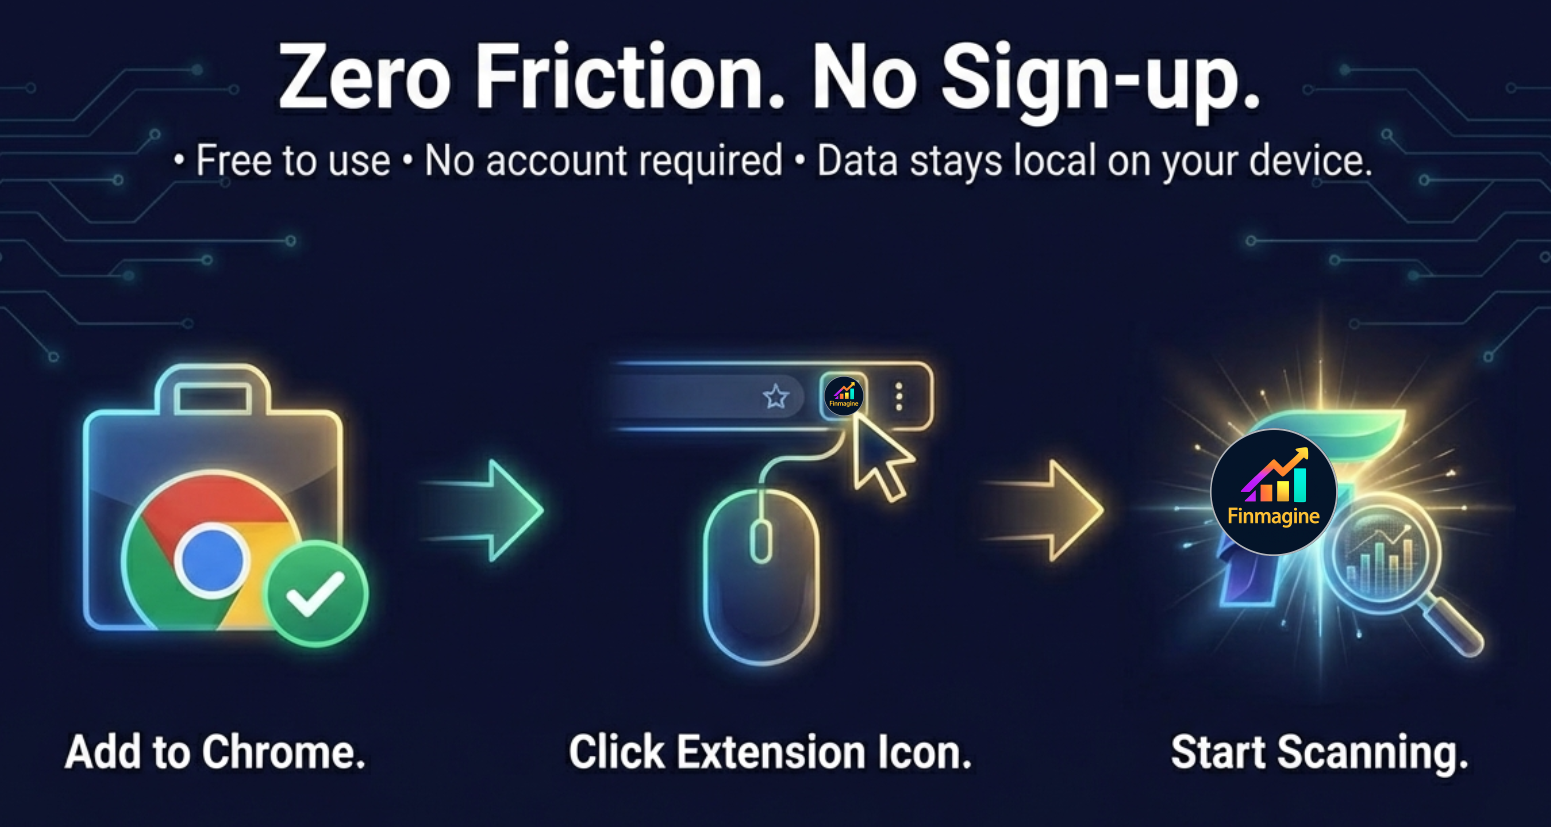
The installation process is identical to any other Chrome extension. There is no backend account to create, no email to verify, no payment to process. The extension is entirely self-contained in your browser.
Add to Chrome
Visit finmagine.com/finmagine-trader.php and click the "Add to Chrome" button. The Chrome Web Store page opens — click "Add to Chrome" once more to confirm. The extension installs in under 10 seconds.
Click the Extension Icon
From any Chrome tab — whether you are reading news, checking email, or browsing charts — click the Finmagine Trader icon in the Chrome toolbar. A full-page dashboard opens immediately in a new tab.
Data Loads Automatically
All five screeners begin fetching in parallel the moment the dashboard opens. Within 10 seconds, all seven tabs are populated with live NSE data. No clicking "refresh," no waiting for individual loads. Everything arrives together.
Start With All Three
Click the "All Three" tab first. This is the day's highest-conviction list — the stocks simultaneously passing Stage 2, Near 52-Week High, and High Volume. On most days you will see 4-8 stocks. These deserve your first attention.
Chart and Research
Each row in the results table has two quick-action buttons. Click TV to open the stock's TradingView chart immediately. Click SC to open Screener.in for fundamental data — quarterly results, balance sheet, shareholding pattern, and more.
Best Time to Use Finmagine Trader
Before market open (9:00-9:15 AM): Check results from the previous day's close to prepare your watchlist for the session.
During market hours: Data refreshes every 15 minutes, reflecting intraday price moves that push stocks in or out of the screeners.
After close (3:30 PM onwards): The day's final results are stable. Ideal for building tomorrow's watchlist and researching VCP and Stage 2 candidates.
Copy Symbols and Export to TradingView
Finding momentum candidates is only half the workflow. The other half is getting those candidates into your charting environment quickly so you can assess whether they are genuinely set up for a trade. Finmagine Trader provides two built-in features that make this frictionless.
Copy Symbols — Instant TradingView Watchlist
Every tab in the dashboard has a "Copy Symbols" button. Clicking it copies all tickers in the active tab to your clipboard in NSE:SYMBOL format — for example, NSE:HAPPYFORGE,NSE:AXISBANK,NSE:TITAN. This exact format is what TradingView expects for bulk watchlist imports.
To use it: click "Copy Symbols" in Finmagine Trader, switch to TradingView, open your Watchlist panel, click the three-dot menu, select "Import Watchlist," and paste. All the tickers appear in your TradingView watchlist instantly. You can then flip through charts at full speed without typing a single ticker name.
Export CSV — Spreadsheet and Advanced Tracking
The "Export CSV" button downloads a structured file with four columns: Ticker (in NSE:SYMBOL format), Company Name, Current Price, and Percentage Change for the day. The NSE:SYMBOL format in the Ticker column allows TradingView to recognise the CSV import automatically. For traders who maintain position logs or portfolio tracking spreadsheets, the CSV provides a clean snapshot of that day's momentum universe in the chosen tab.
Open dashboard (10 sec) → Review All Three tab (2 min) → Copy Symbols → Paste into TradingView (30 sec) → Flip through charts → Identify trade setups. Total time from extension click to chart review: under 5 minutes.
What the Numbers Look Like on a Typical Day
Understanding the typical output from Finmagine Trader helps set expectations and calibrate how to use each tab. These numbers represent a representative trading day in a normal market environment — they will be higher on strong trending days and lower during corrections or periods of narrow market breadth.
All Three
Stage 2 + Near 52W High + High Volume simultaneously — the day's highest-conviction list
Stage 2 + Near High
Strong swing and positional candidates with confirmed uptrend and no overhead supply
Stage 2
Full universe of NSE stocks in confirmed institutional uptrend phase
Screeners Run
All five screeners fetched simultaneously in a single parallel session
The All Three Count as a Market Breadth Signal
These numbers fluctuate daily with market conditions. On strong bullish days — particularly during confirmed uptrends with broad participation — the All Three count can rise to 15-20+ stocks. On corrective days or during narrow markets where only a few sectors are participating, it can fall to 2-3. When it drops to 0, that itself is valuable information: the market currently has no stocks simultaneously meeting all three institutional momentum criteria. This is a signal to reduce position sizing or remain patient in cash rather than forcing trades in a low-confirmation environment.
The VCP Breakout tab tends to run counter-cyclically within bull markets. In choppy, rotational markets where the All Three count is low, VCP setups sometimes increase — because volatility contraction often occurs during brief consolidations within larger uptrends, and these consolidations are more common when the broader market is pausing. VCP traders often find the best setups when the rest of the dashboard looks quiet.
Privacy and Security
Finmagine Trader is built on a simple architectural principle: your data should never leave your machine unless you explicitly choose to share it. The extension operates entirely within your browser. There are no Finmagine servers in the data path. No analytics tracking your specific scan results. No account creation that stores your session data in a database.
When you open the dashboard, the extension makes direct requests to screener APIs using your browser's standard HTTP session — the same session your browser uses for any other web request. The data flows directly from the source to your browser's memory and is rendered on screen. It does not pass through any intermediary server operated by Finmagine.
Technical Privacy Details
No data leaves your machine: All screener fetching happens directly in your browser using declared host permissions.
No user tracking: The extension does not track which stocks you click, which tabs you use, or how often you open the dashboard.
No account required: There is no login, no email address stored, no user profile.
15-minute cache is local: Cached screener results are stored in Chrome's local extension storage on your device — not on remote servers.
Open-book permissions: Chrome will show you exactly which host permissions the extension requests when you install it. These are the screener domains the extension needs to fetch data directly.
The extension's host permissions exist for a specific technical reason: Chrome extensions must declare the domains they intend to communicate with, and these declarations allow the browser to bypass the same-origin policy restrictions that would otherwise prevent the fetch requests from completing. Without these permissions, the extension would need to proxy all requests through a server — which would introduce both a privacy concern and a performance bottleneck. The direct-fetch architecture was chosen specifically to avoid that tradeoff.
🖼 Illustrated Guide
A visual walkthrough of the key concepts — intersection logic, the 7 strategy tabs, morning workflow, and the psychology behind momentum scanning. Click any image to view full size.

Download Finmagine Trader Free
Add it to Chrome in one click — no account required, no setup, no manual scanning needed. Your morning momentum scan in under 10 seconds, every trading day.
Add to Chrome — FreeFree Chrome Extension
Ready to scan your first momentum list?
Install Finmagine Trader and scan 2,000+ NSE stocks for Stage 2 uptrends, VCP breakouts, near 52-week highs, and volume surges — in one click.
Install from Chrome Web Store →No account required • Works on Chrome, Edge, Brave • NSE stocks only
Learn More About Finmagine Trader
Full landing page with all features explained, screenshots, and Chrome Web Store link:
Finmagine Trader — Install Free All 7 Screener Tabs Explained Precision Filters (v1.2.0) Tight Volatility Filter (v1.4.0)Finmagine Trader — Frequently Asked Questions
The most common questions about Finmagine Trader, answered in detail. Click any question to expand the answer.