Following along? Install Finmagine Trader first
Free NSE momentum scanner — no account needed • Chrome, Edge, Brave
Multimedia Learning Hub
Master the Minervini Trend Template, SEPA Score, and structural quality analysis through a complete written guide, video walkthrough, audio deep dive, and 40 interactive flashcards
The TT Column: One Badge That Answers Seven Questions Simultaneously
Most momentum tools tell you a stock is moving. The Trend Template column in Finmagine Trader tells you why the structure behind that movement is sound. A green TT✓ badge means all seven of Mark Minervini’s structural quality criteria are simultaneously true for that stock right now — a condition that many stocks in confirmed uptrends never reach, and that structurally weak stocks cannot fake.
- Is close above the 50-day SMA?
- Is the 50-day above the 150-day SMA?
- Is the 150-day above the 200-day SMA?
- Is close above the 200-day SMA?
- Is the 200-day SMA trending up recently?
- Is price ≥30% above its 52-week low?
- Is price within 25% of its 52-week high?
- Stage 2 has a liquidity filter (price × vol > ₹10L)
- TT has no liquidity filter at all
- Stage 2 requires 50% above 52W low (stricter)
- TT requires only 30% above 52W low (broader)
- Result: TT surfaces quality mid/small caps Stage 2 ignores
- 0–4 structural quality score
- 1 point each for: TT✓, Near High, VCP, 3-Week Tight
- Excludes High Volume (daily trigger, not structure)
- Gold 4 = all four structural signals present
- Measures quality of setup, not what fired today
Video Guide: The Minervini Trend Template — Coming Soon
A dedicated video walkthrough of the Trend Template column, SEPA Score, and structural quality analysis for NSE stocks is in production. Subscribe to the Finmagine YouTube channel to be notified when it is published.
What the video will cover:
- Why Mark Minervini built a 7-criteria structural checklist instead of relying on a single moving average crossover
- What each of the seven criteria is actually looking for — and what failure on any one criterion tells you about the stock’s condition
- The liquidity-filter gap: why the same criteria that define a great Stage 2 stock can also describe an excellent small-cap that Stage 2 never shows you
- Live examples of stocks that pass TT but not Stage 2 — and why these are often the best momentum setups in mid and small-cap territory
- The SEPA Score as a structural quality compass: how to read 4 vs 3 vs 2 vs 1 and what each level means for position sizing and conviction
- A complete morning workflow integrating TT column and SEPA Score into the Finmagine Trader 5-minute routine
Audio Deep Dive: The Trend Template — Coming Soon
A dedicated audio session covering the Minervini Trend Template from first principles is in production. It will be added to this page when available.
The audio will cover:
- The philosophy of structural quality: why Minervini built a checklist rather than a single trigger
- Each of the 7 criteria explained with real-market context and examples from NSE stocks
- The difference between trend quality and trend presence: why all Stage 2 stocks have trend presence, but only TT stocks have both
- Why the 200-day SMA direction requirement (criterion 5) is the most important and most often misunderstood condition
- The liquidity filter insight: why illiquid quality stocks appear on TT but never on Stage 2, and how to treat them differently
- SEPA Score as a position-sizing guide: reducing size at SEPA 1–2, full size at SEPA 3–4
- A complete morning routine integrating TT, SEPA Score, and the existing Score column for a multi-layer conviction framework
Test Your Knowledge — The Minervini Trend Template — 40 Flashcards
Click any card to reveal the answer. Search by topic to focus on a specific area. All 40 flashcards cover the 7 TT criteria, TT vs Stage 2 differences, SEPA Score mechanics, practical applications by tab, and the morning workflow.
What Is the Trend Template?
Mark Minervini is one of the most consistently successful US stock traders on record, a two-time US Investing Championship winner. His SEPA methodology — Specific Entry Point Analysis — is built on the observation that the best momentum trades share a consistent set of structural characteristics that can be objectively measured before entry. He called the structural component of this framework the Trend Template: a seven-criterion checklist that must be completely satisfied before a stock is even considered as a candidate.
The purpose of the Trend Template is not to find stocks that are going up. It is to find stocks where the entire price structure — the relationship between price and its moving averages, the direction of those averages, and the stock’s position relative to its annual range — is simultaneously healthy. A stock can be rising without satisfying the Trend Template. But a stock that satisfies all seven criteria simultaneously has a price structure that Minervini’s research identifies as the most fertile ground for sustained momentum trades.
“The Trend Template is not a timing tool. It is a structural quality filter. It tells you whether the stage is set for a sustainable move, not whether the move has begun.”
In Finmagine Trader, the TT column shows a green badge (TT✓) for every stock in the current scan results that passes all seven criteria simultaneously. A dash (—) means at least one criterion is not met. The badge is not a buy signal. It is a structural quality indicator — one piece of a multi-layer conviction framework that, when combined with the Score column and the SEPA Score, gives you a clear picture of how structurally sound each momentum candidate is.
Most momentum indicators measure price action. The Trend Template measures price structure. The distinction matters: a stock can have strong price action in a structurally weak position (bouncing off a one-year low in a declining trend), but a stock with strong structure and strong price action simultaneously is a very different quality of candidate. The TT badge identifies the latter.
The Seven Criteria Decoded
Each of the seven Trend Template criteria exists for a specific reason. Understanding the rationale behind each criterion helps you interpret what it means when a stock fails one — and why a stock that passes all seven is in a structurally different position from one that passes only five or six.
Close > 50-Day SMA
The stock is trading above its medium-term moving average. This is the most basic confirmation that price is currently above the trend of the past 50 days. Failure here means the stock has pulled back below near-term trend — it may recover, but the immediate structure is broken.
50-Day SMA > 150-Day SMA
The medium-term trend (50-day) is above the intermediate trend (150-day). This confirms that the acceleration of the trend in the near-term is outpacing the broader slope — the trend is strengthening, not weakening. A declining 50/150 relationship means the medium-term trend is rolling over.
150-Day SMA > 200-Day SMA
The intermediate trend (150-day) is above the long-term trend (200-day). This is the “middle tier” of the SMA stack. When the 150-day dips below the 200-day, the intermediate-term trend has broken down relative to the long-term baseline — a serious structural deterioration.
Close > 200-Day SMA
Price is above its long-term trend baseline. This is the simplest long-term health check: the stock is on the right side of the 200-day. Many institutional investors use the 200-day as their primary trend filter. Being above it means the stock is in the institutional “investable” zone.
200-Day SMA Rising (20-Day Check)
The 200-day SMA today is higher than it was 20 trading days ago. This is the most important and most nuanced criterion. A stock can be above a flat or declining 200-day — but Minervini requires the 200-day itself to be actively trending upward. This eliminates base-building stocks and sideways consolidation phases where the 200-day has flattened.
Price ≥30% Above 52-Week Low
The stock has moved at least 30% off its 52-week low. This confirms a meaningful recovery from the low — the stock is not just bouncing off the bottom. A stock trading at ₹105 with a 52W low of ₹100 passes many moving average tests but has made virtually no structural progress from its annual trough.
Price Within 25% of 52-Week High
The stock is no more than 25% below its 52-week high. This confirms price proximity to recent strength — the stock is pressing toward the top of its annual range, not languishing mid-range. Combined with criterion 6, this places the stock in the upper portion of its annual price range, where overhead supply is minimal and breakout potential is highest.
Each criterion can be individually satisfied in a structurally unsound stock under specific conditions. It is the simultaneous satisfaction of all seven that creates the structural quality signal. A stock that passes six of seven is a near-miss, not a template pass. The TT badge is binary — either all seven are true, or they are not.
The Most Important Criterion: #5, the Rising 200-Day SMA
Criterion 5 — the 200-day SMA must be higher today than it was 20 trading days ago — is the most selective of the seven and the one most analysts initially overlook. Its importance lies in what it eliminates: stocks that are above a flat or gently declining 200-day moving average.
Many strong-looking stocks fail only this criterion. They are above all their moving averages (criteria 1–4), well off their lows (criterion 6), and near their highs (criterion 7) — but their 200-day SMA has been flat for months. This flatness indicates the stock is in a base-building or consolidation phase, not an active advancing phase. The Trend Template requires the long-term trend to be actively accelerating upward, not merely present.
TT vs Stage 2 — Three Critical Differences
The most common question from traders who encounter the TT column for the first time is: “Is this just Stage 2 with different criteria?” The answer is no — and the differences are analytically significant. Understanding them tells you exactly what TT adds to your analytical framework that Stage 2 does not.
| Dimension | Stage 2 (Weinstein) | Trend Template (Minervini) | Practical Impact |
|---|---|---|---|
| Liquidity Filter | Required: Price × 50-day avg volume > ₹10 Lakh | None — no liquidity requirement | TT shows quality small and micro caps that Stage 2 never surfaces due to thin trading volumes |
| 52-Week Low Distance | Price ≥50% above 52W low (stricter) | Price ≥30% above 52W low (more lenient) | TT includes earlier-stage advances still in the 30–50% range above their lows. Stage 2 only shows the more extended moves. |
| 200-Day SMA Trend Logic | OR logic: SMA200 trending up over 20 days OR 80 days OR 100 days | Strict 20-day only: SMA200 today > SMA200 20 days ago | Stage 2 is lenient — stocks with slowly recovering 200-day SMAs still qualify. TT requires active, recent upward momentum in the 200-day itself. |
| SMA Stack Requirements | SMA50 > SMA150 > SMA200 (same) | SMA50 > SMA150 > SMA200 (same) + Close > SMA200 | TT explicitly requires price above the 200-day. Stage 2’s SMA stack already implies this but does not state it directly. |
| 52-Week High Proximity | Not required | Price within 25% of 52-week high required | TT eliminates stocks that are in an uptrend but languishing far below annual highs (large overhead supply). Stage 2 allows them. |
The Liquidity Difference: The Most Important Gap
The liquidity filter in Stage 2 is the most consequential difference. Stage 2 requires that a stock’s price multiplied by its 50-day average volume exceeds ₹10 Lakh per day. This is designed to ensure that the stocks Stage 2 surfaces are liquid enough to trade without significant market impact. It is a sensible filter for swing traders who need to enter and exit positions cleanly.
But it has a structural side effect: it permanently excludes all illiquid stocks, regardless of how structurally sound they are. A quality small-cap trading ₹8 Lakh per day on average — just below the ₹10 Lakh threshold — will never appear in Stage 2 results, even if it passes all seven of Minervini’s structural quality criteria simultaneously. The TT column has no such filter, so it surfaces these stocks.
AETHER Industries is a mid-size specialty chemicals company that frequently shows up on the Near 52W High, High Volume, and VCP scans with TT✓ — but no S2 badge. The reason is always the same: its average daily turnover falls below Stage 2’s ₹10 Lakh liquidity threshold. From Stage 2’s perspective, AETHER does not exist as a tradable candidate. From TT’s perspective, it is a structurally sound stock in a confirmed advancing phase. The TT column makes this invisible stock visible. For traders who can size positions appropriately for thin liquidity, this is precisely the kind of setup that generates the best risk-adjusted returns.
The 52-Week Low Difference: Earlier-Stage Advances
Stage 2 requires a stock to be 50% above its 52-week low before it qualifies. This means a stock trading at ₹100 with a 52W low of ₹68 passes Stage 2 (₹100 ≥ ₹68 × 1.5 = ₹102 — actually fails narrowly in this example), while a stock at ₹100 with a 52W low of ₹60 passes (₹100 ≥ ₹90). TT only requires 30% above the low: ₹100 with a 52W low of ₹77 passes TT (₹100 ≥ ₹77 × 1.3 = ₹100.1 — marginal pass).
The practical effect is that TT includes stocks that are earlier in their advancing phase — stocks that have made 30–49% progress from their lows but have not yet reached the 50% threshold that Stage 2 demands. These are not weak stocks; they are stocks that started their advance more recently and may still have a longer runway ahead. The TT column makes them visible before they cross the 50% threshold and become Stage 2 candidates.
The 200-Day SMA Trend Difference: Strictness vs Leniency
Stage 2’s SMA200 trend check uses OR logic: the 200-day SMA is trending up over 20 days OR 80 days OR 100 days. This means a stock qualifies for Stage 2 even if only one of these lookback periods shows a rising 200-day. In practice, a stock that had a strong 200-day trend three months ago (visible on the 80-day or 100-day check) but whose 200-day has stalled recently still qualifies for Stage 2.
TT uses strict 20-day-only logic: the 200-day SMA must be higher right now than it was exactly 20 trading days ago. No historical recovery periods are considered. This makes TT’s 200-day criterion significantly stricter than Stage 2’s, even though TT’s 52W-low criterion is more lenient. The result is that TT’s stock universe has more actively accelerating 200-day SMAs on average than Stage 2’s, even though TT includes more illiquid and earlier-stage stocks.
Reading the TT Column by Tab
The TT column appears on every tab in Finmagine Trader, but it adds different analytical value depending on which tab you are looking at. Understanding what TT tells you on each tab helps you interpret the badge correctly and avoid misreading its significance.
On the All Three Tab
The All Three tab already intersects Stage 2, Near High, and High Volume — three strong structural and momentum filters. On this tab, nearly every stock that appears will also carry TT✓, because Stage 2 and TT share the same core SMA stack requirement. The few All Three stocks that do not show TT✓ are interesting exceptions: they have passed S2+NH+HV but failed one of TT’s additional criteria, most commonly the strict 20-day rising-200-day check. These are stocks where something in the 200-day SMA picture has slightly stalled despite strong overall structure.
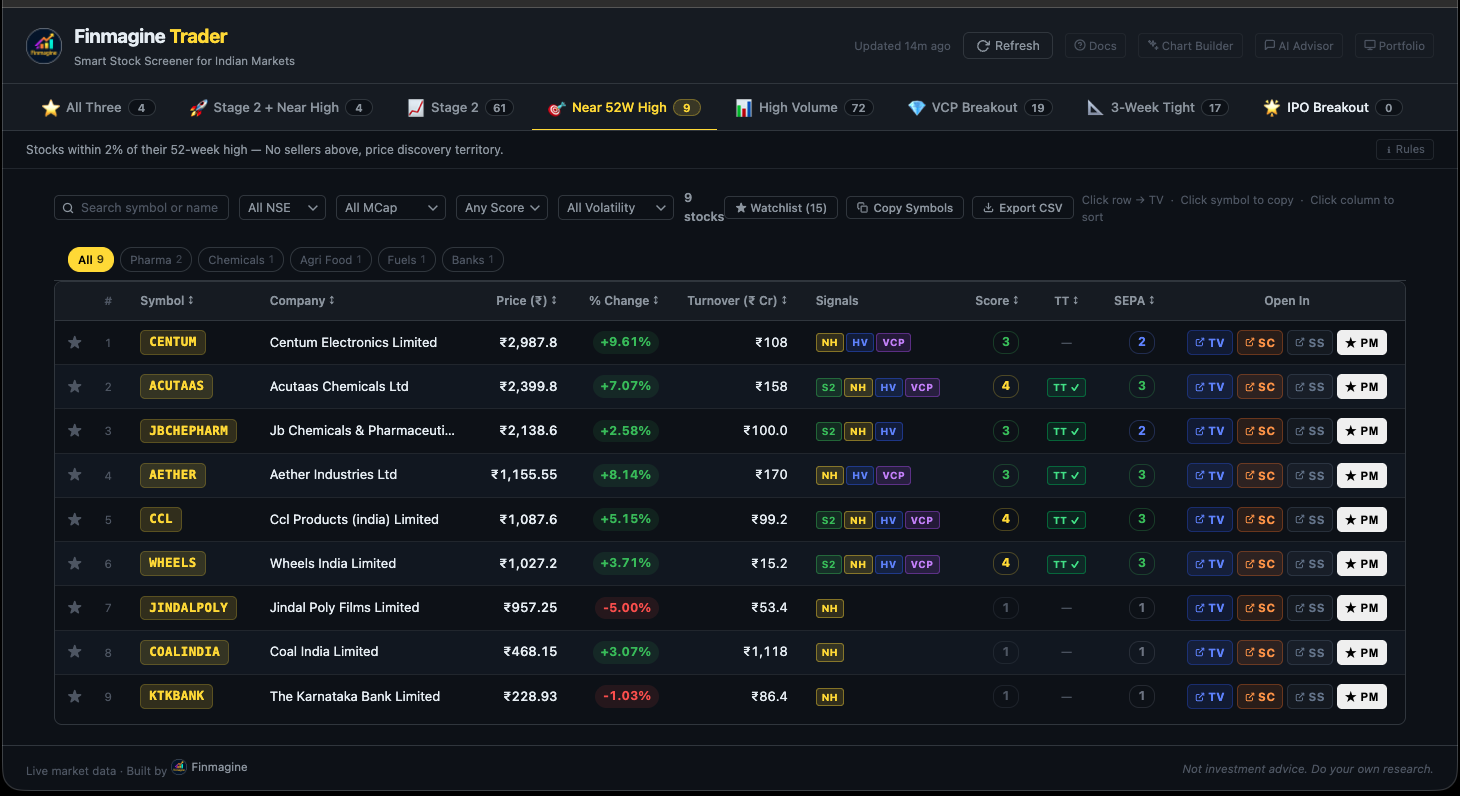
On the Near 52W High Tab
This is where TT adds the most value. The Near High tab surfaces stocks pressing against their 52-week highs, regardless of whether they are in a confirmed Stage 2 uptrend. Some Near High stocks are in late-stage distribution, some are in short-term spikes, and some are genuinely in healthy advancing phases. TT✓ on a Near High stock is a strong confirmation: not only is the stock near its annual high, but its entire SMA structure is aligned, its 200-day is actively rising, and it has made meaningful progress from its annual low. Near High + TT✓ is a high-quality combination.
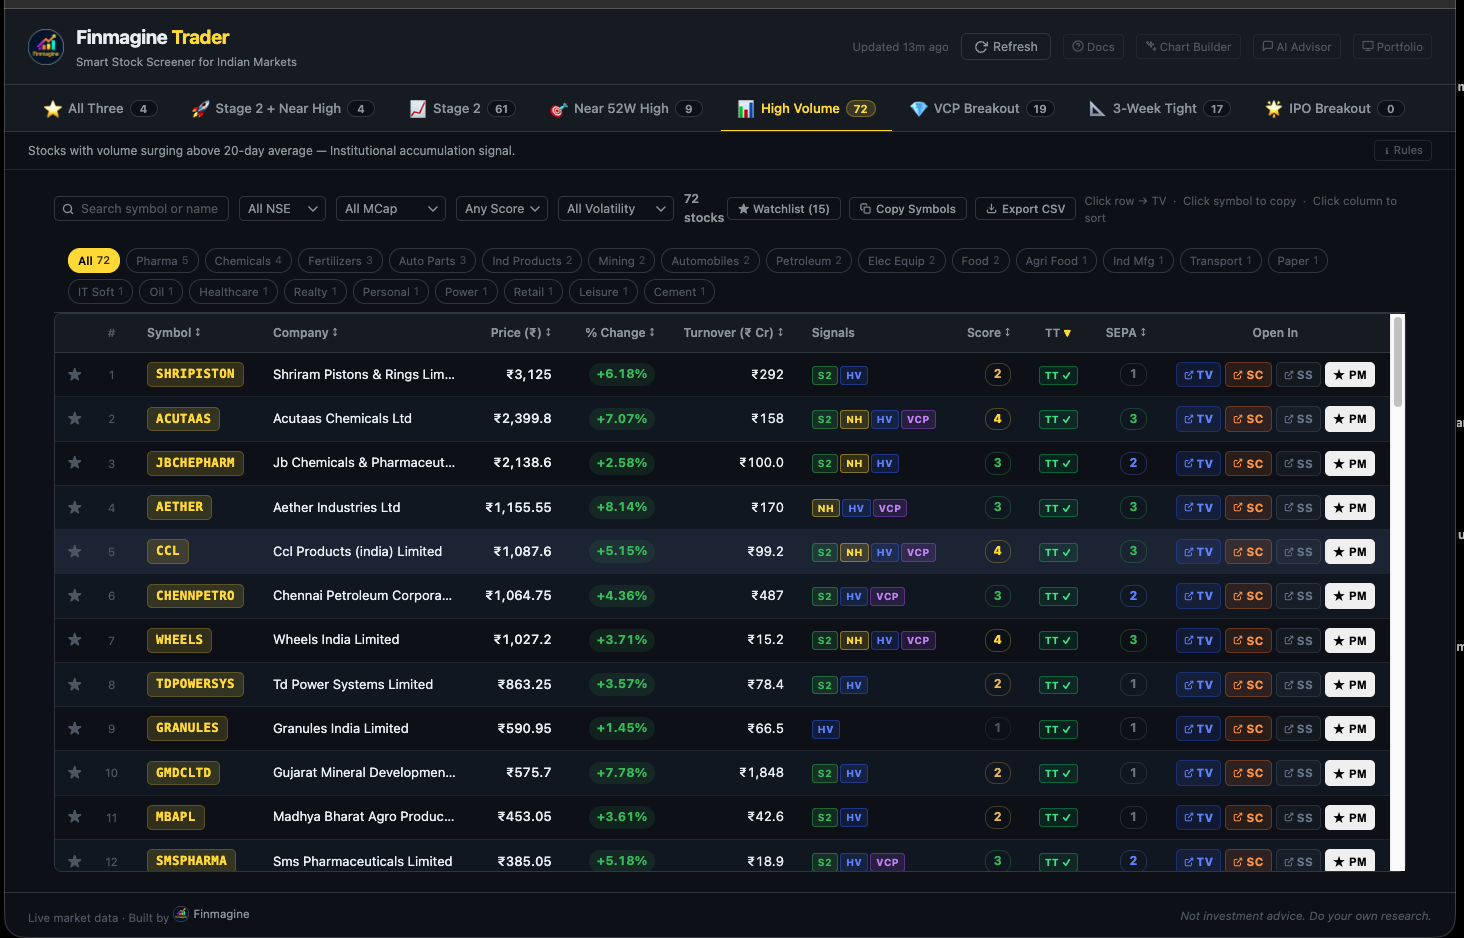
On the High Volume Tab
The High Volume tab captures stocks with volume spikes above their 20-day average, regardless of trend or position. Volume spikes can occur in declining stocks, consolidating stocks, and advancing stocks. TT✓ on a High Volume stock confirms that the volume event is occurring within a structurally sound setup — not a volume spike in a broken stock. High Volume + TT✓ is a “volume on structure” combination: the institutional activity is happening in a stock where the structural conditions are already in place for a sustained move.
On the Stage 2 Tab
On the Stage 2 tab, the TT badge primarily separates stocks with actively rising 200-day SMAs from those where the 200-day trend has stalled. Because Stage 2 uses lenient OR logic for its 200-day check, some Stage 2 stocks have 200-day SMAs that were rising 3 months ago but have since flattened. These will show no TT✓. Stage 2 stocks with TT✓ have both the Weinstein structural criteria AND Minervini’s more demanding standards simultaneously — the highest-quality subset of the Stage 2 universe.
On the VCP Breakout Tab
VCP (Volatility Contraction Pattern) setups are specific technical patterns within an existing uptrend. TT✓ on a VCP stock confirms that the pattern is forming within a structurally sound overall trend. Not all VCP setups occur in TT-quality stocks — some occur in earlier-stage advances or in lower-quality structural environments. VCP + TT✓ is the highest-conviction VCP setup: the contraction pattern is appearing in a stock that also passes all seven structural quality criteria.
On the 3-Week Tight Tab
The 3-Week Tight tab shows stocks where three consecutive weekly closes have been within 1.5% of each other, indicating a period of very low volatility consolidation above the 50-day SMA. TT✓ on a 3-Week Tight stock confirms that this coiling is happening within a structurally sound framework — not just above the 50-day in isolation. 3-Week Tight + TT✓ is a high-quality pre-breakout coiling setup with full structural backing.
The SEPA Score: Measuring Structural Quality 0–4
The SEPA Score column (0–4) gives you a single number that measures the structural quality of a stock’s momentum setup. It counts how many of four key structural signals are simultaneously present: TT, Near High, VCP, and 3-Week Tight. Each signal present adds 1 point.
Why High Volume Is Excluded from SEPA Score
The existing Score column counts five signals: Stage 2, Near High, High Volume, VCP, and IPO Breakout. The SEPA Score deliberately excludes High Volume and Stage 2 from its count, replacing them with TT and 3-Week Tight. This is not an arbitrary choice — it reflects a structural philosophy distinction.
High Volume is a daily trigger signal: it fires on a specific day when volume exceeds the 20-day average. It can fire in structurally sound or structurally weak stocks. It can fire once and never again. It is valuable for identifying when institutional activity is happening today, but it does not measure structural quality — it measures today’s activity. For SEPA Score, which is designed to measure the structural backdrop of a setup, a one-day volume event is not the right ingredient.
Stage 2 is excluded from SEPA Score for a different reason: TT already captures most of Stage 2’s structural content (SMA stack, 200-day direction) while adding additional criteria (52W high proximity, strict 200-day check). Since TT is the more demanding structural filter of the two, counting Stage 2 separately alongside TT would double-count overlapping structural confirmation rather than adding new information.
| Signal | In Score Column? | In SEPA Score? | Why |
|---|---|---|---|
| Stage 2 (S2) | Yes | No | TT is a superset of S2’s structural content; counting both would double-count overlap |
| Near 52W High (NH) | Yes | Yes | Price proximity to highs is a genuine structural quality dimension (overhead supply minimal) |
| High Volume (HV) | Yes | No | Daily trigger signal, not structural; fires in weak stocks too; measures today’s activity not setup quality |
| VCP Breakout | Yes | Yes | Volatility contraction pattern is a structural quality signal — coiling before breakout within an uptrend |
| IPO Breakout | Yes | No | Applies only to recent IPOs; structural criteria based on listing-day high rather than 52W range |
| Trend Template (TT) | No (shown separately) | Yes | Core structural quality filter — the backbone of the SEPA Score |
| 3-Week Tight | No (shown separately) | Yes | Pre-breakout coiling confirmation — structural compression signal within an advancing trend |
SEPA Score vs Score Column: Two Different Questions
The Score column (0–5) answers: How many different momentum signals fired today? A Score of 4 means four different scan categories all flagged this stock simultaneously — high daily signal count, useful for identifying today’s most active momentum candidates.
The SEPA Score (0–4) answers: How structurally sound is this stock’s momentum setup? A SEPA Score of 4 means the stock passes the Trend Template, is near its 52-week high, is forming a VCP pattern, and is showing 3-week tight coiling simultaneously. This is a stock where four independent structural quality indicators all agree that the setup is genuinely high-quality.
A stock can have a high Score and a low SEPA Score (lots of signals firing today, but in a structurally weaker framework), or a high SEPA Score and a moderate Score (excellent structural quality, but today is not a high-activity day for this stock). The most interesting candidates are stocks where both are high: the structure is sound AND today is an active day for momentum signals.
On some trading days, you may notice that a stock’s SEPA Score appears to be consistently one less than its Score. This is not a bug — it can happen on days when High Volume and Stage 2 (which are in Score but not SEPA) are widely firing while TT and 3-Week Tight (which are in SEPA but not Score) are less common. The genuine value of SEPA Score emerges over time: it identifies stocks whose structural quality is persisting across multiple days, not just stocks that had a high-activity day.
A Practical Morning Workflow with TT and SEPA Score
The TT column and SEPA Score are most valuable when integrated into a structured morning review routine. Here is a step-by-step workflow that uses all layers of the Finmagine Trader conviction framework together.
Open All Three Tab
Start with the All Three tab. These stocks have confirmed S2 + Near High + High Volume simultaneously. Note the count: 8+ stocks is a strong market; 4–7 is normal; under 4 suggests breadth narrowing. Apply your Index filter (Nifty 200 or 500) and check TT✓ for structural confirmation.
Scan SEPA Score 3+
Sort by SEPA Score descending on any tab. Stocks at SEPA 3 or 4 have multiple structural quality signals present simultaneously. These are your primary watchlist additions for the day. SEPA 4 + Score 3+ is the highest combined conviction level in the system.
Check Near High Tab for TT✓
Open the Near High tab filtered to TT✓ only (sort by TT column). These are stocks where the structural template is confirmed AND price is pressing toward the 52-week high — the combination Minervini identifies as the highest-probability breakout setup. Prioritize any that also have a VCP badge.
Review High Volume + TT✓ (No S2)
On the High Volume tab, look for stocks with TT✓ but no S2 badge. These are the “quality illiquid” stocks: structurally sound by Minervini’s criteria but below Stage 2’s liquidity threshold. Size appropriately for thinner liquidity — smaller initial position with room to add.
VCP + TT✓ Are Your A-List
Any stock showing both VCP badge and TT✓ is on your A-list for the session. The volatility contraction is occurring within a fully confirmed Minervini structural framework. Wait for the volume-accompanied breakout above the base pivot for entry. This is Minervini’s SEPA methodology operating at full strength.
3-Week Tight + TT✓ = Pre-Breakout
On the 3-Week Tight tab, any stock with TT✓ is showing Minervini-quality pre-breakout coiling: three consecutive weekly closes within 1.5% in a stock that also passes all seven structural criteria. These are “spring loaded” setups — add to watchlist and wait for the weekly breakout.
A practical position-sizing guideline: SEPA 4 = full size (your standard position). SEPA 3 = 75% of standard size. SEPA 2 = 50% of standard (watchlist with reduced initial allocation). SEPA 1 = monitoring only, no allocation yet. This is not a rigid rule, but it encodes the principle that your largest positions should have the strongest structural backing.
How TT and SEPA Score Complement the Sector Grouping Bar
The Sector Grouping Bar above each scan results table shows which industry groups are most represented in the current scan. When you combine sector grouping with TT and SEPA Score, you can identify not just individual stocks but sector-level structural quality trends. If the Near High tab shows a cluster of Chemical sector stocks all carrying TT✓ and SEPA 3+, that is a sector-level signal: institutional money is flowing into structurally sound chemical stocks simultaneously. That convergence — sector dominance + structural quality + near-high positioning — is often the early read on a sector rotation event before it shows up in the broader market commentary.
Frequently Asked Questions About the TT Column
Can a stock pass TT but fail Stage 2?
Yes, and this is precisely what makes the TT column valuable. The most common reason is liquidity: the stock is structurally sound by all seven Minervini criteria but has insufficient average daily turnover to pass Stage 2’s liquidity filter. The second most common reason is the 52W-low threshold: the stock is 30–49% above its annual low (passes TT’s criterion 6) but has not yet reached Stage 2’s 50% requirement. Stocks in this category are often early-stage high-quality advances.
Can a stock pass Stage 2 but fail TT?
Yes, less commonly but it happens. The most frequent cause is criterion 5 (rising 200-day SMA): a stock’s 200-day SMA has stalled or is barely rising, which fails TT’s strict 20-day check but passes Stage 2’s lenient OR logic (the 80-day or 100-day lookback still shows a rising 200-day from months ago). The second cause is criterion 7 (within 25% of 52W high): a Stage 2 stock that has pulled back more than 25% from its high still qualifies for Stage 2 (there is no high-proximity requirement), but fails TT.
Should I trade TT stocks that have no liquidity?
With reduced position size and wider patience for entry. Thin liquidity means you may need to spread your entry over multiple sessions rather than entering a full position at once. The structural quality confirmation from TT✓ is valuable, but liquidity determines how aggressively you can position. A SEPA 4 + TT✓ stock with ₹8 Lakh daily turnover is a great setup — sized for the liquidity available, typically 25–50% of your standard position.
Does the TT badge reset daily?
Yes. The TT badge is computed fresh for every scan run against the day’s closing price and moving averages. A stock that showed TT✓ yesterday may show a dash today if the 200-day SMA comparison has changed or if price has pulled back below a key SMA. Conversely, a stock that failed TT yesterday because its 200-day was flat may earn TT✓ today after 20 more days of accumulation have moved the 200-day higher. The badge reflects current structural condition, not historical.
Is TT enough on its own for an entry decision?
No. TT✓ is a structural quality prerequisite, not a timing signal. It tells you the stock is in the right structural condition for a momentum trade; it does not tell you when to enter. Entry timing still requires identifying a specific pivot point (VCP breakout level, near-high resistance break, or weekly tight range expansion), volume confirmation on the breakout, and appropriate risk management (entry, stop, target). TT✓ qualifies the stock; your entry criteria define the moment.
Free Chrome Extension
Ready to scan your first momentum list?
Install Finmagine Trader and scan 2,000+ NSE stocks for Stage 2 uptrends, VCP breakouts, near 52-week highs, and volume surges — in one click.
Install from Chrome Web Store →No account required • Works on Chrome, Edge, Brave • NSE stocks only
Start Using the TT Column and SEPA Score
The Trend Template and SEPA Score are live in Finmagine Trader v1.8.0. Install the extension and use the TT column to add structural quality analysis to your daily momentum scan — free, on every NSE stock, every morning.
Get Finmagine Trader →Related Article — Published March 23, 2026
The Trend Template is the foundation of the BRS score. See how TT combines with RS, Weinstein Stage, and Proximity to 52W High in the full Breakout Readiness Score.
The Breakout Readiness Score: From Scanner to Decision Engine →Continue the Finmagine Trader Series
Explore the other articles in this series to master every scan and tab:
Introducing Finmagine Trader The All Three Signal VCP Breakout Setups Stage 2 Deep Dive Tight Volatility FilterQuick Reference Q&A
The most common questions about the Minervini Trend Template and SEPA Score — answered concisely. Click any question to expand.