Following along? Install Finmagine Trader first
Free NSE momentum scanner — no account needed • Chrome, Edge, Brave
Multimedia Learning Hub
Master Stage 2 analysis for Indian markets — theory, screener criteria, practical workflow, and 40 interactive flashcards
Stage 2 — The Only Phase Worth Owning
Stan Weinstein identified four distinct stages in every stock's lifecycle. Of those four, only Stage 2 aligns price, volume, and trend simultaneously in the buyer's favour. The Finmagine Trader Stage 2 tab scans every NSE stock daily against seven precise SMA conditions to isolate the roughly 153 stocks currently in this institutional markup phase.
- Close > SMA(150)
- Close > SMA(200)
- SMA(150) > SMA(200)
- SMA(200) rising (3 checks)
- SMA(50) > SMA(150)
- Close > SMA(50)
- Price in 52W range
- Stage 2 — ~153 stocks (full universe)
- Stage 2 + Near High — ~36 stocks (swing trades)
- All Three — ~6 stocks (highest conviction)
- 200-day SMA must be rising
- Checked at 20, 80 & 100 days ago
- Eliminates flat/declining 200 SMA
- Liquidity filter: >₹10L daily turnover
Momentum Breakout Strategy — 7-Rule Stage 2 Scanner
A complete walkthrough of the 7-rule scanner, Weinstein’s Stage Analysis framework, the three-step momentum pattern (Dip → Rocket Recovery → Breakout), and real case studies — Varun Beverages (+566%), Mahindra & Mahindra (+94%), and L&T Finance (+55%).
7-Rule Stage 2 Scanner — Audio Deep Dive
A comprehensive audio walkthrough covering Weinstein’s Stage Analysis, all seven scanner rules explained in plain English, the three-step momentum pattern, real case studies, volume diagnostics (the 2×2 matrix), and disciplined risk management. Perfect for commute, morning prep, or post-market review.
Blog: 7-Rule Scanner for Stage 2 Breakouts
Test Your Knowledge — Stage 2 Analysis — 60 Flashcards
Click any card to reveal the answer. Search by topic to focus on a specific area. All 60 flashcards cover every key concept — from Weinstein’s four stages and the seven SMA conditions to case studies, volume diagnostics, risk management, the Stage 2 + Near High workflow, warning signs, and sector rotation reading.
Stan Weinstein and the Four Stages of a Stock’s Life Cycle
Stan Weinstein published Secrets for Profiting in Bull and Bear Markets in 1988. The book introduced a framework that has endured decades of market evolution precisely because it describes a behavioural reality rather than a mathematical abstraction: stocks move through four repeating stages, each with a distinct price, volume, and moving average character. Understanding which stage a stock is in determines whether the buyer, the seller, or neither has the structural edge.
| Stage | Price Action | Volume Pattern | SMA Behavior | Recommended Trader Action |
|---|---|---|---|---|
| Stage 1 — Basing / Accumulation | Flat base, sideways movement, no directional trend | Volume drying up; quiet accumulation by institutions | 200 SMA flattening; 50 SMA converging toward 200 | Watch and wait; do not buy until breakout is confirmed |
| Stage 2 — Uptrend / Markup | Price rising above SMAs; higher highs and higher lows | Volume expanding on up days; declining on pullbacks | 200 SMA rising; 50 > 150 > 200 alignment confirmed | The only phase to buy and hold; ride the institutional trend |
| Stage 3 — Topping / Distribution | Price stalls near highs; choppy, wide swings | Volume picking up on down days; distribution by institutions | 200 SMA flattening; 50 SMA starting to turn down | Exit long positions; do not initiate new buys |
| Stage 4 — Downtrend / Decline | Price below SMAs; lower highs and lower lows | Volume surges on down days; panic selling visible | 200 SMA declining; 50 SMA below 200 SMA | Avoid entirely or short; sellers structurally in control |
The insight that makes this framework commercially valuable is not the existence of these stages — any experienced trader recognises that stocks trend up, top out, and trend down. The insight is the identification of where most retail traders enter and exit relative to these stages. Most retail traders buy in Stage 1, hoping for a breakout that may not come for months or years, or that may never come at all. Many more buy in Stage 3, attracted by the headline stories and analyst upgrades that tend to peak at distribution. Both entry points carry asymmetric risk against the buyer.
Stage 2 is when institutional money has committed to a sustained markup. Price, volume, and trend all align for the buyer simultaneously. Stages 1, 3, and 4 each carry asymmetric risk against the buyer — either the catalyst has not arrived yet, or the smart money is already exiting. The Finmagine Trader Stage 2 tab identifies all approximately 153 NSE stocks currently in this phase, updated daily.
Stage 2 is the phase where the trend has already been established, institutions have already committed capital, and the path of least resistance is upward. Entering here means trading with institutional momentum rather than anticipating it. The Finmagine Trader Stage 2 screener translates Weinstein’s definition into seven precise, testable conditions that can be evaluated objectively for every NSE-listed stock every trading day.
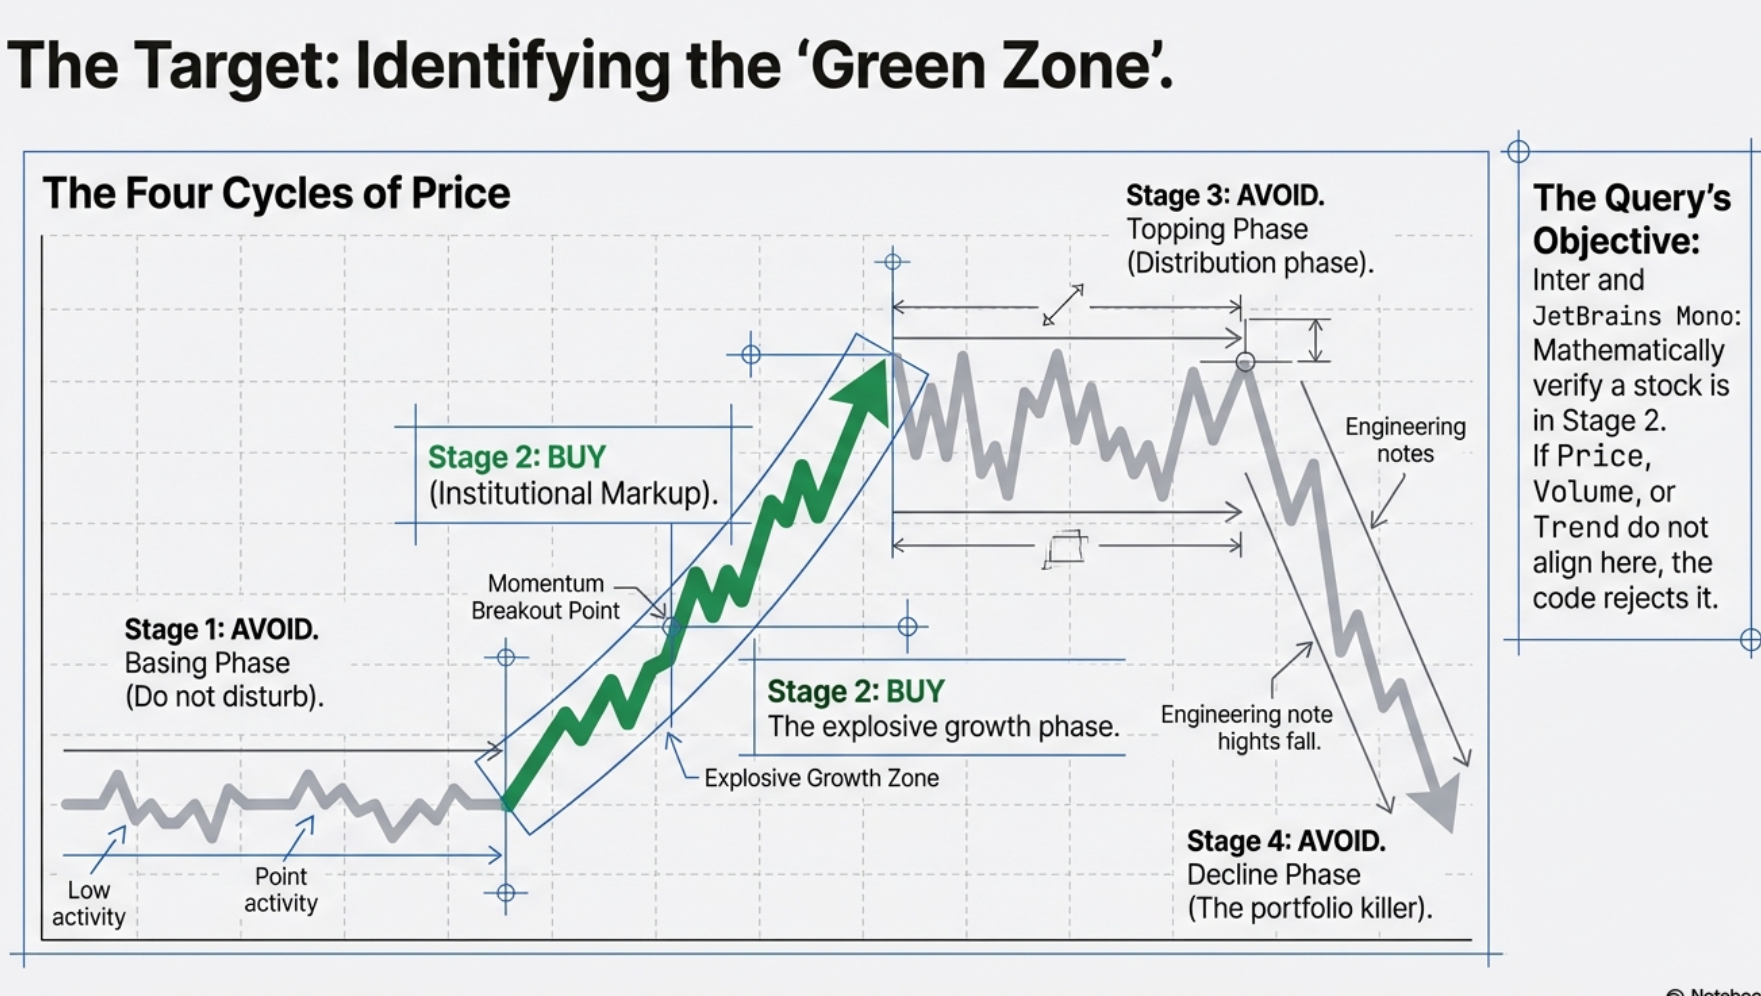
The Four Cycles of Price — only Stage 2 aligns price, volume, and trend in the buyer’s favour simultaneously.
The Seven Rules Decoded — How the Scanner Identifies Stage 2
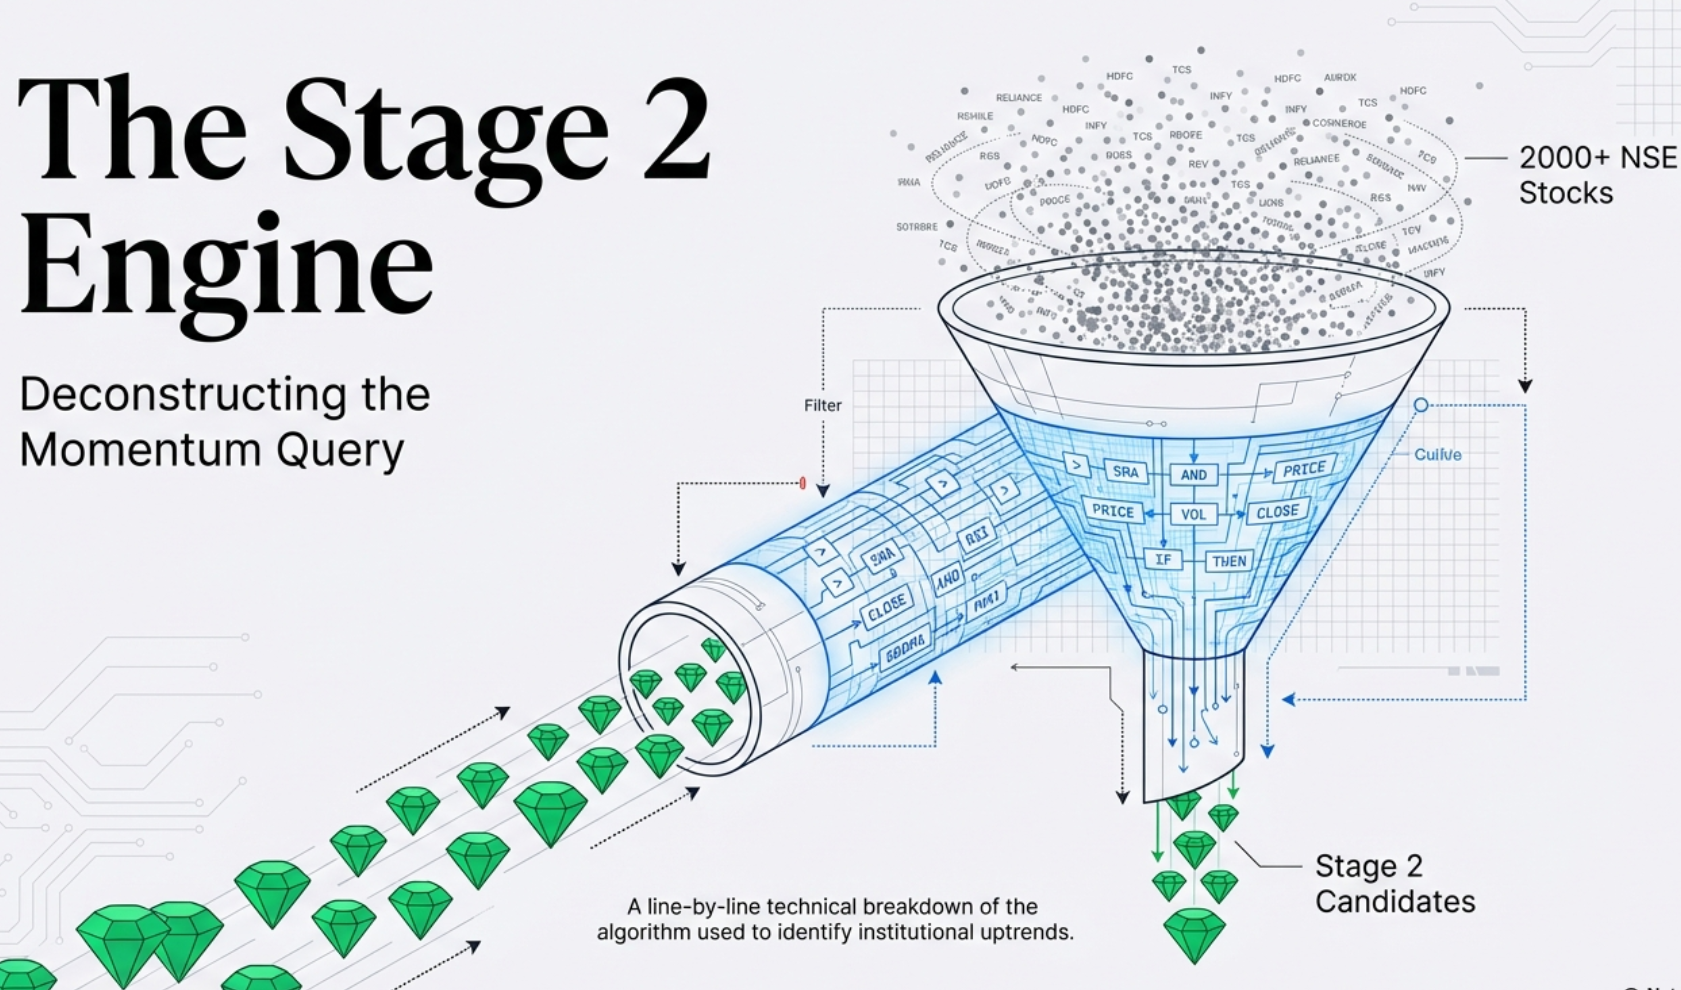
The Stage 2 Engine — 2,000+ NSE stocks poured through a precision filter, yielding only the institutional-grade candidates.
Weinstein’s Stage 2 definition is qualitative — a rising trend with moving averages in proper alignment. The Finmagine Trader screener translates that qualitative definition into seven binary conditions that every stock must pass simultaneously. If a stock fails even a single condition, it does not appear. No exceptions, no partial credit.
Here is the complete logic in one place — every line of the scanner query broken down, so you can understand exactly what it is checking and why it matters:
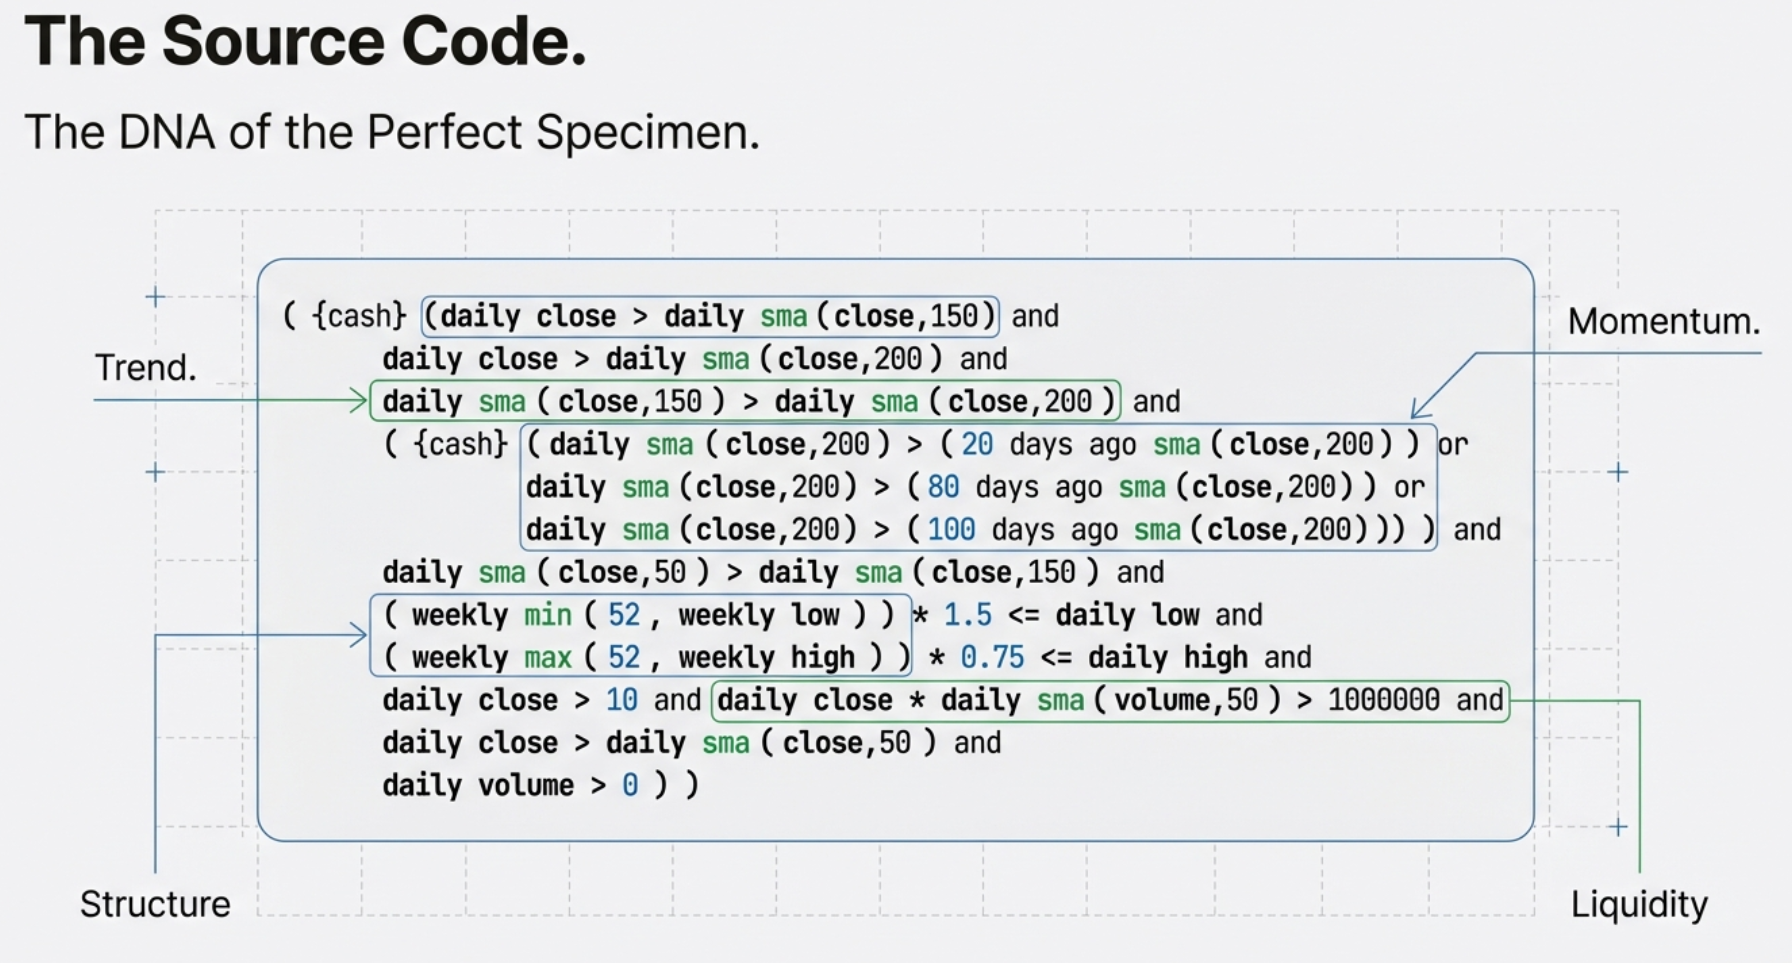
The Source Code — the full scanner query, organised into four logical groups: Trend, Structure, Momentum, and Liquidity.
The conditions fall into four logical groups: Trend (is the long-term direction up?), Structure (are the moving averages properly stacked?), Momentum (is the short-term energy confirming the long-term trend?), and Liquidity (can you actually trade this stock?). Walk through each Logic Block below and the scanner will no longer feel like a black box.
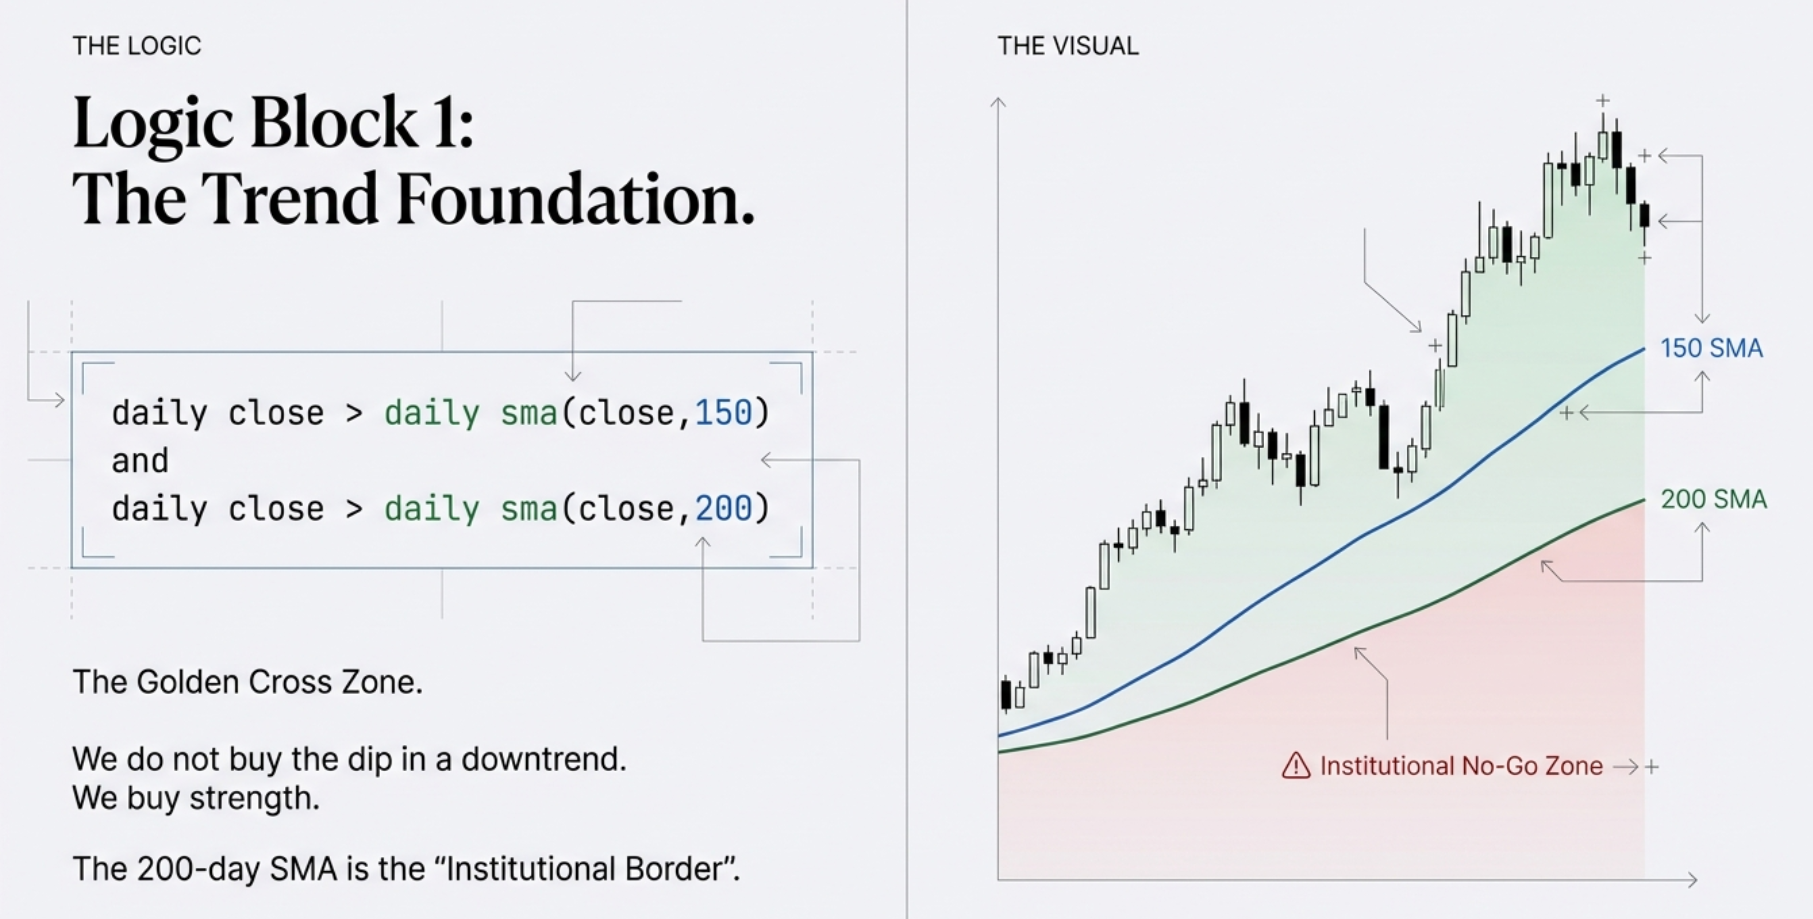
Logic Block 1 — The Trend Foundation
An SMA (Simple Moving Average) is just a smoothed version of a stock’s price history. The 150-day SMA is the average closing price over the last 150 trading days — roughly 7 calendar months. The 200-day SMA covers 200 days — roughly 10 months.
The 200-day SMA is the most widely watched trend line on the planet. Institutions, fund managers, and algorithmic trading systems globally use it as the primary dividing line between bull and bear territory. A stock above its 200-day is, by the most widely used institutional definition, in a long-term uptrend. This is the “Institutional Border.”
By requiring price to be above both the 150 and 200-day averages, the scanner immediately eliminates all Stage 4 downtrends, all stocks still forming a base in Stage 1, and all short-term rallies within long-term declines. No bottom-fishing. No catching falling knives. Only confirmed long-term uptrends.
Logic Block 2 — The Alignment
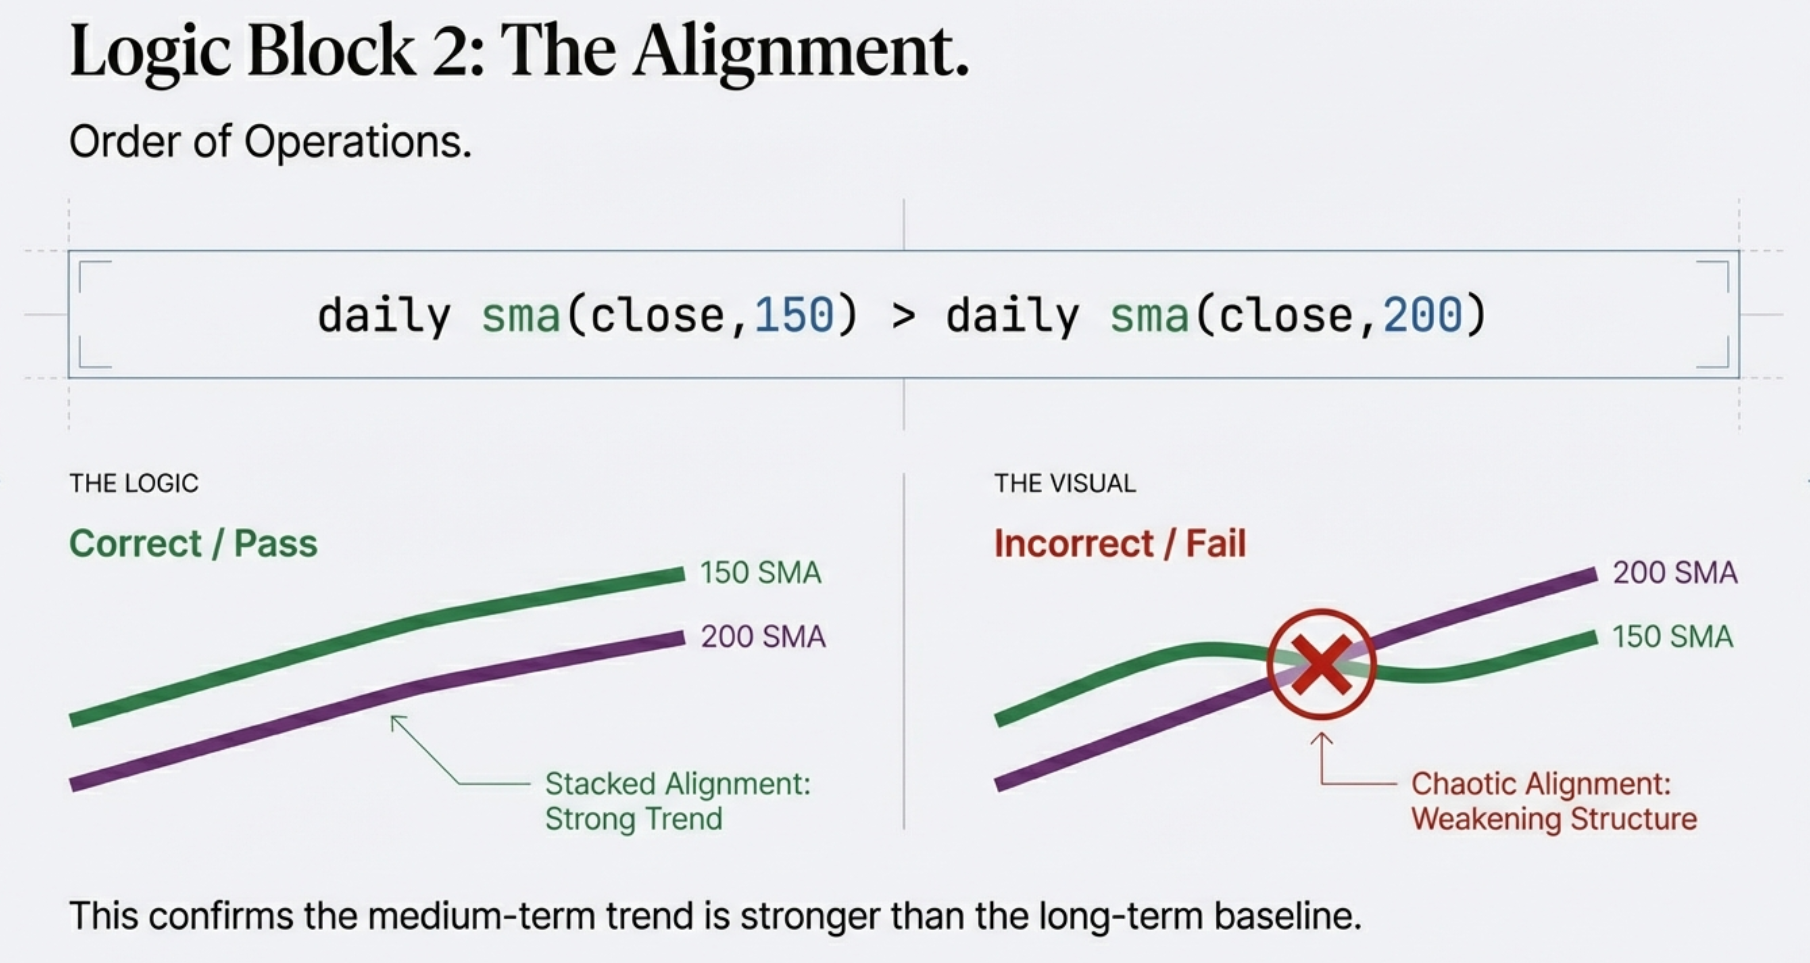
This condition is not about price — it is about the averages themselves. When the 150-day SMA sits above the 200-day SMA, the recent period is outperforming the longer lookback. The trajectory is upward and accelerating.
If the 150-day were below the 200-day, it would signal that the recent trend is weaker than the longer-term one. Even if price was momentarily above the 200-day, the trend structure would be deteriorating. This condition ensures the moving averages are stacked in the correct order — the prerequisite for a genuinely healthy and strengthening uptrend, not one that is already topping out.
Logic Block 3 — The Secret Sauce (Rising 200 SMA)
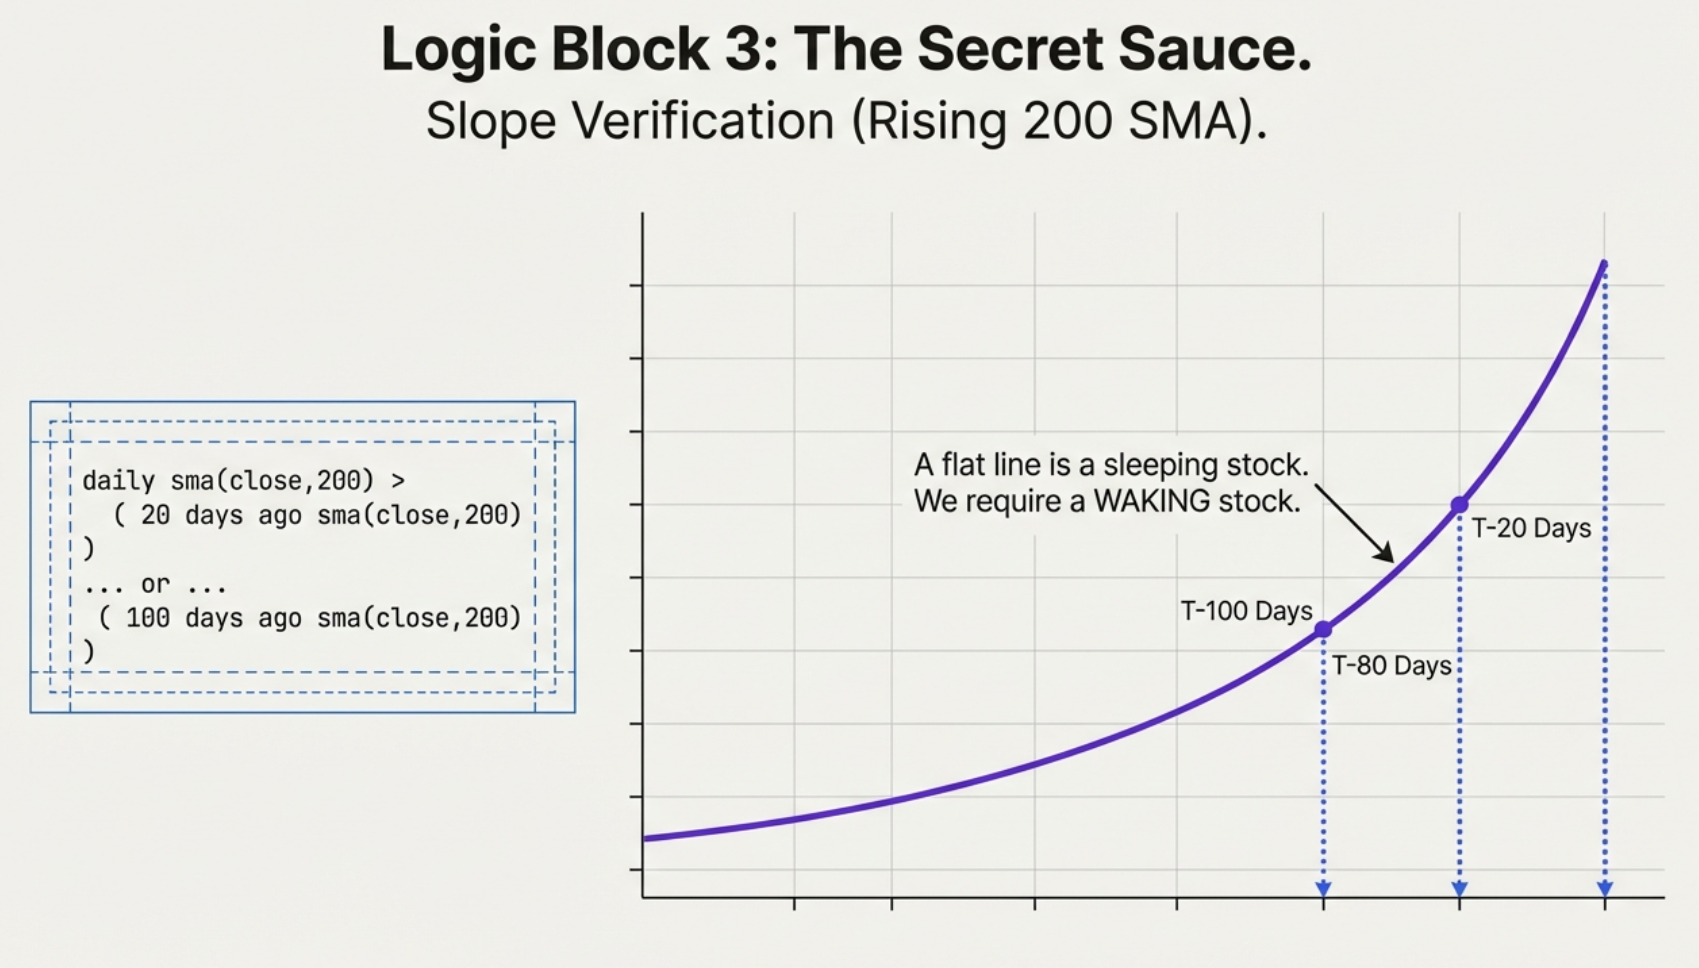
This is the single most important condition in the entire scanner. It eliminates the largest category of false signals. Here is the problem it solves:
A stock can be above its 200-day SMA even when the 200-day is flat or declining. Imagine a stock that crashed from ₹500 to ₹200, then bounced to ₹240 and is now sitting just above its still-declining 200-day average. A basic screener would flag this as bullish. This scanner rejects it — because the 200-day SMA itself is still pointing downward.
A flat 200-day SMA is a sleeping stock. A rising 200-day is a waking stock. By checking the 200-day against historical values from roughly one month ago, four months ago, and five months ago, the scanner confirms a genuine long-term uptrend — not a temporary recovery blip within a sustained downtrend. This single condition is what separates a true Stage 2 institutional markup from a dead-cat bounce in a Stage 4 collapse.
Logic Block 4 — Momentum Acceleration
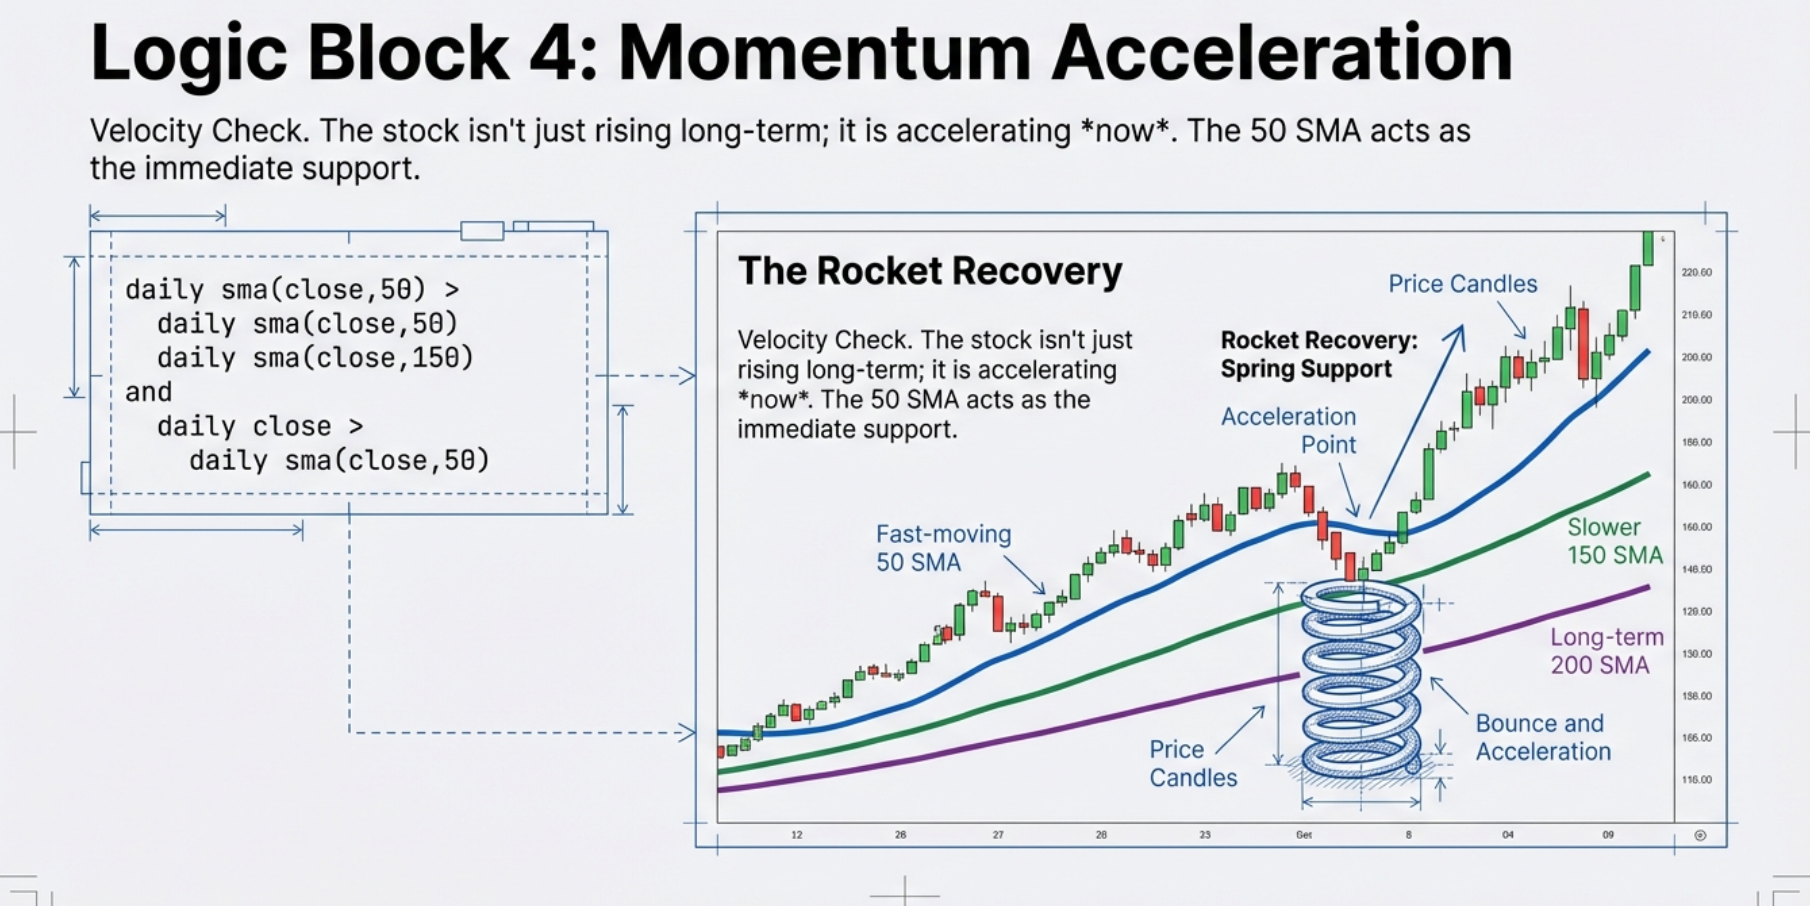
The 50-day SMA sitting above the 150-day means the most recent 2 months of trading are stronger than the medium-term 7-month average — the stock is accelerating, not decelerating. Short-term momentum is outrunning the medium-term trend.
Then there is the final confirmation: today’s price must be above even the 50-day average. The price is riding on top of the trend, not lagging below it. This rules out stocks that are technically in Stage 2 on the longer timeframes but are currently mid-pullback.
The combined visual effect of all four conditions so far is what traders call the “fan” alignment: from the bottom of the chart, you have the 200-day SMA, then the 150-day above it, then the 50-day above that, then the daily price riding on top of all of them — a perfectly stacked hierarchy of strength, each layer confirming the one above it.
Logic Block 5 — Range and Structure
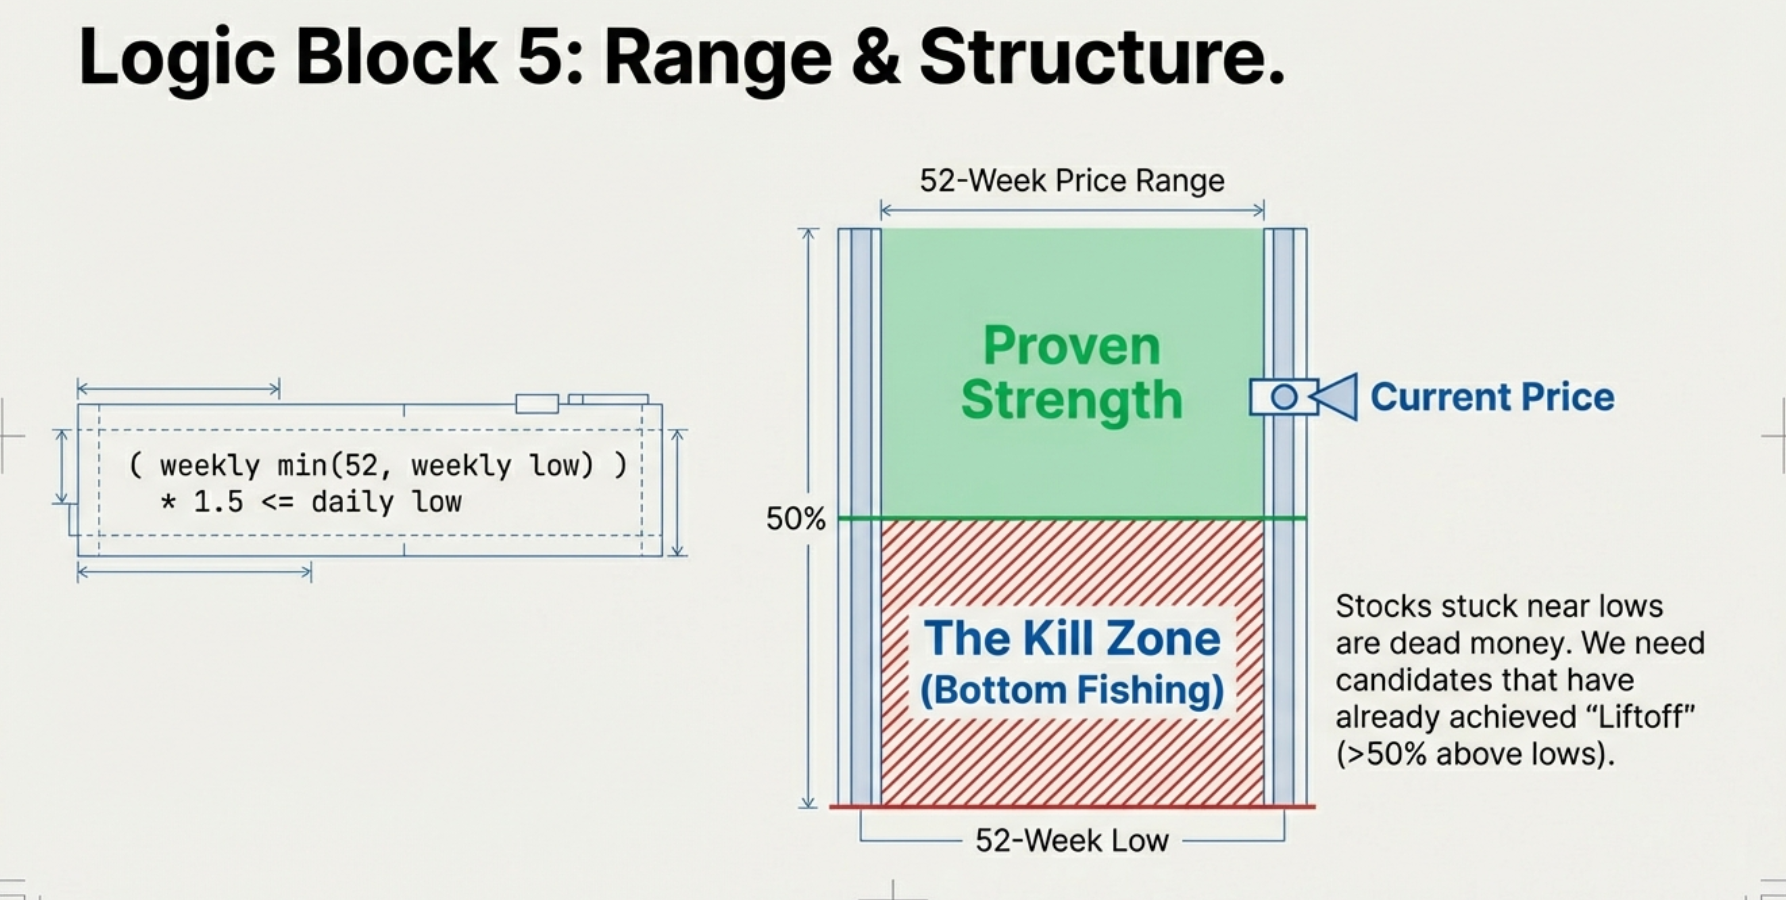
This creates the Goldilocks Zone within the annual price range. Two sub-conditions work together:
The floor (50% above the annual low): If a stock’s lowest price in the past year was ₹100, the scanner requires it to be trading at ₹150 or higher. This eliminates bottom-fishers — stocks that are barely waking up from the floor with unproven upside. The first 50% of the move off an annual low is the riskiest phase, prone to false starts and reversals. Stocks that have already cleared this level have demonstrated real institutional conviction. The train has left the station and proven it has power.
The ceiling (within 25% of the annual high): If the 52-week high is ₹200, the stock must be at ₹150 or higher. This creates the upper zone. Combined with the lower floor, the stock must sit in the upper quarter of its annual trading range — proven strength, not bottom-fishing, and close enough to its highs to be in active markup territory approaching potential breakout.
Logic Block 6 — The Liquidity Gate
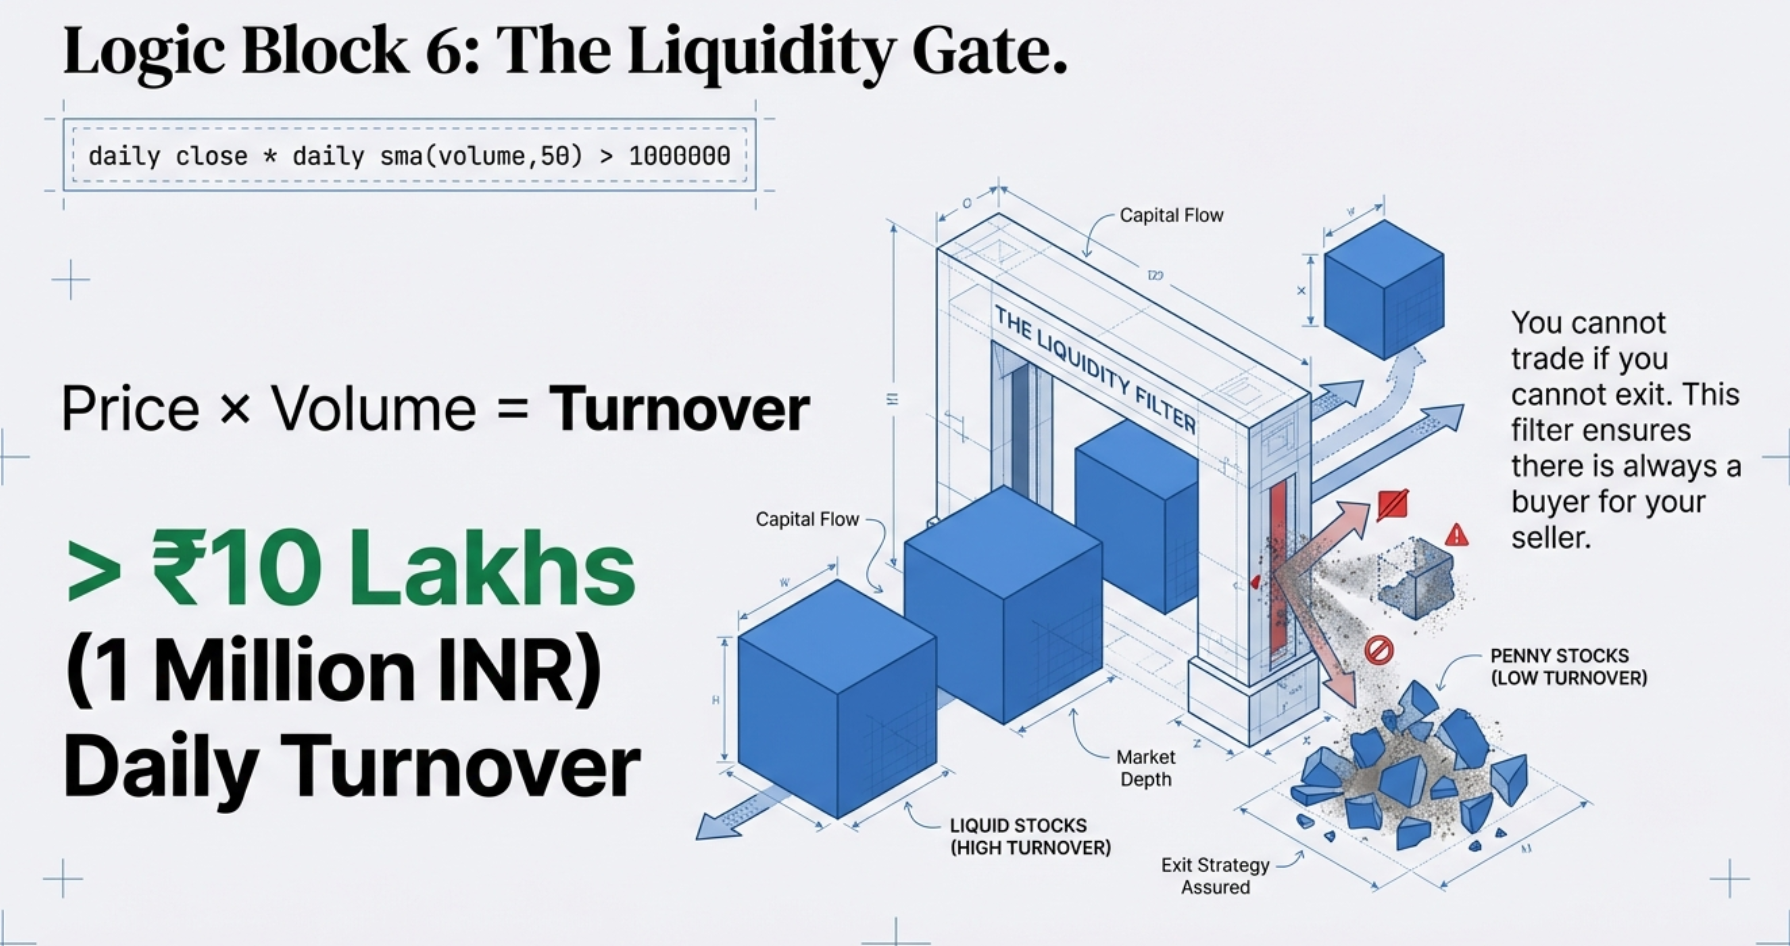
The NSE lists thousands of stocks. Many technically satisfy all the Stage 2 trend conditions above but trade only a few hundred or thousand shares each day. If the total daily trading value of a stock is ₹2 lakh and you want to build a ₹1 lakh position, you are instantly consuming 50% of the day’s volume. Your buy order moves the price against you on entry. And when you want to exit, there may not be enough buyers to absorb your shares without driving the price down sharply.
The ₹10 lakh filter ensures that every stock in the Stage 2 results has enough real daily liquidity that a realistic position can be built and unwound without distorting the market. It filters out illiquid micro-caps where Stage 2 conditions may technically be met but where real-world execution is practically impossible.
Two additional safety conditions complete the filter: the closing price must be above ₹10 (eliminating penny stocks prone to manipulation and extreme volatility), and daily volume must be greater than zero (confirming the stock actually traded today, ruling out suspended or halted securities).
The Complete Stage 2 Checklist
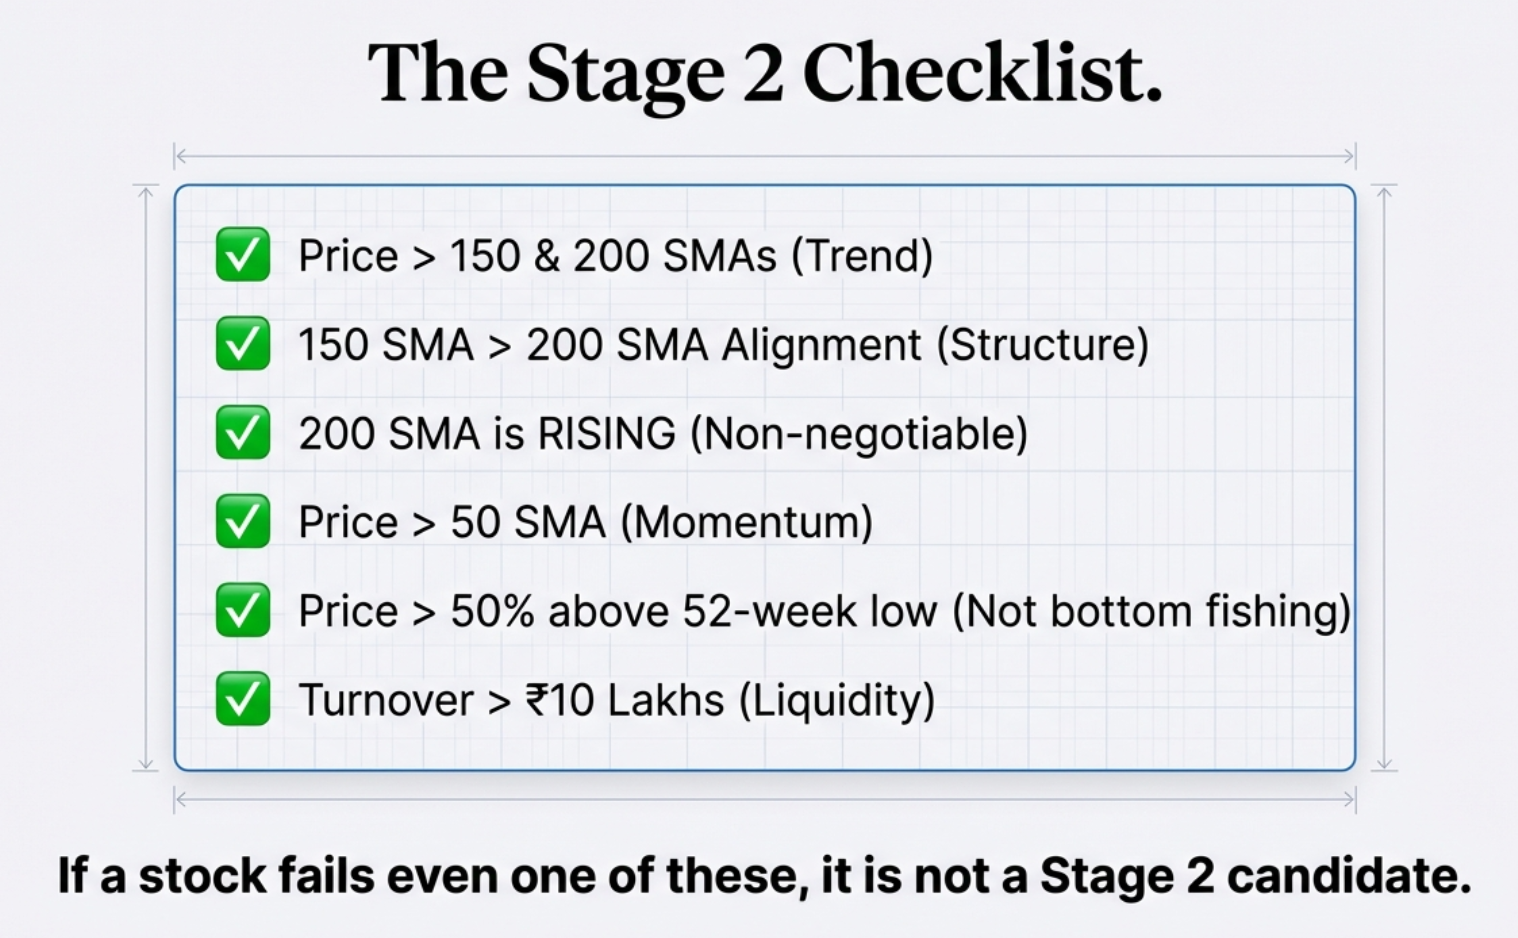
All six gates must be open simultaneously. A stock failing even one does not appear in the Stage 2 tab.
In the table below, every condition is listed with its plain-English meaning, what it checks, and why it is in the scanner.
| # | Condition | What It Checks | Why It Matters |
|---|---|---|---|
| 1 | Close > SMA(150) | Daily closing price above the 150-day simple moving average | Confirms basic medium-term uptrend; price is above the intermediate average that represents roughly 7 months of trading |
| 2 | Close > SMA(200) | Daily closing price above the 200-day simple moving average | The golden cross zone; the 200-day is the most widely monitored trend line by institutional traders globally |
| 3 | SMA(150) > SMA(200) | The 150-day SMA is above the 200-day SMA | Moving average alignment confirmed; the faster average is above the slower average, indicating sustained medium-term strength exceeding long-term baseline |
| 4 | SMA(200) Rising | The 200-day SMA value today is higher than its value 20, 80, and 100 trading days ago | The single most important condition. The 200-day SMA itself must be trending upward — not flat or sideways. Checked at three historical points to confirm a genuine trend rather than a brief uptick |
| 5 | SMA(50) > SMA(150) | The 50-day SMA is above the 150-day SMA | The shortest measured SMA is above the medium-term average; short-term momentum is stronger than the medium-term trend, confirming acceleration rather than deceleration |
| 6 | Close > SMA(50) | Daily closing price above the 50-day simple moving average | Price is above even the shortest measured average; confirms there is no short-term pullback that has broken the near-term uptrend |
| 7 | Price in 52W Range | Weekly low ≥ 52-week low × 1.5 and weekly high ≥ 52-week high × 0.75 | Confirms the stock is trading in a meaningful position within its annual range — not so far from its 52-week low that it has already made a full extended move, and close enough to its 52-week high to be in active markup territory |
In addition to the seven SMA conditions, the screener applies a liquidity filter: the product of the daily closing price and the 50-day average volume must exceed ₹10,00,000 (ten lakh rupees). This eliminates thinly traded stocks where even a modest position size would move the market, making the screener results practical for real trading rather than theoretical.
A stock above a flat or declining 200-day SMA is NOT in Stage 2. It may be bouncing within a Stage 4 downtrend, or topping out in Stage 3 distribution. A rising 200-day SMA confirms that the long-term institutional trend is genuinely pointing upward. The Finmagine Trader scan checks three historical points — 20, 80, and 100 trading days ago — to ensure the 200-day is trending upward, not merely ticking up for a brief moment before resuming a flat or declining trajectory. This single condition eliminates a large class of false Stage 2 signals that simpler screeners miss entirely.
Why It Works — Real Stocks, Real Returns
The Stage 2 framework is not a backtested theoretical model. These are real NSE-listed stocks that followed the three-step momentum pattern — a dip below the 200-day average, a powerful rocket recovery back above it, and a breakout into all-time high territory — and the results speak for themselves.
Varun Beverages (VBL)
Held over 4 years — through the Russia-Ukraine war, global inflation, aggressive interest rate hikes, and multiple “market crash” fears. The Stage 2 trend never broke.
Mahindra & Mahindra (M&M)
A Nifty 50 blue-chip giant. Same three-step pattern: dip, rocket recovery, breakout. Stage 2 logic applies equally to large-caps and small-caps.
L&T Finance (LTF)
5 months from June to November. Dipped below the 200-day, recovered sharply, broke into all-time highs. While analysts debated the finance sector, the chart told the story.
Bharti Airtel
During the same period the Nifty 50 was down -2.95%. While the index went sideways, Stage 2 momentum stocks carved their own path entirely independent of the index.
Every one of these stocks followed the same blueprint. Step 1 — The Dip: The stock traded below its 200-day moving average, shaking out weak hands and resetting sentiment. Step 2 — The Rocket Recovery: A sharp, powerful surge back above the 200-day, driven by institutional buyers recognising value. This is not a slow drift — it is a velocity change. Step 3 — The Breakout: The stock consolidates near its all-time high and then breaks through into blue-sky territory. No trapped sellers. No overhead resistance. This is the entry signal. The scanner identifies stocks in Step 2 and early Step 3 of this pattern every day.
“Bhav Bhagwan Che — Price is God. We do not argue with the market. If the price is going up, it is right. Period. The price is the only actual truth on your screen. Everything else is just a narrative.”
The VBL trade — +566% over four years — illustrates the power of letting momentum run. The initial risk on entry was roughly 15% (the distance from entry down to the 200-day EMA). The ultimate reward was 566%. That is a risk-to-reward ratio of approximately 1:40. Momentum trading is not about being right on every trade. It is about cutting losers quickly and letting winners run until the trend genuinely breaks.
Stage 2 vs a Rising Stock — What Stage 2 Is NOT
A common misconception is that any stock moving upward is in Stage 2. The stage analysis framework is more specific than that, and the distinction matters because stocks that superficially look bullish can still carry the structural characteristics of Stage 3 distribution or Stage 4 decline.
A stock can be up 20% over the past week and still NOT be in Stage 2 if that 20% move is a short-term relief rally within a Stage 4 downtrend. The SMAs are still declining, the 200-day is still pointing down, and the alignment is still broken. The rally does not change the structural stage — it merely creates a tradeable counter-trend bounce, which carries a fundamentally different risk profile.
A stock can be above its 200-day SMA and still NOT be in Stage 2 if the 200-day SMA itself is flat or beginning to decline. A stock bouncing above a flat 200-day SMA may be in the early stages of an attempted Stage 1-to-Stage-2 transition, or it may be in the late stages of Stage 3 distribution where price is still nominally above the 200-day but the trend is deteriorating. Without a rising 200-day, Stage 2 is not confirmed.
Checking only “above the 200-day SMA” is not Stage 2 analysis — it is a single condition that includes many Stage 3 and Stage 4 stocks. The Finmagine Trader Stage 2 scan requires all seven conditions to be true at once. A stock failing even one condition — for example, the SMA(50) falling below SMA(150) while everything else holds — does not appear in the Stage 2 tab.
| Scenario | Above 200 SMA? | 200 SMA Rising? | SMA Alignment (50>150>200)? | Passes Stage 2 Scan? |
|---|---|---|---|---|
| Confirmed Stage 2 stock | Yes | Yes (all 3 checks) | Yes | Yes |
| Stock above flat 200 SMA | Yes | No | Partial | No |
| Stage 4 bounce above 200 SMA | Briefly yes | No (200 SMA still declining) | No | No |
| Stage 3 topping stock | Yes | Flattening | Breaking down | No |
| Short-term rally only (SMA(50) below SMA(150)) | Yes | Yes | No | No |
The practical implication of this distinction is significant: a trader who uses “above the 200-day SMA” as a proxy for Stage 2 will have a watchlist roughly four to five times larger than the Finmagine Trader Stage 2 tab, and a meaningfully higher proportion of stocks in late-stage distribution or early decline. The seven-condition scan is more conservative precisely because the false positive rate of the single-condition approach is too high for practical trading.
Stage 2 in Indian Markets — Key Observations
Applying Weinstein’s framework to the NSE universe produces some patterns that are consistent with international markets and some that are distinctly Indian. Understanding these patterns makes the Stage 2 tab more useful than treating it as a simple filter output.
The Stage 2 universe on the NSE typically contains 100–200 stocks on a healthy trading day. This range reflects a bull phase where multiple sectors are participating in an institutional markup. When the count falls below approximately 80 stocks, it is a meaningful signal that market health is deteriorating — fewer sectors are sustaining institutional buying, and the breadth of the uptrend is narrowing. A Stage 2 count below 80 is a prompt to reduce position sizing, tighten stops on existing positions, and avoid initiating new momentum trades. When the count rises above 200 stocks, it typically indicates a mature bull phase where many stocks have been in uptrend for an extended period — late-cycle conditions where risk management becomes more important than finding new entries, and where tightening stops is more rational than adding new positions.
The liquidity filter (₹10 lakh minimum daily turnover) is particularly important in Indian markets because the NSE lists thousands of stocks across a wide range of market capitalizations and trading activity levels. Without a liquidity filter, a Stage 2 screener for Indian markets would return many technically compliant stocks that trade a few thousand shares per day — stocks where a position of even ₹50,000 would constitute a meaningful percentage of daily volume and move the price on entry and exit. The ₹10 lakh filter ensures that every stock appearing in the Stage 2 tab can accommodate a practical trading position without significant slippage.
BSE-only stocks are excluded from the screener. The screener draws on NSE data, and stocks that are listed only on the Bombay Stock Exchange without an NSE listing are not covered. In practice, this affects a relatively small number of stocks — the vast majority of actively traded Indian equities are dual-listed.
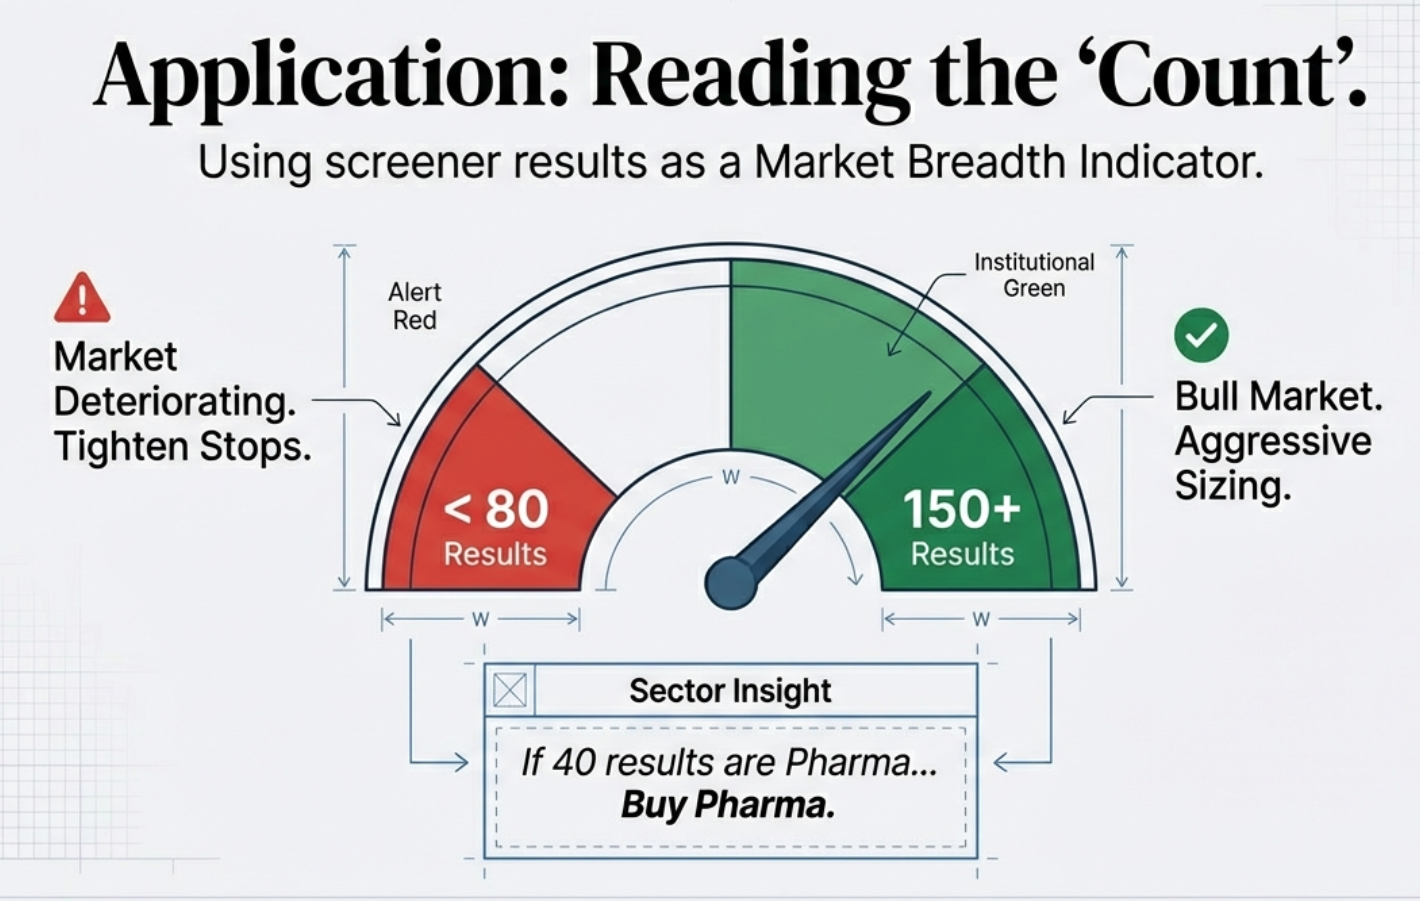
Reading the Count — the number of Stage 2 results is a market breadth indicator more reliable than any single index.
If 40 of the current 153 Stage 2 stocks are in the pharmaceutical sector, that sector is in an institutional markup phase. You can identify which sectors institutions are currently favouring simply by examining the distribution of Stage 2 results — no separate sector scanner required. When a sector begins to disappear from Stage 2 results over successive days, it is a signal that institutional rotation out of that sector may be underway. This is one of the simplest and most actionable uses of the Stage 2 tab beyond the obvious one of finding individual stock candidates.
Stage 2 + Near High — The Swing Trader’s Tab
The Stage 2 tab returns approximately 153 stocks on a typical day — a substantial universe for research, but still requiring significant work to identify the highest-priority candidates. The Stage 2 + Near High tab applies a second filter to that universe: among all Stage 2 stocks, which ones are simultaneously trading near their 52-week high?
Near 52-week high in the Finmagine Trader context means the stock is within a tight range of its 52-week high. At this price level, every investor who has held the stock for the past year is sitting on a profit. There are no trapped sellers — no investors waiting for the stock to return to their entry point so they can break even and exit. The stock is in price discovery territory, and the supply overhang that typically caps rallies at prior resistance levels does not exist. This absence of overhead supply is the structural reason why near-high stocks often continue higher rather than stalling.
Combining Stage 2 (confirmed institutional uptrend) with Near 52-Week High (no overhead supply) creates a setup where the trend is confirmed, the structural resistance is absent, and price is at its strongest recent position. The resulting list is approximately 36 stocks — a highly practical number for swing trading research.
Stage 2
All seven SMA conditions confirmed. Institutional uptrend in place. Full momentum universe. Approximately 153 stocks on a typical day.
Stage 2 + Near High
Stage 2 stocks also near their 52-week high. No overhead supply. Price in discovery territory. Approximately 36 stocks — the swing trader’s shortlist.
All Three
Stage 2 + Near High stocks also trading on above-average volume today. Institutional buying confirmed in the current session. Approximately 6 stocks — highest conviction.
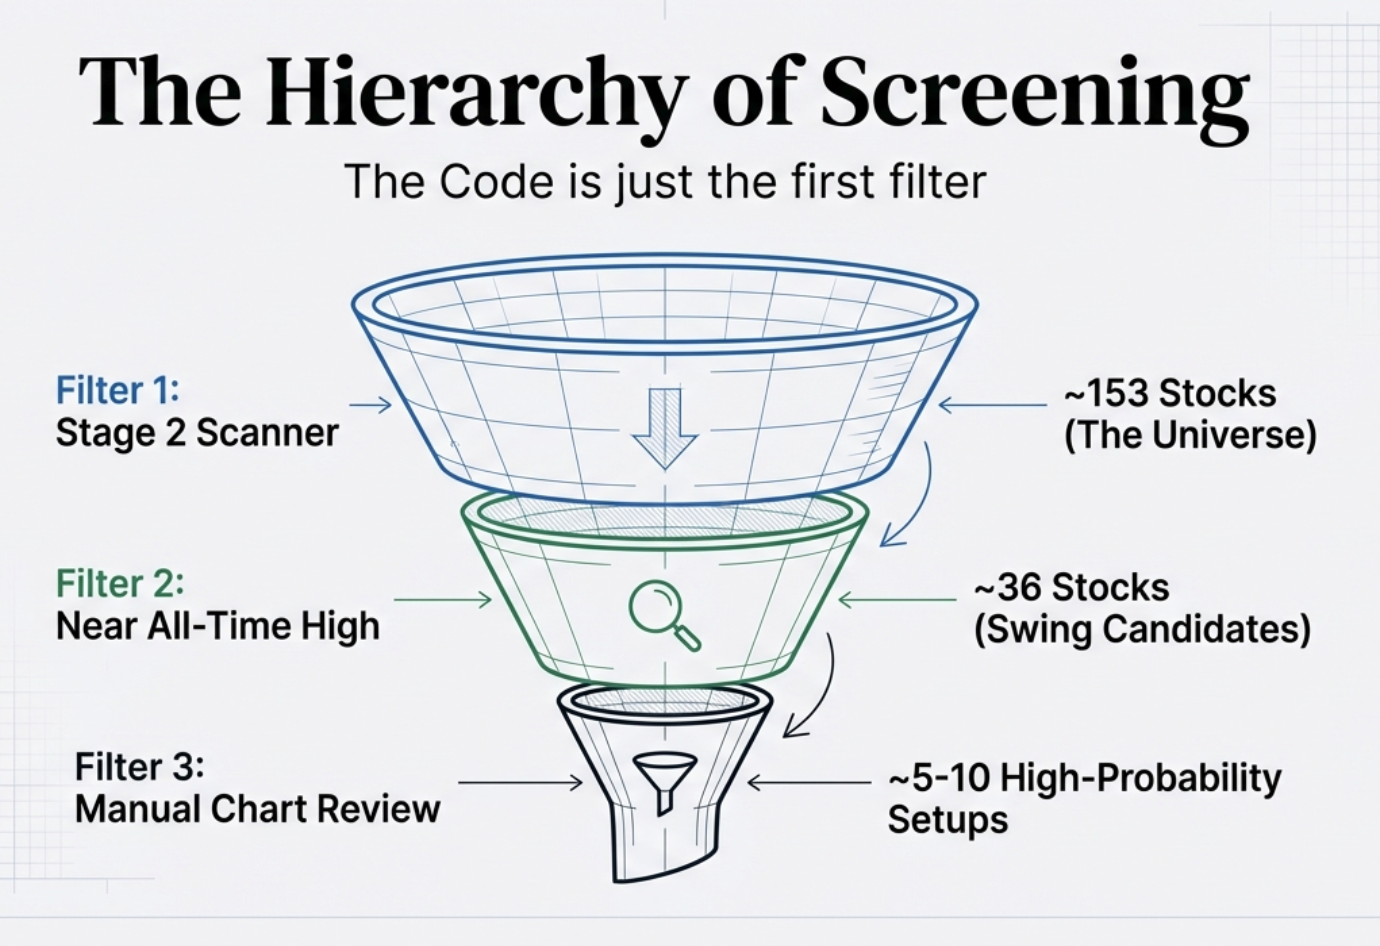
The Hierarchy of Screening — the scanner is the first filter, not the complete answer. Three levels progressively sharpen conviction.
The Stage 2 + Near High tab is purpose-built for swing trades of 2–10 days and positional trades of 2–8 weeks. The confirmed uptrend means the path of least resistance is up. The near-high position means there is no overhead resistance to work through. These are the stocks where a catalyst — earnings beat, sector news, broad market strength — has the least friction in translating into continued price appreciation.
A stock in the Stage 2 + Near High tab that has not yet seen a volume surge is a pre-breakout candidate. The setup is structurally complete — uptrend confirmed, no overhead supply — but institutional buying has not yet arrived in force today. Use these stocks to build your alert list. Set price alerts at the prior high or at a breakout level on the chart. When volume comes in and the stock enters the All Three tab, the setup is fully confirmed and actionable. Stage 2 + Near High gives you the candidates in advance; All Three signals when the move is live.
The Execution Workflow — From Scanner to Trade in Under 60 Seconds
The scanner does the heavy lifting. But a result on a screen is not a trade. There is a three-step workflow that converts the raw Stage 2 list into a focused, actionable shortlist — and the whole process takes less than 60 seconds on a typical morning.
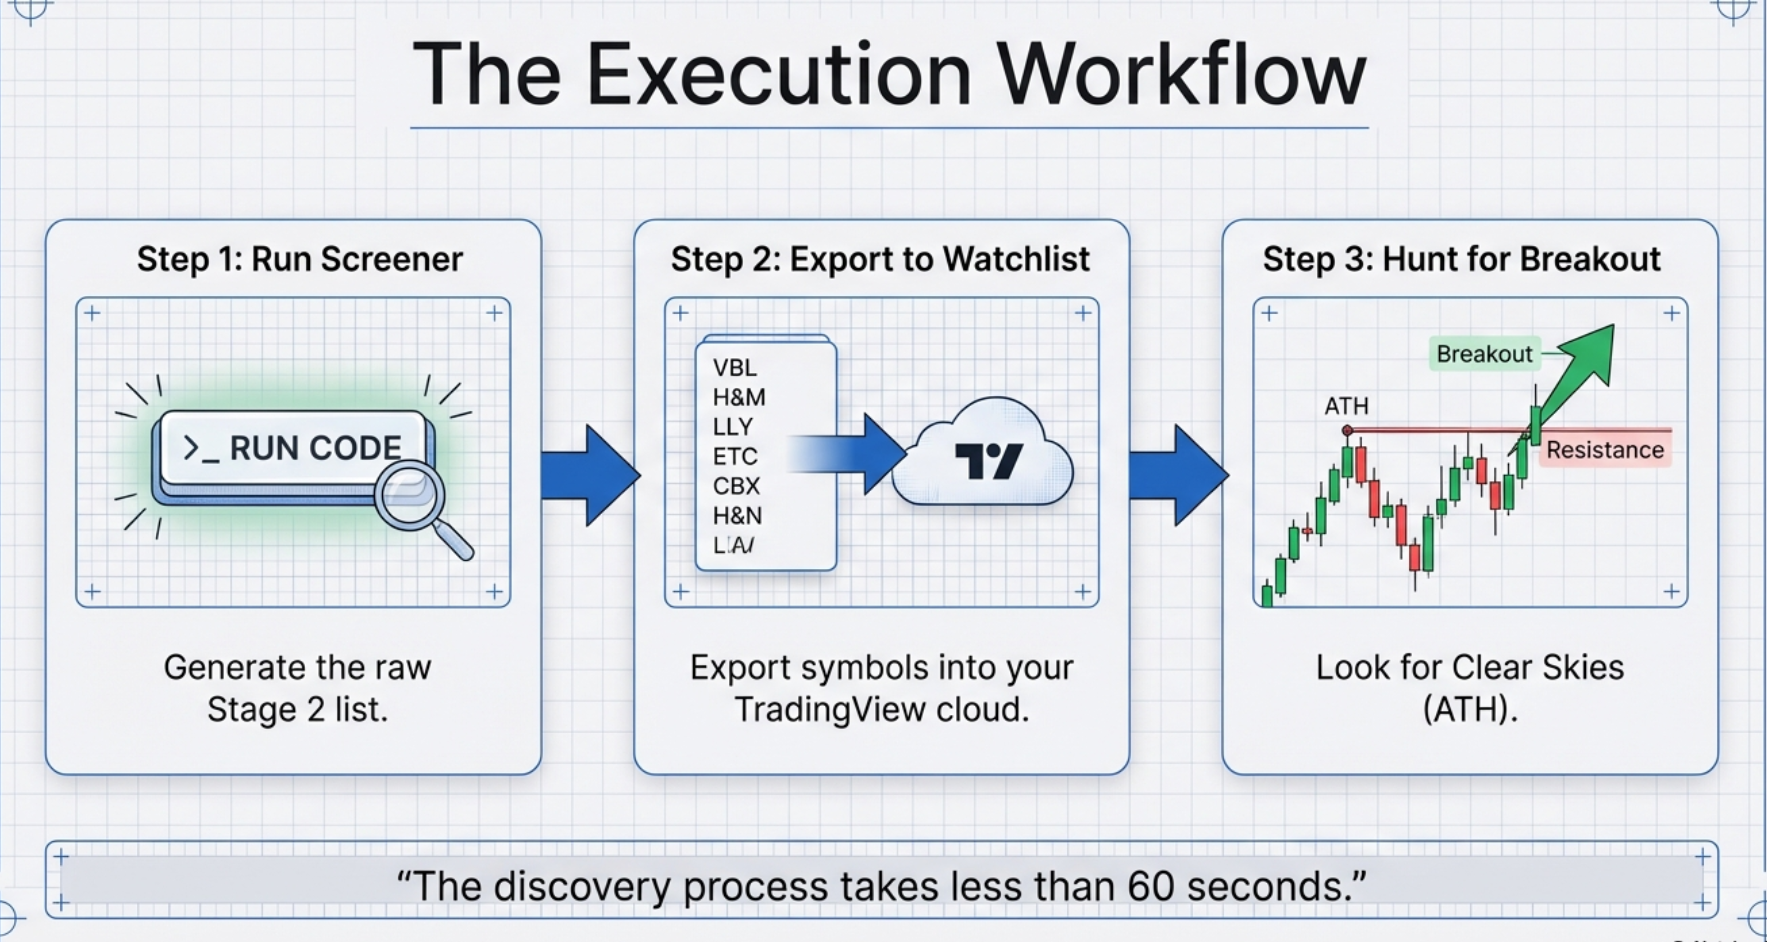
The discovery process takes less than 60 seconds — the scanner handles the 2,000+ stock universe; you handle the final 5-10.
Run the Scanner
Open Finmagine Trader. The Stage 2 tab is already populated — all seven conditions checked against every NSE-listed stock. Check the count. Note which sectors dominate.
Switch to Stage 2 + Near High
From ~153 stocks, this drops you to ~36 pre-breakout candidates with confirmed uptrend and no overhead supply. Use the TV button to export symbols to TradingView for visual review.
Hunt for the Breakout
On each chart, verify the three-step pattern: a prior dip, a rocket recovery, consolidation near the high. Identify the pivot point (the prior high). Set a price alert. When All Three signals fire with volume, the setup is live.
Newly listed companies carry a unique advantage after their initial listing period: there is no chart history above the listing high. When an IPO breaks its initial listing-day high for the first time, every buyer above that level is in profit — but more importantly, there are no buyers trapped from a prior peak, because no prior peak exists. Above the listing high, it is pure price discovery with zero overhead resistance. This setup appears in the Stage 2 + Near High tab when the newly listed stock meets all the trend conditions and is near that initial high. Wait for the break of the listing-day high on volume — and the path of least resistance is unobstructed.
Risk Management — The Part That Keeps You in the Game
The most sophisticated scanner in the world is useless if you cannot survive the inevitable losing trades. Even the best momentum setups fail. The market does irrational things. What separates professionals from retail traders is not the ability to pick winners — it is the discipline to cut losers before they destroy the portfolio.
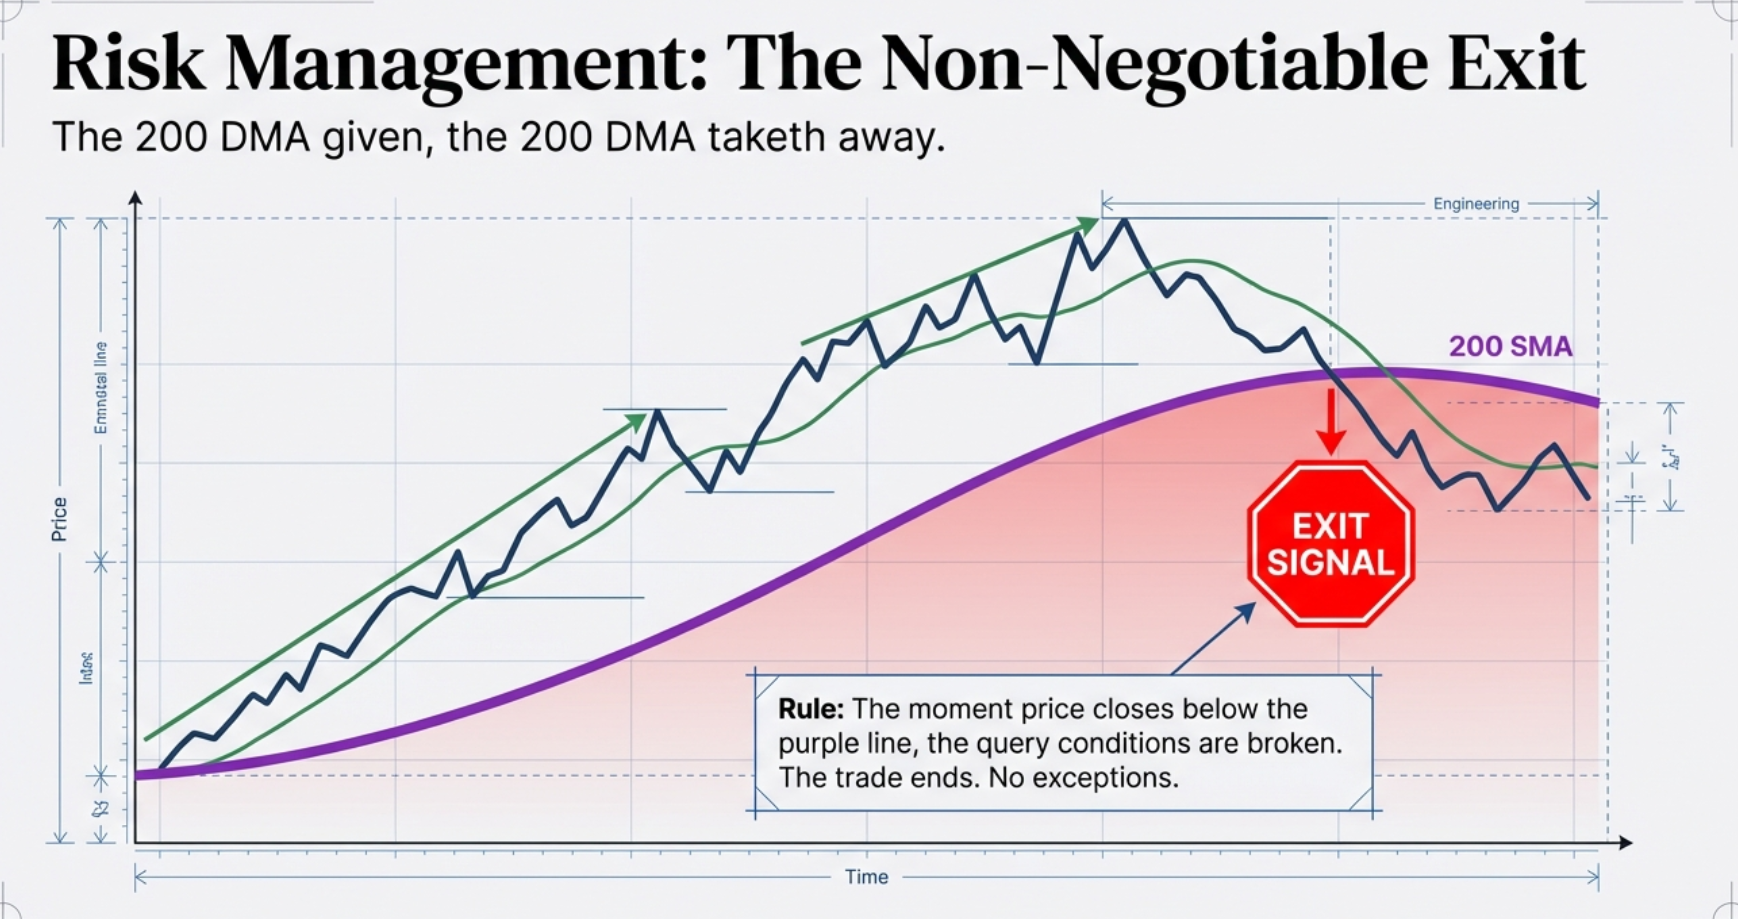
The Non-Negotiable Exit — the moment price closes below the 200-day moving average, the trend is broken. The trade ends.
When a Stage 2 stock’s closing price drops below its 200-day moving average, sell the entire position. No hoping. No waiting for a bounce. No “but the fundamentals are still good.” The moment this line breaks, Stage 2 is no longer confirmed. You do not know how deep the collapse will go. Your maximum loss is capped at roughly 10–20% (the distance from entry to the 200-day). Without this rule, you can be the trader who loses 50% or more on a single position.
Why 200-day Moving Average for the Exit?
The scanner uses the 200-day Simple Moving Average (SMA) to identify Stage 2 stocks. For the exit, many traders prefer the 200-day Exponential Moving Average (EMA). The EMA is mathematically weighted to respond more quickly to recent price data, giving a slightly earlier warning when a trend reverses. Whether you use the SMA or EMA, the principle is identical: when the dominant long-term trend line is broken, the trade is over.
Position Sizing — The Formula That Removes Emotion
Before every trade, calculate the maximum loss you are willing to accept on that position. Then determine your risk per share — the distance from your planned entry price down to the 200-day average (your stop level). Divide the first by the second:
Position Size = Maximum Acceptable Loss ÷ Risk Per Share
Example: Max loss ₹5,000 ÷ Risk per share ₹25 = 200 shares
This formula removes all emotion from sizing. It does not matter how excited you are about the setup, how many times you have seen this pattern, or how confident the chart looks. The formula tells you exactly how many shares to buy. No more, no less.
Hold 7 to 10 Momentum Trades Simultaneously
A single momentum trade, however well-researched, can fail. The strategy works in aggregate — across a diversified portfolio of 7 to 10 simultaneous Stage 2 positions. If one hits the 200-day stop and closes at a 15% loss, three or four others may be up 30%, 50%, or 100%. The math is asymmetric. The risk on any individual trade is 10–20%. The reward, for stocks that stay in Stage 2 for months or years, is effectively unlimited.
This is the venture capital model applied to public markets: take many calculated asymmetric bets, cut the losers fast, and let the winners compound.
Warning Signs — When a Stage 2 Stock Is Exiting Stage 2
Stage 2 does not last indefinitely. Every stock that enters Stage 2 will eventually transition to Stage 3 distribution as institutional selling begins to offset buying pressure. Recognising the early warning signs of a Stage 2-to-Stage-3 transition is as important as identifying stocks entering Stage 2 in the first place.
The visible warning signs on the price chart include: price making new highs on declining volume, a classic distribution pattern where the stock continues to advance but on progressively weaker institutional participation; price pulling below the SMA(50) for the first time in months, breaking the near-term support that has held throughout the Stage 2 phase; and the SMA(150) beginning to flatten and converge toward the SMA(200), the first indication that the medium-term trend is decelerating.
These are chart-based warning signs that any trader can observe manually on TradingView. But there is a systematic advantage built into the Finmagine Trader workflow: when a stock’s SMA conditions deteriorate sufficiently, it automatically disappears from the Stage 2 tab. The screener passively monitors every Stage 2 stock in the background. A trader who notes each day which stocks from their watchlist are still appearing in Stage 2 — and which have quietly dropped off the list — has a systematic exit signal without needing to manually check each holding’s SMA conditions.
Holding Stage 2 winners into Stage 3 distribution. The transition is rarely dramatic — it unfolds over weeks, with the stock appearing to pause and consolidate rather than obviously declining. The daily Stage 2 scan output is your passive monitoring system. When a stock you hold stops appearing in the Stage 2 tab on successive days, that is your structured prompt to re-examine the position. The screener removes the cognitive bias that causes traders to rationalise continued holding of deteriorating positions.
The key advantage of systematic screener-based monitoring over manual chart watching is consistency. A trader who manually checks 15 stocks in their watchlist every morning will miss signals on the days they are busy, skip the analysis on low-conviction days, and apply different standards to different stocks depending on their emotional attachment to the position. The Stage 2 screener applies the same seven conditions to every stock every day with no exceptions and no emotional overlay.
Building Your Stage 2 Research Process
The Stage 2 tab is most powerful when it is used as part of a structured daily process rather than consulted sporadically. The following four-step process integrates Stage 2 analysis into a morning workflow that takes under 10 minutes and systematically covers market health assessment, sector observation, candidate identification, and chart-based shortlisting.
Morning: Check the Count
Open Finmagine Trader and note the Stage 2 count. Above 150: bull phase healthy, full position sizing appropriate. Below 80: market health deteriorating, reduce new position sizes and tighten stops on existing holdings.
Sector Scan
Scan through the Stage 2 list and note which sectors dominate the results. These are the sectors where institutions are currently deploying capital. Sector rotation becomes visible without any additional tools.
Filter Down
Switch to Stage 2 + Near High for pre-breakout candidates (~36 stocks). Then check All Three for stocks where institutional buying is active today (~6 stocks). These are the immediate priority.
Research the Shortlist
For each Stage 2 + Near High stock, click the TV button to open TradingView. Look for a clean base, a clear pivot point, and volume contraction. Star your favourites and set price alerts at the breakout level.
This process requires Finmagine Trader to be open for less than 10 minutes. The screener handles the first-pass filtering across all 2,000+ NSE stocks automatically. The trader’s time is spent on the 36 highest-quality candidates, not on manually constructing lists from scratch. The combination of systematic filtering and focused chart analysis is what distinguishes professional-grade momentum research from ad hoc scanning.
“The screener identifies the stage. The chart identifies the setup. Risk management determines the bet size. All three together constitute a complete process — the stage analysis alone is the first filter, not the complete answer.”
Over time, tracking the Stage 2 count daily builds an intuition for market phases that is difficult to acquire any other way. A trader who has watched the Stage 2 count move from 180 to 220 during a strong bull phase, then contract to 60 during a correction, then recover to 150 at the start of the next upleg, develops a felt sense of market breadth that no single indicator can substitute for. The Stage 2 tab is both a daily research tool and a long-term market education system.
Bhav Bhagwan Che — Price Is King
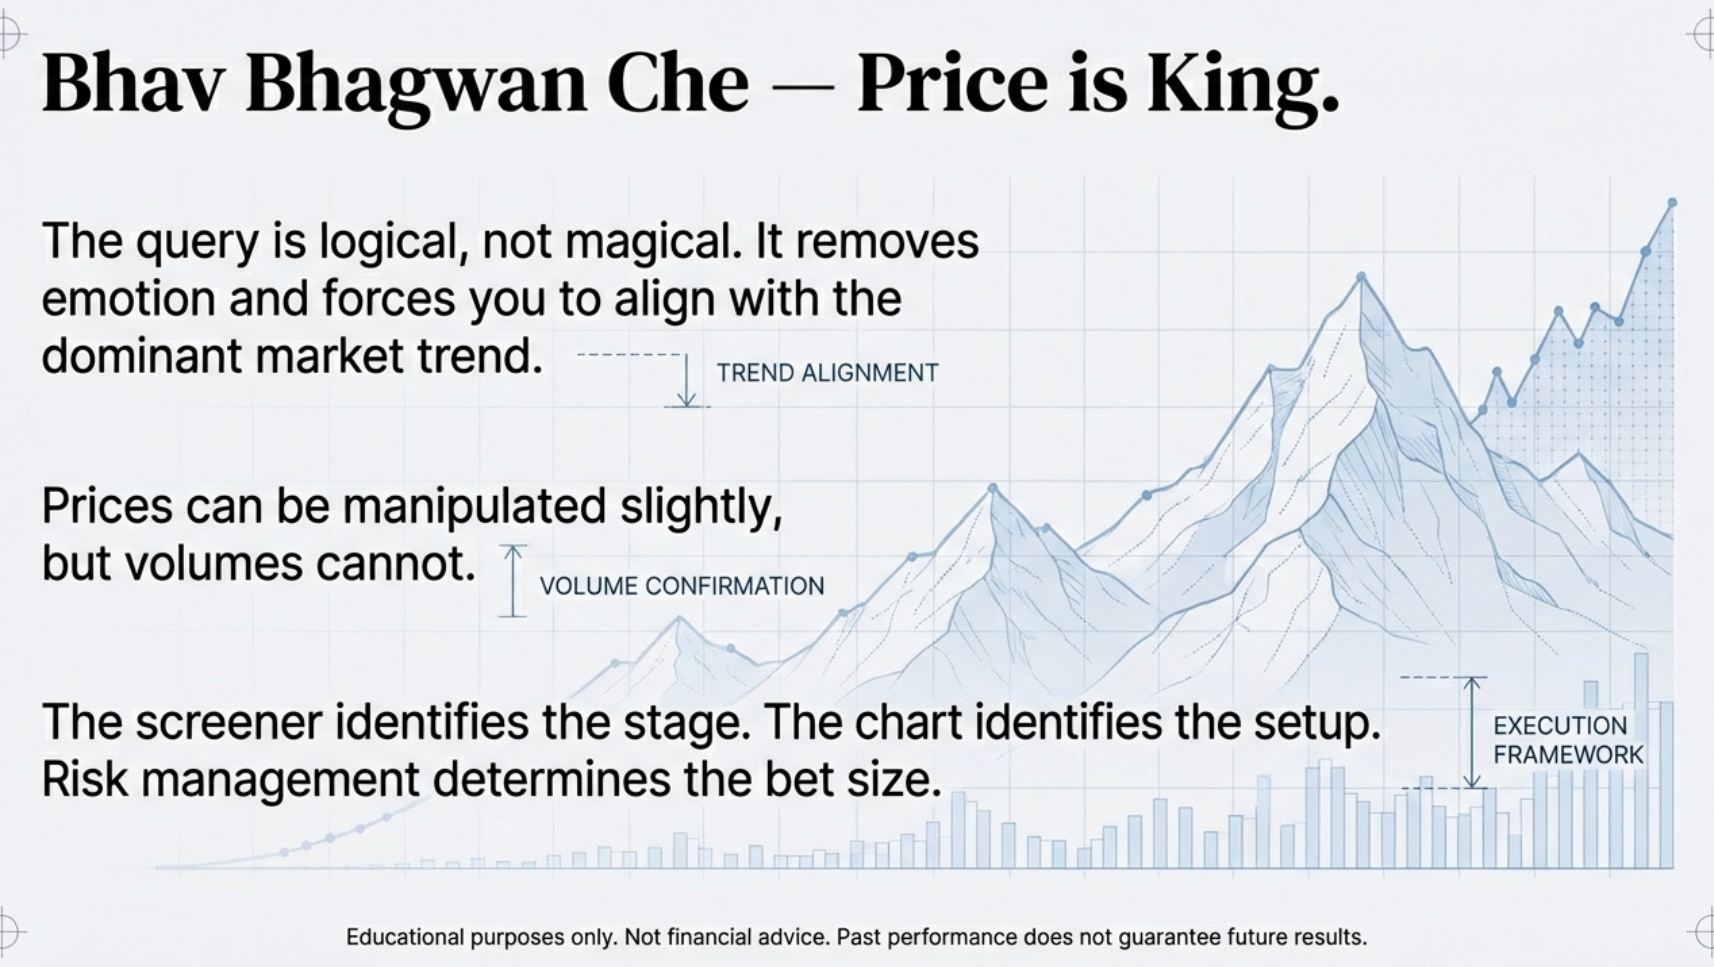
Bhav Bhagwan Che — an old Gujarati market saying that translates to “Price is God” or “Price is King.” It is the absolute mantra of the momentum trader. What it really means is this: stop arguing with the market. Stop sitting there saying a stock is too expensive, or that it should not be going up because its PE ratio is high or its earnings were disappointing. If the price is going up, it is right. Period. The price is the only actual truth on your screen. Everything else is just a narrative.
The Stage 2 scanner is not magic. It is logic. Seven precise, testable conditions that mathematically verify a stock is in the institutional markup phase — the phase where the largest and most informed players in the market have committed capital to an advancing trend. The scanner removes opinion. It removes emotion. It forces alignment with what is actually happening in the market, not with what you think should be happening.
“Prices can be manipulated slightly. But volumes cannot. And the 200-day trend cannot be faked for months. The screener identifies the stage. The chart identifies the setup. Risk management determines the bet size. All three together constitute a complete system.”
Open your portfolio right now. Look at your holdings. How many of them are in Stage 2? How many are true institutional uptrends actively approaching all-time highs? And how many are Stage 4 falling knives you are stubbornly holding, secretly hoping they will return to your entry price? The Stage 2 tab answers that question in under 10 seconds — for every stock on the NSE simultaneously.
See All Stage 2 Stocks Right Now
Finmagine Trader scans every NSE stock for all seven Stage 2 conditions in real time — 153 momentum stocks filtered to the highest-conviction setups in under 10 seconds.
Open Finmagine Trader — FreeFree Chrome Extension
Ready to scan your first momentum list?
Install Finmagine Trader and scan 2,000+ NSE stocks for Stage 2 uptrends, VCP breakouts, near 52-week highs, and volume surges — in one click.
Install from Chrome Web Store →No account required • Works on Chrome, Edge, Brave • NSE stocks only
Continue the Finmagine Trader Series
Read more articles in the Finmagine Trader series:
Introducing Finmagine Trader The All Three Signal VCP Breakout TradingView Workflow Tight Volatility Filter (v1.4.0)Stage 2 Stocks in Indian Markets — Frequently Asked Questions
The most common questions about Stage 2 analysis and the Finmagine Trader Stage 2 screener, answered in detail. Click any question to expand the answer.