Following along? Install Finmagine Trader first
Free NSE momentum scanner — no account needed • Chrome, Edge, Brave
Multimedia Learning Hub
Understand the BRS formula, the 5-component scoring system, the 5-tier tag system, and how the BRS tab transforms Finmagine Trader from a scanner into a decision engine — through a complete written guide, video walkthrough, audio deep dive, and 35 interactive flashcards
The BRS Column: One Number That Answers Five Questions Simultaneously
When every stock on the same scan tab scores 4 out of 4 signals, how do you rank them? A stock with Stage 2 + Near High + High Volume + VCP on a strong market day scores 4. So does a different stock with the same signals on a weaker day, with mixed RS, and a shaky MA structure. BRS looks underneath the signals to rank the continuous quality underneath.
- Trend Template (25 pts) — MA structure sound?
- RS vs Nifty 50 (25 pts) — beating the index?
- Proximity to 52W High (20 pts) — how close?
- Weinstein Stage (20 pts) — which cycle phase?
- Breakout Quality Bonus (10 pts) — clean base?
- Elite Breakout — BRS ≥95
- Breakout Ready — BRS 85–94
- Setup Forming — BRS 70–84
- Early Stage — BRS 55–69
- Avoid — BRS <55
- Formula section for the math
- Worked examples for intuition
- BRS Tab section for daily workflow
- 35 flashcards for everything
Video Guide: The Breakout Readiness Score — Coming Soon
A dedicated video walkthrough of the BRS tab, the 5-component formula, and the 5-tier tag system is in production. Subscribe to the Finmagine YouTube channel to be notified when it is published.
What the video will cover:
- Why binary signal counts are insufficient when 40 stocks pass the same scans simultaneously
- Each of the 5 BRS components explained with real NSE examples
- Why RS is weighted 12M > 6M > 3M and what — in the RS column means
- The proximity graduated scale: why NH (20 pts) beats near10 (14 pts) beats VCP proximity (10 pts)
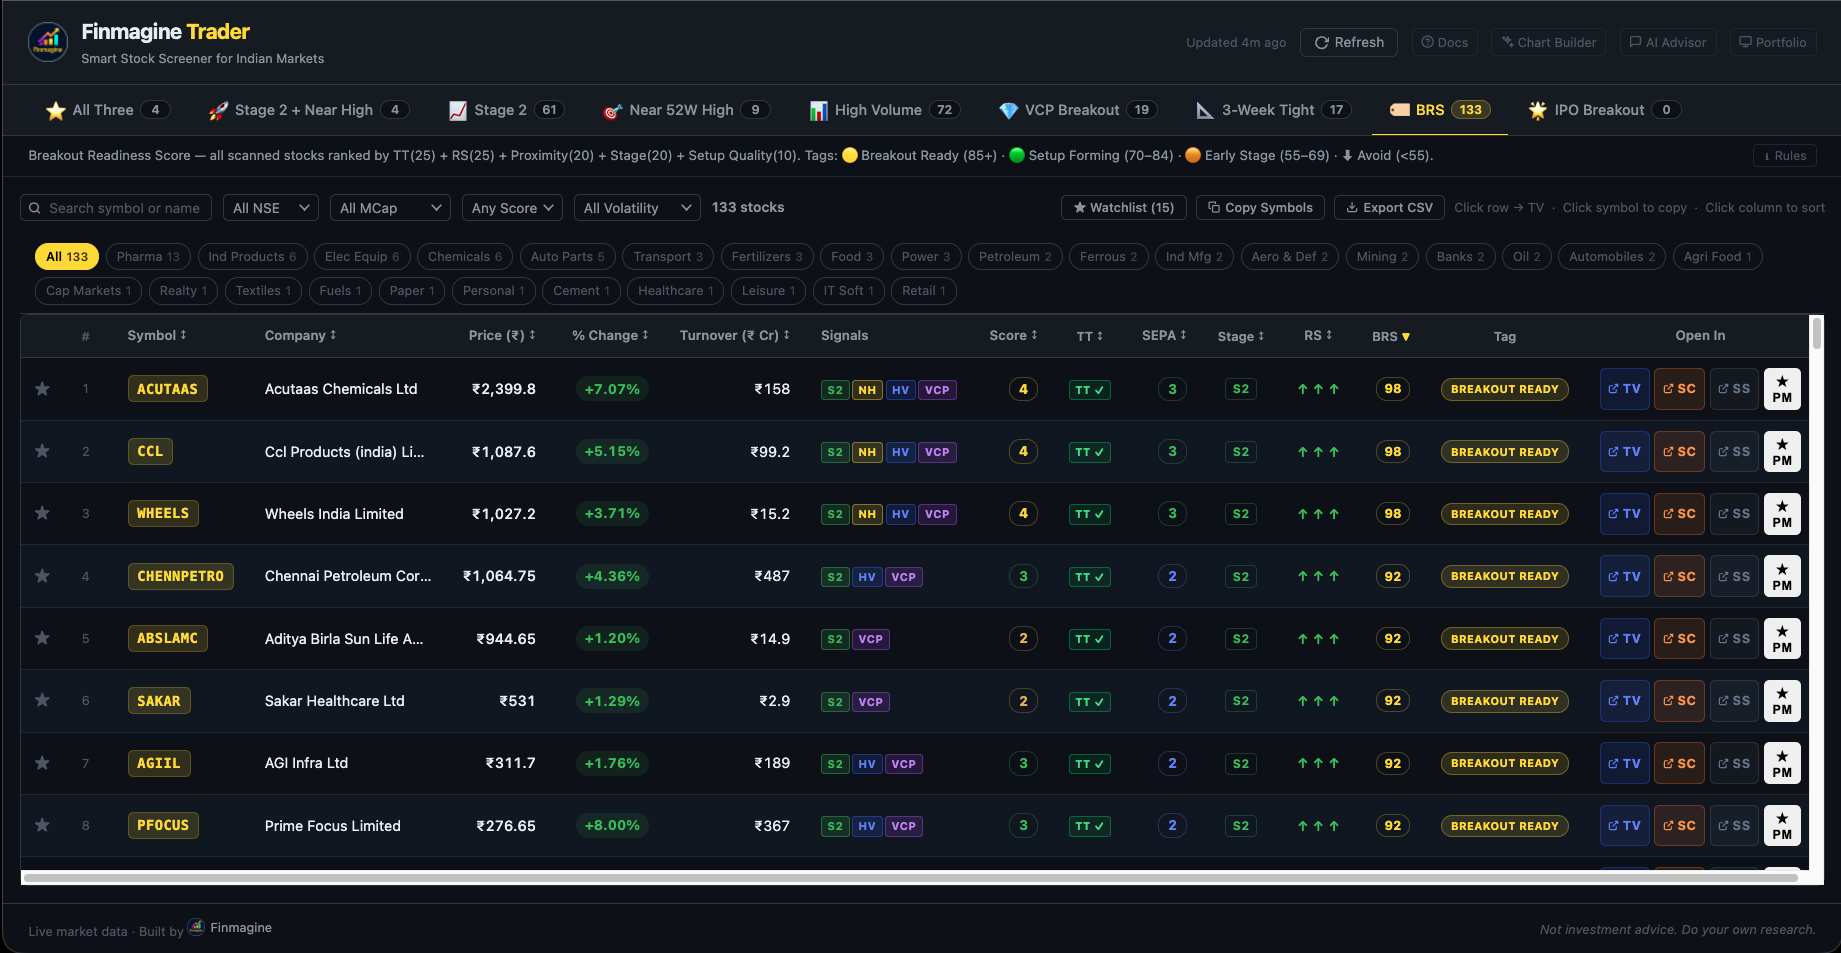
- Worked examples: ACUTAAS at 98 (Elite Breakout), ABSLAMC at 92 (Breakout Ready), AETHER at 78, CENTUM at 53 — the surface-signal trap
- The BRS tab deduplication logic and the daily decision-engine workflow
Audio Deep Dive: The Breakout Readiness Score — Coming Soon
A dedicated audio session covering the BRS formula from first principles is in production. It will be added to this page when available.
The audio will cover:
- The philosophy of composite ranking: why BRS is better than counting signals
- Each component explained with the reasoning behind its point allocation
- Why TT and Stage 2 both appear in BRS (intentional overlap, not double-counting)
- The RS lazy-loading mechanism and what “...” means while the data loads
- How to read the BRS tab in your 5-minute morning scan
- The CENTUM trap: why high Score with BRS <55 is a warning, not an opportunity
Test Your Knowledge — The Breakout Readiness Score — 35 Flashcards
Click any card to reveal the answer. Search by topic to focus on a specific area. All 35 flashcards cover the BRS formula, 5 components, 5-tier tags, BRS tab mechanics, RS mechanics, and worked examples.
Why a Score, Not Just Signals
Signals (S2, NH, HV, VCP) are binary — a stock either passes or it doesn’t. On a strong market day, 40 stocks can pass Stage 2 + Near High simultaneously. Their Score column reads 4 for all of them. But they are not equal. Some are within 1% of their 52-week high; others are 20% below it. Some outperform Nifty on all three timeframes; others are barely keeping pace. Some pass all 7 Minervini structural criteria; others barely pass Stage 2’s lenient filter. BRS converts the continuous underlying data into a comparable ranking.
The Breakout Readiness Score takes five dimensions that the signal columns either ignore or reduce to a binary, and combines them into a single 0–100 score. Every stock that appears in any of Finmagine Trader’s 8 scan tabs is scored on all five dimensions and ranked on the BRS tab. You see the full ranked universe, not just the stocks that passed today’s best scan.
“A scanner tells you who showed up to the party. BRS tells you who’s dressed for it.”
Score counts how many scan categories a stock triggered. BRS asks: what is the quality of the underlying conditions that produced those signals? Two stocks with Score = 4 can have BRS values of 98 and 53 respectively. The first is structurally excellent, outperforming the index on all timeframes, at its 52-week high, Stage 2 confirmed, VCP base forming. The second has four signals firing but a broken MA structure, mixed RS, and an unclassified Weinstein Stage. BRS makes that difference visible at a glance.
The Five Components — Formula and Rationale
BRS is a composite score assembled from five independently measured components. Each component measures a specific dimension of setup quality. Together they cover the full analytical checklist a momentum trader should run through before any position decision.
Component 1 — Trend Template (25 points)
TT passes all 7 Minervini criteria → 25 pts. TT fails (even one criterion) → 0 pts.
The binary scoring is deliberate: the MA structure is either intact or it isn’t. No partial credit for 6 out of 7 — Minervini’s framework requires all 7 simultaneously. The logic is sound: a stock that passes 6 criteria has a structural flaw somewhere in the SMA stack, the annual-range position, or the 200-day trend direction. That flaw matters.
25 points (25% of BRS) because TT is the foundational prerequisite. Every other component means less if the trend structure is broken. Stage 2 showing S2 while TT fails means the Weinstein framework qualifies the stock but Minervini’s stricter test does not. That divergence is a caution signal, not a green light.
Component 2 — Relative Strength vs Nifty 50 (25 points)
12M outperform → +12 pts | 6M outperform → +8 pts | 3M outperform → +5 pts | max 25 pts
RS is weighted by timeframe because longer-period outperformance is a more reliable signal of sustained institutional preference. 12M RS is the most important: a stock that outperforms Nifty over 12 months is demonstrating persistent allocation by investors who have tracked it through multiple market conditions. 3M RS is noisier — a stock can outperform Nifty over 3 months due to sector rotation or a one-time event. 12M outperformance requires sustained buying pressure.
A dash (—) in the RS column means the stock has insufficient price history for that timeframe (e.g., listed less than 12 months). This is not penalised — stocks with — in a period do not lose points for that period; they simply score 0 for that component’s contribution.
RS is loaded lazily: cells show “...” initially and update per-stock as ChartInk returns results, to keep initial page load fast. BRS values will update automatically as RS data arrives.
Component 3 — Proximity to 52W High (20 points, graduated)
Proximity is the most directly actionable component: it tells you how close the stock is to its breakout point and how much overhead supply it faces.
| Condition | Points | Meaning |
|---|---|---|
| NH signal (within 2% of 52W high) | 20 | At the pivot — minimal overhead supply |
| Within 10% of 52W high (near10) | 14 | Approaching the pivot — momentum zone |
| VCP or 3-Week Tight signal | 10 | Base forming below high — structure building |
| Stage 2 (no proximity signals) | 6 | In uptrend but further from breakout point |
| Stage 1 (base / accumulation) | 3 | Early — not yet approaching highs |
| Other | 0 | Too far from highs or in downtrend |
Proximity is graduated because the risk/reward profile changes dramatically as a stock approaches its 52-week high. A stock within 2% of its 52W high has virtually no overhead supply — every price above the current level is new territory for recent holders, meaning there are no trapped buyers waiting to sell to break even. A stock 30% below its 52W high has a long wall of sellers to work through first.
The near10 band (within 10% of the 52W high): this is a proprietary intermediate tier. The NH scan fires only at stocks within 2% of their 52W high. Many great breakouts are set up when the stock is at 90–98% of its high — coiling before the final push. The near10 tier (14 pts) captures this “approaching zone” between VCP proximity and the actual pivot zone.
Note: NH takes priority over near10 (a stock within 2% is also within 10%) — first match in the priority chain wins.
Component 4 — Weinstein Stage (20 points)
| Stage | Points | Meaning |
|---|---|---|
| S2 — Uptrend (Markup) | 20 | Institutional accumulation in full swing |
| S1 — Base (Accumulation) | 10 | Building a base — early opportunity |
| S3 — Top (Distribution) | 5 | Smart money exiting — caution |
| S4 — Decline | 0 | Downtrend — avoid long positions |
| — (unclassified) | 0 | Insufficient data or ambiguous structure |
Stage classification uses four parallel ChartInk scans. Priority: S4 wins if close < SMA200; then S3 if close < SMA50 AND close > SMA200 AND SMA50 < SMA150; then S2 from the existing Stage 2 scan; then S1. Stocks that pass none of the four scans show “—”.
Note on TT/S2 overlap: TT (25 pts) and Stage S2 (20 pts) both test the MA structure. This is intentional. A stock that passes both Minervini AND Weinstein simultaneously deserves to score higher than one that passes only one. The overlap is a feature — it rewards stocks confirmed by two independent structural frameworks at once. It is not double-counting; it is double-confirmation.
Component 5 — Breakout Quality Bonus (10 points)
| Setup | Points | Meaning |
|---|---|---|
| VCP + 3-Week Tight | 10 | Coiling on both daily and weekly timeframes |
| VCP only | 8 | Volatility contraction pattern active |
| 3-Week Tight only | 6 | Weekly coiling above key moving averages |
| Neither | 0 | No confirmed base pattern |
Having the right proximity and stage is necessary but not sufficient. The Breakout Quality Bonus rewards stocks that are not just near their highs but are actively forming a clean, low-risk base. A stock in Stage 2 near its 52W high but with wild day-to-day swings scores 0 here. A stock coiling in a VCP pattern (tightening price contractions with declining volume) scores 8. A stock doing so on both daily (VCP) and weekly (3-Week Tight) timeframes simultaneously scores the maximum 10.
VCP + 3-Week Tight simultaneously (10 pts) is a rare setup: the stock is contracting on both timeframes at once. Daily volatility is shrinking (VCP) AND three consecutive weekly closes are within 1.5% of each other (3-Week Tight). This dual-timeframe compression is precisely the pattern Minervini identifies as the highest-quality pre-breakout coiling condition.
Worked Examples — The Math in Action
The clearest way to understand BRS is to trace the calculation for real stocks. Each example below shows how the 5 components combine and why BRS reveals things that Score alone does not.
| Component | Condition | Points |
|---|---|---|
| Trend Template | TT ✓ — all 7 criteria pass | 25 |
| Relative Strength | RS ↑↑↑ (12M, 6M, 3M all outperform) | 12+8+5 = 25 |
| Proximity | NH (within 2% of 52W high) | 20 |
| Stage | S2 — confirmed Stage 2 uptrend | 20 |
| Breakout Quality | VCP only | 8 |
| Total BRS | 98 | |
BRS 98 — Elite Breakout tier (≥95). Near its 52W high, Stage 2 confirmed, all three RS timeframes outperforming, Trend Template intact. The missing 2 points are the difference between VCP-only (8 pts) and VCP+3WT (10 pts). To reach 100, ACUTAAS would need to also show 3-Week Tight simultaneously.
| Component | Condition | Points |
|---|---|---|
| Trend Template | TT ✓ | 25 |
| Relative Strength | RS ↑↑↑ | 25 |
| Proximity | near10 (within 10% but not within 2%) | 14 |
| Stage | S2 | 20 |
| Breakout Quality | VCP only | 8 |
| Total BRS | 92 | |
BRS 92 — Breakout Ready tier (85–94). Within 10% of its 52W high but not within 2% — so the NH scan has not yet fired, but the stock is clearly in the “approaching zone.” The near10 proximity score (14 pts) exceeds the VCP-only proximity score (10 pts), so near10 wins the proximity tier. VCP still contributes its full 8 pts via the Breakout Quality Bonus component. ABSLAMC is 6 BRS points away from ACUTAAS solely because of the proximity difference: 14 vs 20. If proximity reaches NH, BRS jumps to 98 — into Elite Breakout (≥95).
| Component | Condition | Points |
|---|---|---|
| Trend Template | TT ✓ | 25 |
| Relative Strength | RS ↑↑↑ | 25 |
| Proximity | S2 only — no near10, no VCP, no NH | 6 |
| Stage | S2 | 20 |
| Breakout Quality | Neither VCP nor 3-Week Tight | 0 |
| Total BRS | 76 | |
Perfect trend structure, outperforming on all three RS timeframes, in Stage 2 — but not yet approaching its 52W high and no base pattern forming. This is a high-quality stock in the middle of its Stage 2 advance. Add to watchlist and revisit when price enters the near10 zone (within 10% of its 52W high). The proximity and breakout quality components will both improve as the stock advances.
| Component | Condition | Points |
|---|---|---|
| Trend Template | TT ✓ | 25 |
| Relative Strength | RS ↑↑↑ | 25 |
| Proximity | NH (within 2%) | 20 |
| Stage | — (unclassified — fails S2 liquidity filter) | 0 |
| Breakout Quality | VCP only | 8 |
| Total BRS | 78 | |
AETHER is a structurally valid Minervini candidate (TT passes), near its 52W high (NH), with a VCP base and all RS timeframes green — but Weinstein Stage is unclassified (—). Why? It passes TT but fails Stage 2’s liquidity filter, so the Weinstein engine does not classify it as S2. The missing 20 Stage points drop it from a potential 98 to 78. The AETHER situation perfectly illustrates why BRS is more nuanced than Score alone: the surface signals look identical to an ACUTAAS-level stock, but the underlying structural classification reveals the difference.
| Component | Condition | Points |
|---|---|---|
| Trend Template | TT ✗ — MA structure broken | 0 |
| Relative Strength | RS ↑↑↑ | 25 |
| Proximity | NH (within 2%) | 20 |
| Stage | — (unclassified) | 0 |
| Breakout Quality | VCP only | 8 |
| Total BRS | 53 | |
NH + HV + VCP + RS ↑↑↑ all green — Score = 3 or 4, looks impressive on the surface. But TT fails (the MA structure is broken somewhere) and Stage is unclassified. BRS correctly demotes this to Avoid (53) despite the surface-level signals. This is the CENTUM trap: strong momentum signals firing in a structurally compromised stock. The extension agrees — never let strong proximity and RS signals override a broken trend structure.
The BRS Tab — Your Daily Decision Engine
The BRS tab (🏷, Tab 9) is the ninth and final tab in Finmagine Trader. It is not another scan — it is a synthesis view. All stocks from all 8 other scan tabs are collected, deduplicated (a stock appearing in Stage 2 AND Near High AND VCP is shown exactly once with all three signals merged), scored on all 5 BRS components, and displayed sorted by BRS descending.
The purpose of deduplication: without it, a stock in three scan categories would appear three times in a combined list, inflating its apparent prominence. The BRS tab shows each NSE stock exactly once, with the full picture of every scan signal it triggered, the merged Signal badge count, and its complete BRS breakdown.
Column layout on the BRS tab: all 16 columns are shown — Symbol, Company, Price, % Change, Turnover, Signals (all badges merged), Score, TT, SEPA, Stage, RS (lazy-loaded), BRS, Tag. Note that TT, SEPA, Stage, RS, BRS, and Tag columns appear ONLY on the BRS tab. All other 8 scan tabs show a simplified 10-column view for clarity and faster scanning.
Open the BRS tab after completing your other tab reviews. Sort by BRS descending (default). The top 10–15 stocks are your highest-quality candidates for the day, ranked by composite structural and momentum quality. For each stock in the Elite Breakout tier (≥95) or Breakout Ready tier (85–94), check the individual signal badges to understand what triggered it. For stocks in Setup Forming (70–84), note which component is dragging the score — that component tells you what needs to improve before the stock becomes actionable. Use the BRS tab to build your priority watchlist, then move to individual charts for entry-level analysis.
Five Tiers — What Each Tag Means
Every stock on the BRS tab is assigned one of five tags based on its BRS score. The tags are designed to give you an immediate action-readiness classification without needing to read the number.
🔥 Elite Breakout (BRS ≥95)
The rarest tier. Near-perfect structural alignment across all five BRS components simultaneously: Trend Template confirmed, outperforming Nifty on all three timeframes, at or within 2% of the 52W high (NH), Stage 2 confirmed, and a coiling base present (VCP and/or 3-Week Tight). These stocks represent the extension’s highest-conviction breakout candidates on any given day. Treat as the very top of your A-list. Still wait for a specific volume-confirmed entry trigger — Elite Breakout is a ranking, not a buy signal.
🌟 Breakout Ready (BRS 85–94)
The MA structure is sound (TT), the stock is outperforming the index on multiple timeframes (RS), it is approaching or at its 52-week high (Proximity), Stage 2 is confirmed (Stage), and ideally a base pattern is forming (BQ Bonus). This is the tier where position sizing decisions get made — not just watchlist building. A stock in this tier has the highest probability structure for a sustained breakout move. These are your A-list candidates. Still wait for a specific entry trigger (breakout above pivot on volume) — BRS is a ranking tool, not a buy signal.
📈 Setup Forming (BRS 70–84)
Strong structural quality but missing one key ingredient: either not yet close to the 52-week high (low Proximity score), or Stage is not confirmed (—, like the AETHER case), or RS is mixed on some timeframes. Add to watchlist. Monitor daily. The missing ingredient often arrives within days to weeks as the stock advances. When it crosses into the Breakout Ready tier, that is the time to escalate to active monitoring for an entry trigger.
🕑 Early Stage (BRS 55–69)
Some positive signals but significant gaps. Either TT is failing, or Stage is weak, or RS is mostly underperforming. Worth noting as a potential future candidate — the stock is showing some structural promise — but not yet worth allocating capital or even significant monitoring attention. Review weekly rather than daily.
✗ Avoid (BRS <55)
Critical structural elements are missing. Even if surface signals look impressive (e.g., NH + HV + VCP all firing, like the CENTUM example), the absence of TT, Stage, and RS support means the probability structure is poor. Skip. The high surface-level signal count is noise when the underlying structural quality is absent. Finmagine Trader shows these stocks on the BRS tab for transparency — so you can see the full ranked universe — but the Avoid tag is a clear instruction: not this one.
RS — What ↑, ↓, and — Mean
The RS column shows three arrows (or dashes) for the three measurement periods: 12M, 6M, and 3M. Each arrow tells you whether the stock’s price change over that period outperformed or underperformed Nifty 50’s price change over the same period.
How it works technically: the extension fetches Nifty 50’s historical price returns from Yahoo Finance. For each period, it computes a threshold (e.g., “Nifty rose 12% over the past 12 months → threshold = 1.12”) then runs two parallel ChartInk scans: one for stocks whose price is above that threshold versus 252 trading days ago, and one for stocks below it.
- ↑ = outperform: the stock’s price change over that period exceeds Nifty 50’s change
- ↓ = underperform: the stock’s price change is below Nifty 50’s change
- — = insufficient history: the stock has been listed less than the period being measured (<252 days for 12M, <126 for 6M, <63 for 3M). Not penalised in BRS.
Lazy loading: RS appears as “...” initially because it is computed in a separate batch after the main scan data renders, to keep the initial BRS tab load fast. BRS scores will show with placeholder RS values and update automatically as the data arrives. The RS load typically completes within a few seconds.
Longer timeframes are more reliable signals of sustained institutional preference. A stock can outperform Nifty over 3 months by accident — sector rotation, a news event, a short squeeze. Outperforming over 12 months requires sustained allocation by investors who have stayed committed through market ups and downs. The weighting reflects this reliability gradient.
Reading BRS Alongside Other Columns
BRS is most powerful when read in the context of the other BRS tab columns. The table below shows common TT / Stage / RS combinations and what each implies:
| TT | Stage | RS | Typical BRS | Interpretation |
|---|---|---|---|---|
| ✓ | S2 | ↑↑↑ | 80–98 | Highest quality setup — act on entry signals |
| ✓ | S2 | ↑↑↓ | 69–84 | Strong but 3M RS fading — watch for momentum loss |
| ✓ | S1 | ↑↑↑ | 60–73 | Early stage, outperforming — watchlist for base completion |
| ✓ | — | ↑↑↑ | 70–78 | Illiquid TT stock near highs — valid but higher risk (AETHER type) |
| — | S2 | ↑↑↑ | 45–60 | Strong momentum, weak structure — check why TT fails |
| — | S4 | ↓↓↓ | 0–17 | Avoid entirely |
The most important column combination to check: when TT fails (—) but the stock has high proximity (NH) and RS ↑↑↑, BRS will be in the 45–60 range. This is the “CENTUM trap” — the surface looks great (near highs, outperforming, maybe with a VCP) but the MA structure is broken. BRS correctly demotes it. Investigate why TT fails before considering this stock.
Limitations and Known Gaps
BRS is a powerful ranking tool, but understanding its limitations makes you a better user of the data.
- RS binary limitation: ↑ and ↓ cannot distinguish magnitude. A stock beating Nifty by 0.5% and one beating it by 45% both show ↑ for that period. BRS scoring is directional, not magnitude-based. This is a known gap in the current implementation.
- TT/S2 overlap is intentional: Both test the MA structure. The overlap rewards stocks confirmed by two independent frameworks simultaneously. This is a feature, not double-counting.
- Stage classification is approximate: ChartInk’s data is end-of-day. Stocks in transition zones (e.g., just crossed their SMA200 today) may classify differently on different days. The 15-minute cache means BRS reflects the state at the time of the last fetch, not necessarily the real-time price.
- BRS is a ranking tool, not a buy signal: A BRS of 98 tells you the structural setup is excellent — not that the stock will go up. Always wait for a specific entry trigger: price breaking a well-defined pivot on above-average volume. BRS qualifies the stock for your watchlist; your entry criteria define the moment you act.
- BRS can change intraday: Stage, TT, proximity, and signal badges can all update as price moves during the day. The 15-minute cache refreshes BRS throughout the trading session. RS data is based on closing prices and does not change intraday.
Free Chrome Extension
Ready to scan your first momentum list?
Install Finmagine Trader and scan 2,000+ NSE stocks for Stage 2 uptrends, VCP breakouts, near 52-week highs, and volume surges — in one click.
Install from Chrome Web Store →No account required • Works on Chrome, Edge, Brave • NSE stocks only
Start Using the BRS Tab
The Breakout Readiness Score and BRS tab are live in Finmagine Trader v1.9.0. Install the extension and use the BRS tab to rank your NSE momentum candidates by composite structural quality — free, every morning.
Get Finmagine Trader →Related Article — Article 11 in the Finmagine Trader Series
The Trend Template is the foundation of the BRS score (25 of 100 points). Read the full TT article for the complete explanation of all 7 criteria, the SEPA Score, and how TT differs from Stage 2.
The Minervini Trend Template: 7 Structural Criteria That Define a Genuinely Strong NSE Stock →Continue the Finmagine Trader Series
Explore the other articles in this series to master every scan and tab:
Introducing Finmagine Trader The All Three Signal VCP Breakout Setups Stage 2 Deep Dive Tight Volatility Filter The Minervini Trend TemplateQuick Reference Q&A
The most common questions about the Breakout Readiness Score — answered concisely. Click any question to expand.