Following along? Install Finmagine Trader first
Free NSE momentum scanner — no account needed • Chrome, Edge, Brave
Multimedia Learning Hub
Master the IPO Breakout setup for Indian markets — zero overhead resistance mechanics, dual-fetch scanner architecture, all seven conditions decoded in plain English, lock-up expiry dynamics, analyst initiation timing, and 78 interactive flashcards
IPO Breakout: The Complete Framework for Recently Listed Indian Stocks
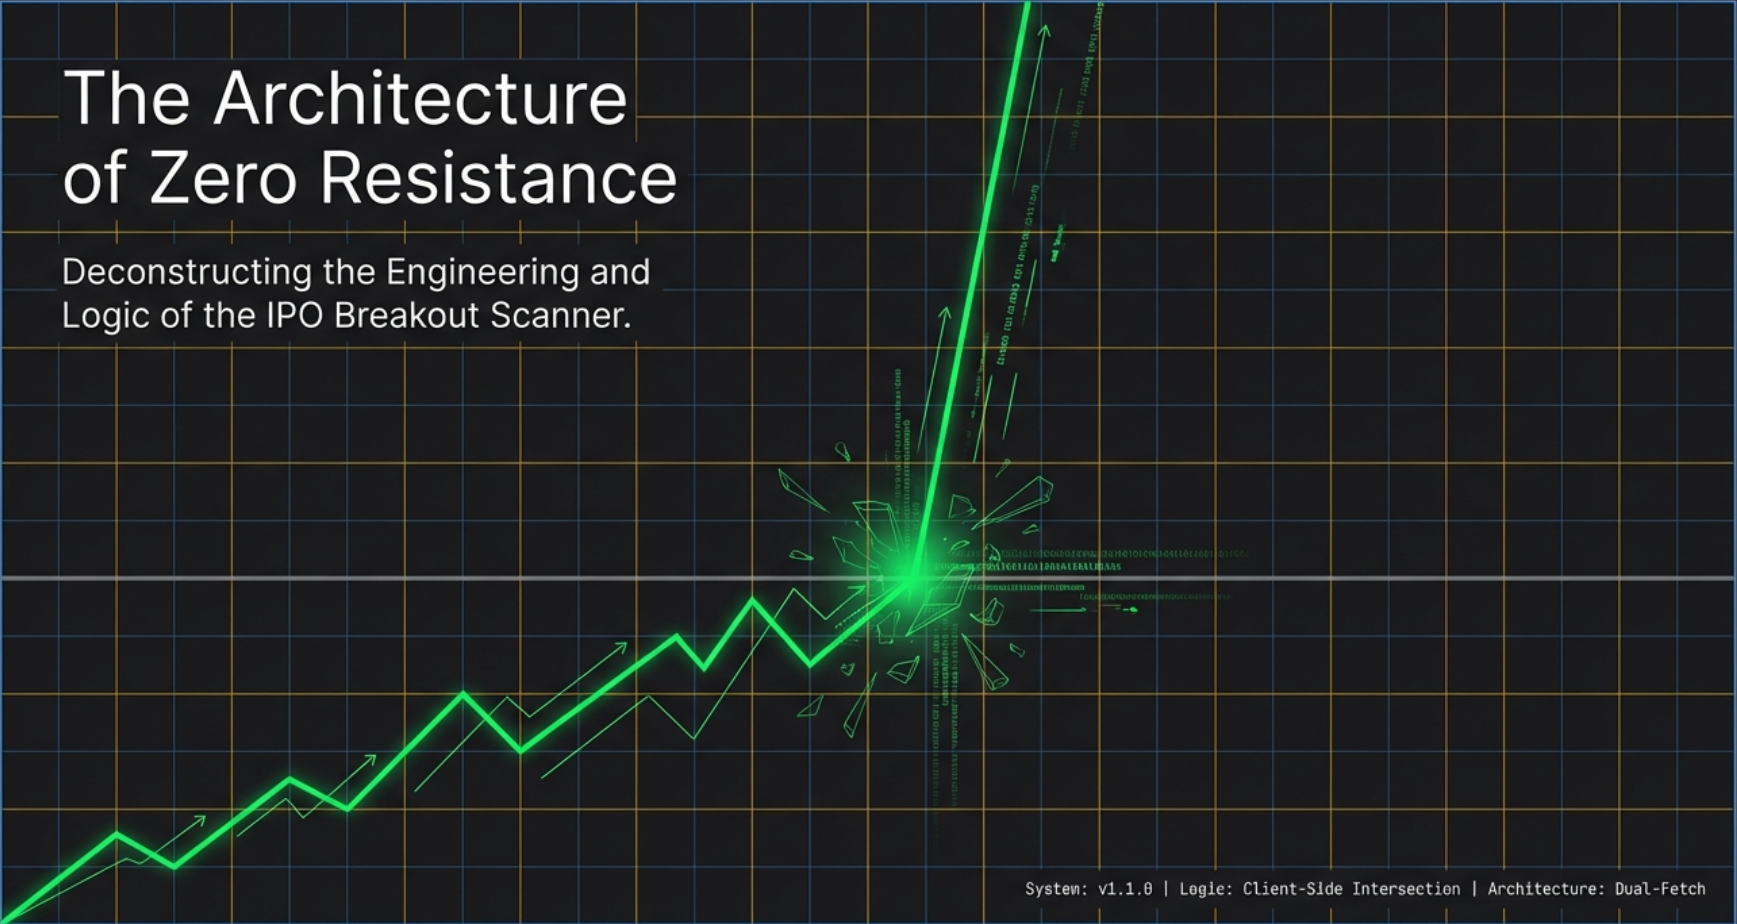
The Architecture of Zero Resistance — Dual-Fetch | Client-Side Intersection | v1.1.0
Every established stock carries a hidden burden: a crowd of prior buyers sitting on losses at every price level above the current price, waiting for a chance to "get out at breakeven." This overhead supply is a persistent ceiling on rallies. Now consider a stock listed fewer than ten months ago that approaches its all-time high for the very first time. Above that level, there are no prior buyers at all — no bagholders, no trapped sellers, no break-even sellers lined up to unload. The path above is completely clear. This is the zero overhead resistance setup, and Finmagine Trader's IPO Breakout tab identifies every candidate where a recently listed stock is approaching that unobstructed territory on above-average volume.
- No prior buyers above listing high
- Zero overhead resistance
- Pure price discovery territory
- Structurally unobstructed path up
- No SMA-200 (recently listed)
- Within 2% of 52-week high
- Volume > 20-day average
- Volume > 50,000 shares
- Price ≥ ₹20
- Market cap > ₹200 Cr
- Sorted by % change
- Lock-up expiry dynamics
- Analyst initiation pipeline
- Low free float supply crunch
- Index inclusion inflows
The IPO Breakout Scanner — Deep Dive Video
A deep dive into the architecture of the IPO Breakout Scanner: why overhead supply is invisible gravity on every established stock — how the “zero baggage” setup works — the SMA-200 absence hack for identifying recently listed stocks — why a single query fails and how the dual-fetch architecture solves it — all seven conditions decoded — and why zero results is the correct answer on most days.
Audio Deep Dive: The IPO Breakout Scanner — Hacking the Zero-Baggage Setup
This deep dive covers: why overhead supply acts as gravity on every established stock — how a recently listed stock approaches blue sky territory for the first time — the SMA-200 absence proxy — the dual-fetch architecture and why a single query fails — all seven conditions decoded in excruciating detail — lock-up expiry dynamics, analyst initiation timing, float mechanics, and index inclusion pipeline — green flags, red flags, and the complete execution playbook.
The IPO Breakout Scanner — Hacking the Zero-Baggage Setup — Audio Deep Dive
Approx. 20 minutes — covers the full scanner architecture and trading framework
Test Your Knowledge — IPO Breakout Analysis — 78 Flashcards
Click any card to reveal the answer. Search by topic to focus on a specific area. All 78 flashcards cover every key concept — from overhead supply and zero resistance mechanics, the dual-fetch architecture, each scanner condition, the four structural tailwinds, green and red flag criteria, risk management, and the execution playbook.
The Invisible Weight Every Established Stock Carries
To understand why the IPO Breakout setup is structurally different from every other momentum play, you need to understand a concept that most retail traders have never consciously articulated: overhead supply.
Imagine a stock that was trading at ₹500 two years ago. It fell to ₹200 over the following year. It has since recovered to ₹350 and is approaching ₹400. At every price level between ₹350 and ₹500, there is a crowd of investors who bought on the way up, held through the fall, and are now waiting — sometimes desperately — for the stock to return to their purchase price so they can sell and "get out flat." These are the bag-holders. Each of them becomes a seller the moment the stock hits their cost price. This is overhead supply: a persistent, invisible ceiling formed by thousands of prior buyers sitting on losses at every price above the current level.
"Every price on the way down was someone's entry point. Every one of those buyers becomes a potential seller on the way back up. This is the hidden friction that slows established-stock rallies — the overhead supply army marching out of their positions one by one as the stock recovers."
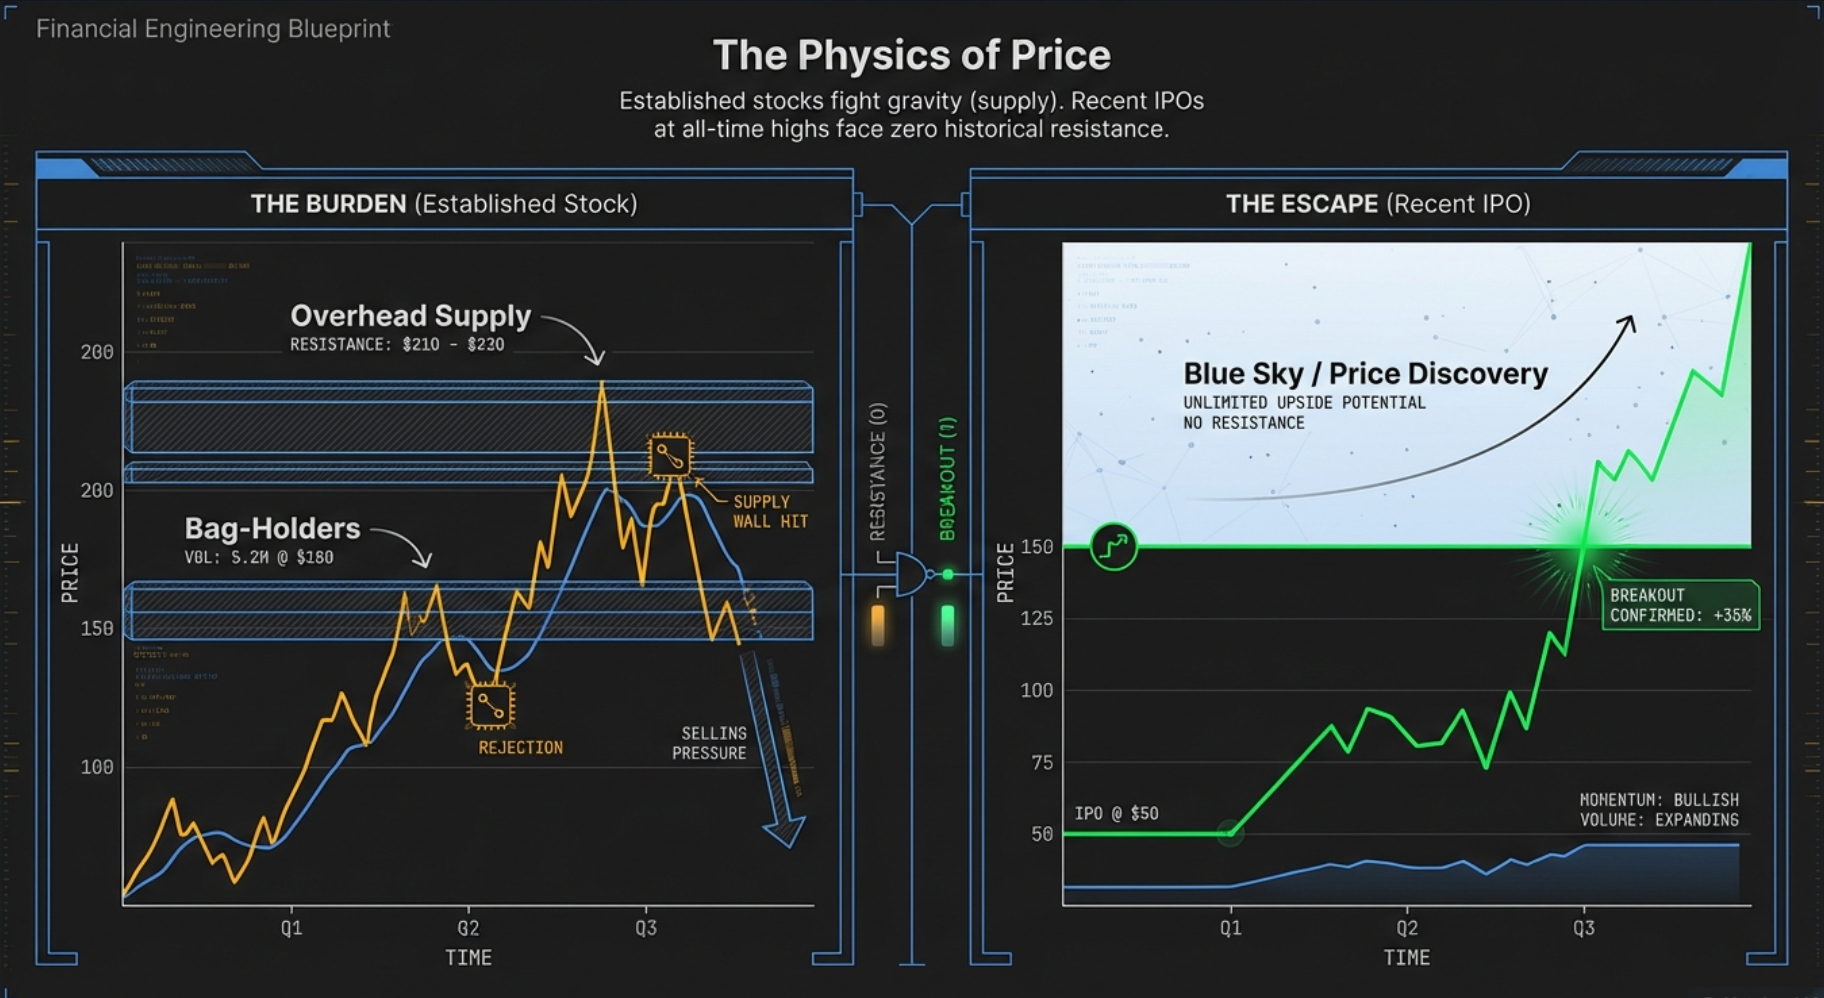
Overhead supply does not need to be massive to slow a rally. Even a small percentage of a stock's float represented by break-even sellers at a particular price is enough to create meaningful resistance. The stock climbs, encounters a batch of break-even sellers, stalls, digests, climbs again, encounters the next batch. Every level above the current price has its own supply waiting. This is why rallies in fallen stocks are so often laborious, slow, and prone to failure — the stock is climbing a ladder while dragging a heavy weight of prior sellers behind it.
At every price level above current price where the stock has previously traded, there are investors who bought at that level and are sitting on unrealised losses. When the stock recovers to their entry price, they sell to break even — creating a ceiling at that level. The more extensively a stock has traded at higher prices, the larger the army of break-even sellers waiting above. This friction slows rallies, creates resistance at predictable levels, and explains why the same resistance zones appear repeatedly on charts. The higher a stock has previously been relative to its current level, the heavier this invisible weight becomes.
Now consider the structural opposite: a stock listed on NSE fewer than ten months ago, approaching its 52-week high for the first time. Its 52-week high is either the spike high on listing day or a subsequent momentum high — in either case, it represents the upper boundary of the stock's entire known price history. Above that level, there has never been a traded price. Not a single buyer exists above it. The overhead supply army does not merely appear smaller — it is zero. Completely absent. The path above the listing high is an empty road. No congestion, no break-even sellers, no invisible ceiling. Pure price discovery.
This is the zero overhead resistance thesis: when a recently listed stock clears its all-time high for the first time, it enters territory where the normal friction of overhead supply simply does not apply. The move above can be fast, clean, and uninterrupted — not because the stock is necessarily exceptional, but because the structural impediment that slows every established stock's rally simply does not exist yet.
The IPO Breakout Tab — What It Does and When It Shows Zero
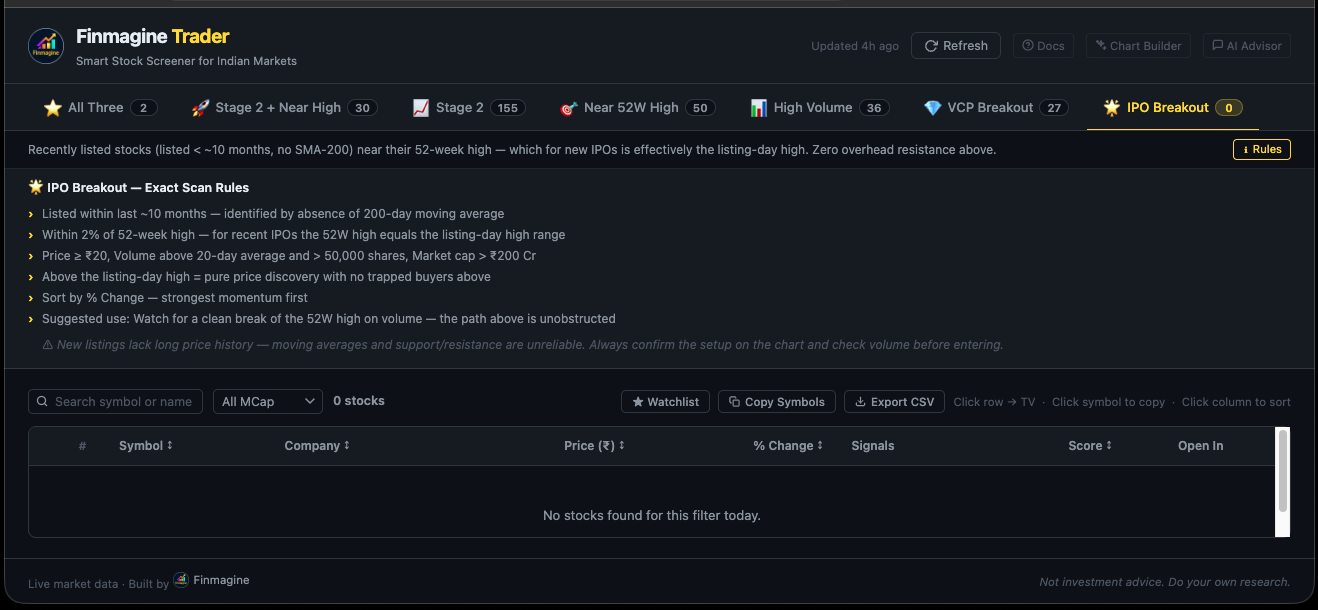
The IPO Breakout tab in Finmagine Trader scans for recently listed NSE stocks that are within 2% of their 52-week high on above-average volume, sorted by percentage change descending. It is the seventh tab in the dashboard, marked with a star to signal its distinctive character among the other momentum tabs.
The tab solves a specific problem: identifying the moment a recently listed stock is approaching its all-time high on the kind of volume that signals genuine institutional participation rather than a thin, low-conviction drift. On most days, this constellation of conditions — recently listed, near the all-time high, above-average volume — is genuinely rare. The typical result is a short list of five to fifteen candidates. On many days, the result is zero.
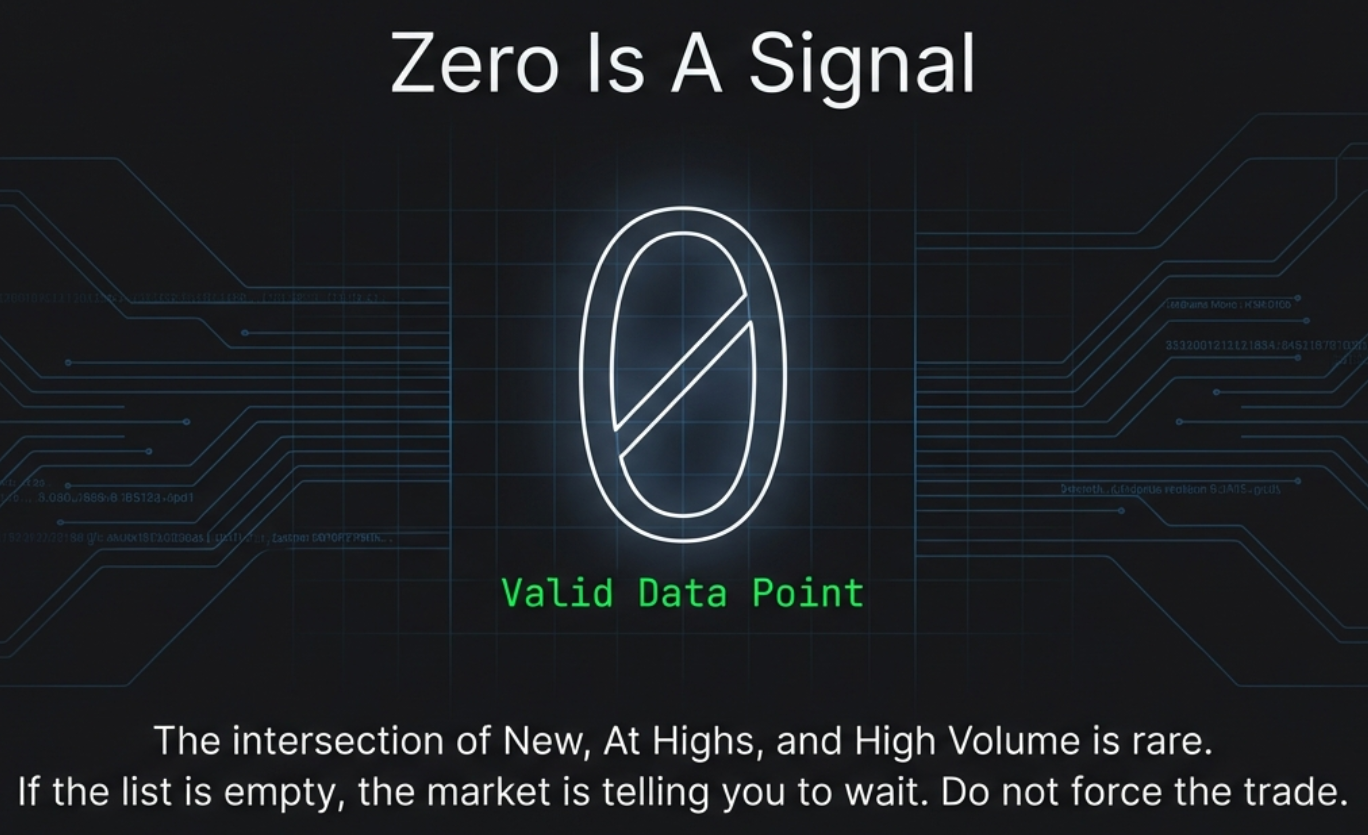
When the IPO Breakout tab shows zero stocks, this is the scanner working exactly as designed. For a stock to appear, three things must align simultaneously: it must be recently listed (fewer than approximately ten months of trading history), it must be within 2% of its 52-week high, and it must be doing so on volume that exceeds its 20-day average. On most days, no stock satisfies all three conditions at once. Zero results is the honest answer: there is no IPO breakout setup worth examining today. Forcing a setup when none exists is how traders get into bad trades. The rarity of the signal is itself information — when stocks do appear, they deserve serious attention precisely because the conditions are hard to meet.
The contrast with other tabs is instructive. The Stage 2 tab regularly shows 100 to 200 stocks because its conditions — an established uptrend above both major moving averages — are met by many stocks simultaneously in a rising market. The Near 52W High tab shows dozens of stocks because approaching a 52-week high is common during market strength. The IPO Breakout tab's requirement that the stock be both recently listed AND at its all-time high AND on elevated volume creates a genuine bottleneck. Most recently listed stocks spend the early months of their life well below their listing-day high, consolidating or correcting as IPO-day enthusiasm fades. Appearing in this tab means a stock has not merely survived the post-IPO period — it has genuinely strengthened to approach its historical upper boundary.
The IPO Breakout tab is not a daily research tool in the way Stage 2 or VCP tabs are. It is a precision alert system. Check it daily as part of your routine, note the count, and when stocks appear, treat them as high-priority candidates for deeper research. The setup's rarity is a feature: it concentrates your attention on a small number of genuinely unusual situations rather than diluting it across a large field of ordinary opportunities.
How the Scanner Identifies "Recently Listed" — The SMA-200 Proxy
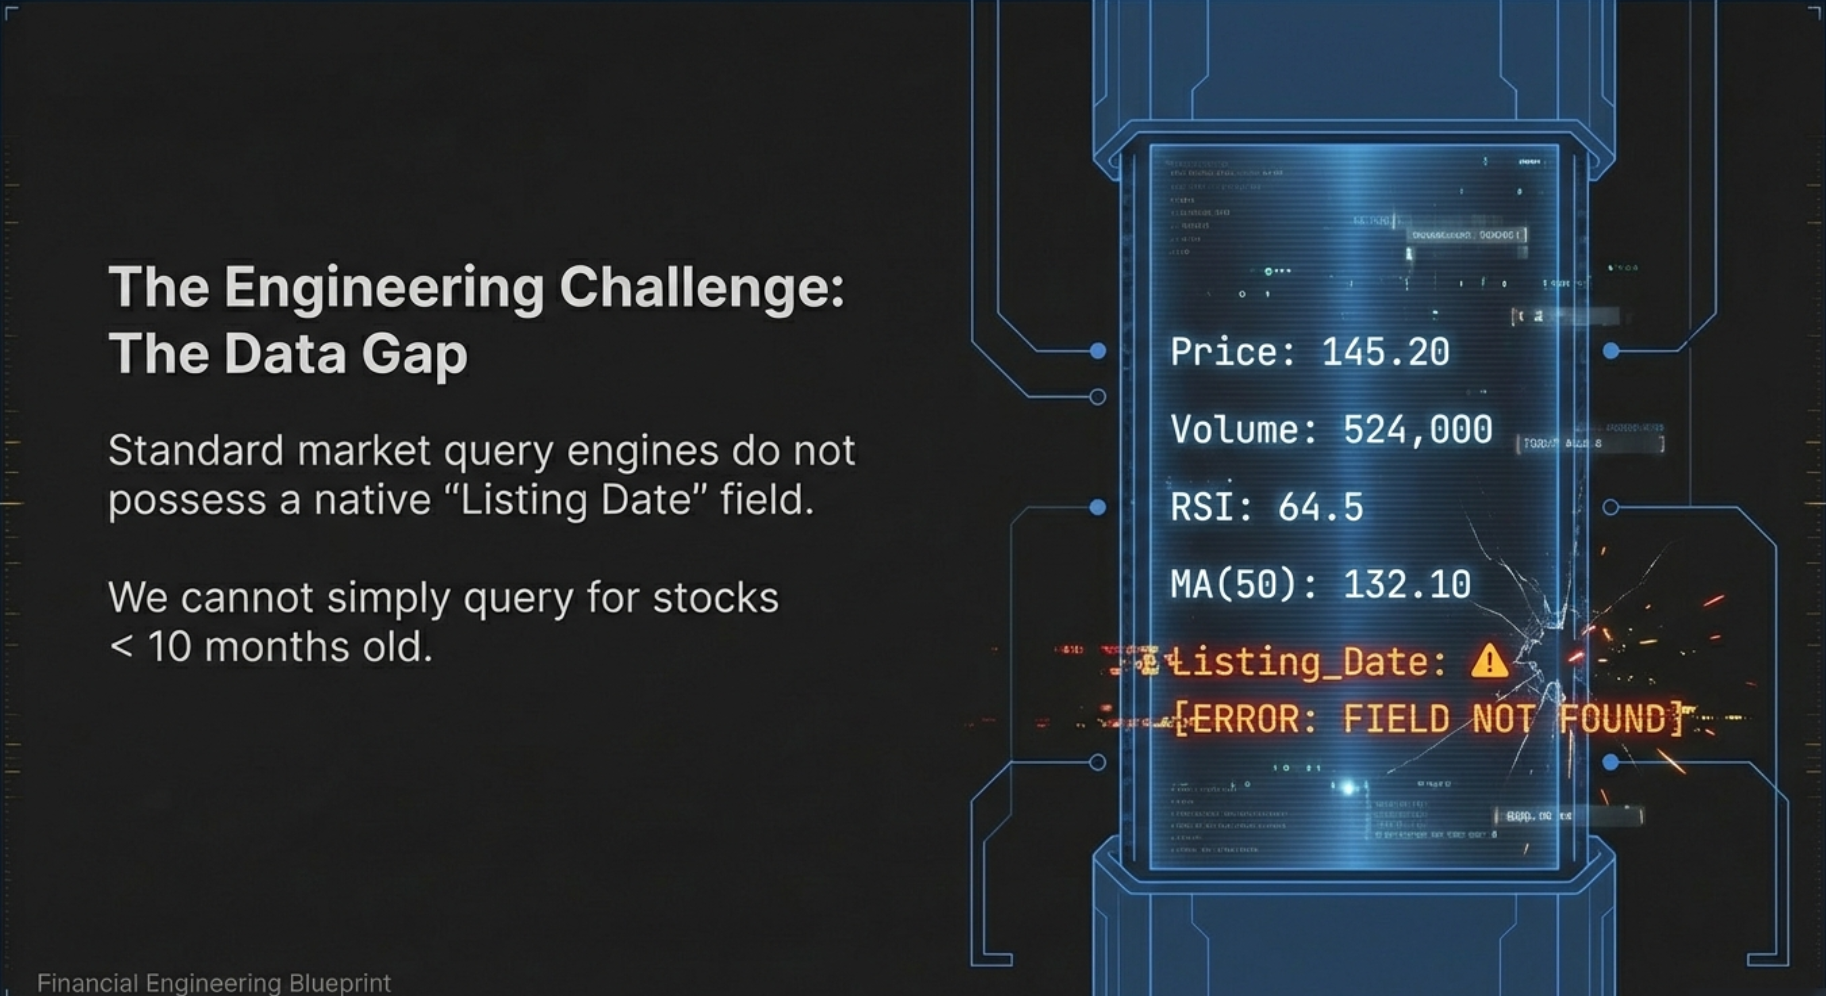
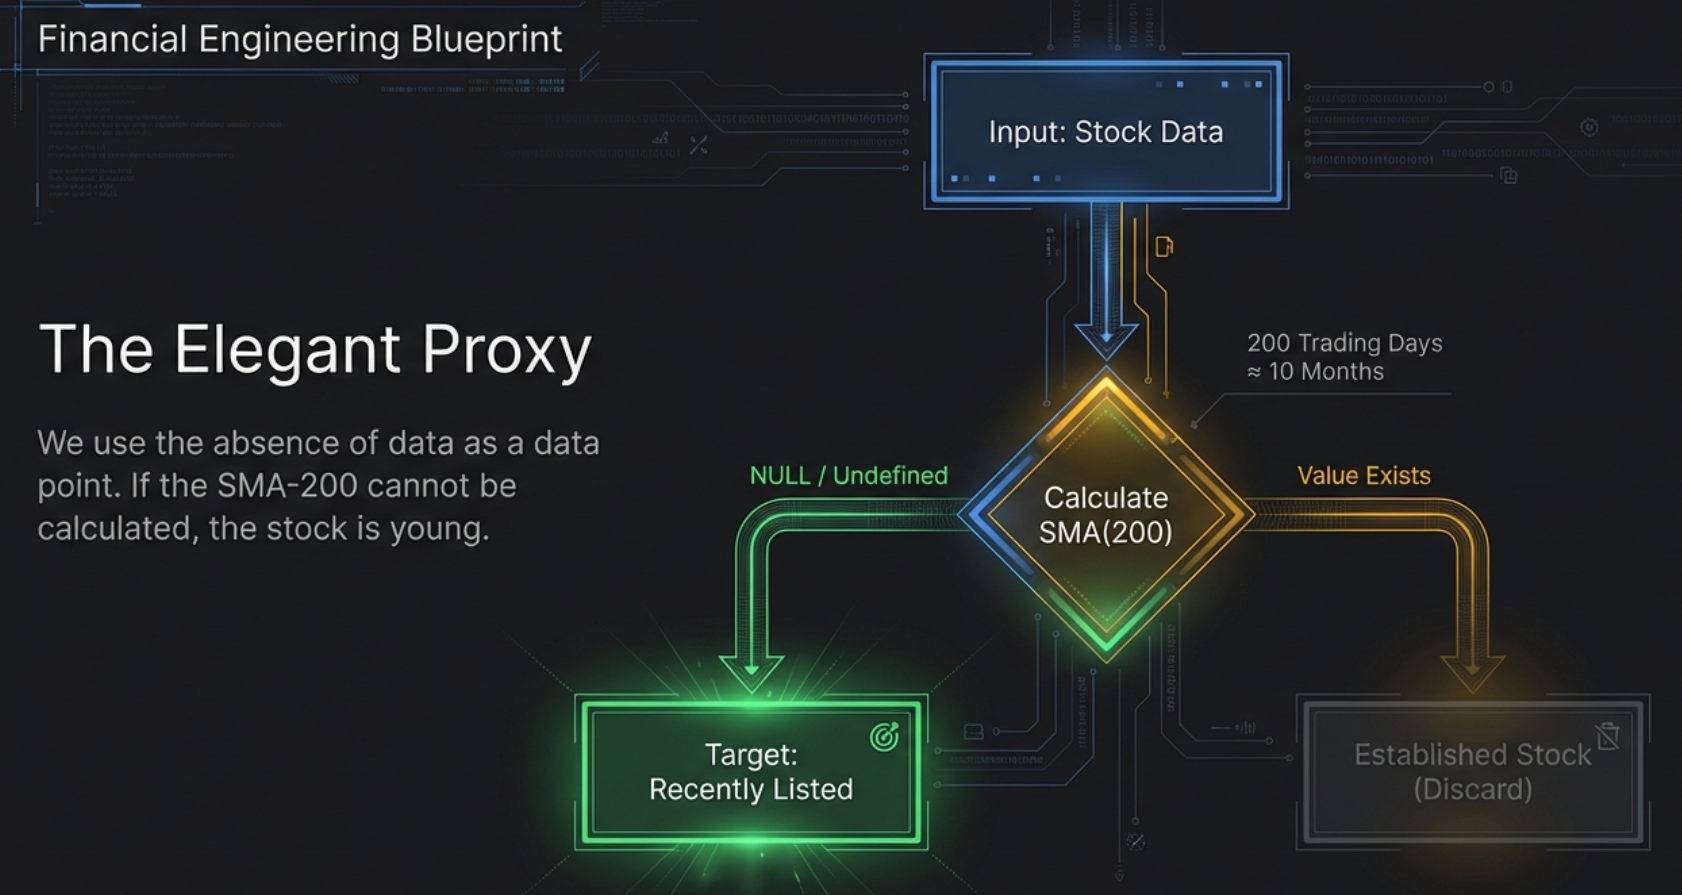
Identifying whether a stock is recently listed would ideally involve checking its actual IPO date against today's date. But listing date fields are not available in standard market data screener frameworks, which work with price, volume, and derived indicators rather than corporate event calendars. The scanner solves this elegantly using a reliable proxy: the absence of the 200-day simple moving average.
The 200-day simple moving average requires exactly 200 daily closing prices to compute. At a typical trading calendar of approximately 20 trading days per month, 200 trading days corresponds to roughly ten months of trading history. A stock that has no SMA-200 value — where the field is blank or unavailable — has not yet accumulated 200 trading days of history. In practical terms, this means it has been listed for fewer than approximately ten months.
When a stock has no computable 200-day moving average, it has fewer than 200 trading days of price history — which translates to fewer than approximately ten months since listing. This is not a perfect proxy (a very small number of stocks could theoretically have data gaps that prevent computation), but it is highly reliable in practice. The SMA-200 absence condition allows the scanner to identify recently listed stocks without requiring access to listing date databases that are not part of standard technical screener data. It is elegant, practical, and robust.
This proxy has an important practical implication: it captures the window of time in which the IPO's entire price history — including any listing-day spike — falls within the 52-week window. For a stock with ten or fewer months of trading history, the 52-week high is necessarily the highest price the stock has ever traded at. There is no prior history. The 52-week high and the all-time high are one and the same.
As the stock ages past the ten-month mark and accumulates enough data to compute a 200-day SMA, it graduates out of the IPO Breakout tab's universe. At that point, it becomes eligible for other tabs — potentially the Stage 2 tab if it has established a confirmed uptrend, or the Near 52W High tab if it remains near its highs. The IPO Breakout tab captures a specific, time-bounded window in a stock's post-listing life when the zero overhead resistance thesis is in its purest form.
The SMA-200 absence does not distinguish between a stock listed one month ago and one listed nine months ago. Both appear in the tab's universe. A stock listed one month ago has only had a single month to form a base and may still be in the volatile post-listing digestion phase where the initial IPO excitement is unwinding. A stock listed six to eight months ago has had time to stabilise, build a constructive base, and develop a cleaner technical structure. When stocks appear in the IPO Breakout tab, always check the chart from listing day to understand where in the post-listing lifecycle you are.
The Engineering Challenge — How the Scanner Was Actually Built
Understanding the zero overhead resistance thesis is the easy part. Actually building a tool to scan for these stocks every day required solving two non-trivial engineering problems. How they were overcome is not just a technical footnote — it explains precisely why the scanner works the way it does, and why the results you see are genuinely precise rather than a rough approximation.
Problem 1 — There Is No “Listing Date” Field
To find recently listed stocks, the obvious approach would be to filter by listing date: “show me all stocks listed in the last 10 months.” Standard market data screener frameworks do not have this field. They work with price data, volume data, and derived indicators — not corporate event calendars. “Listed fewer than 200 days ago” is simply not a query you can run directly.
The solution is to scan for something that does not exist rather than something that does. Specifically: the 200-day simple moving average. If a stock's SMA(200) cannot be computed — because the field is blank or unavailable — there is only one possible reason: it has not been trading for 200 days. The absence of a data point becomes the data point itself.
"Instead of scanning for something that exists… scan for something that doesn’t. If a stock doesn’t have a 200-day moving average, it physically cannot have traded for 200 days. The absence becomes the signal."
Problem 2 — “Young” and “Near High on Volume” Cannot Be Combined in One Query
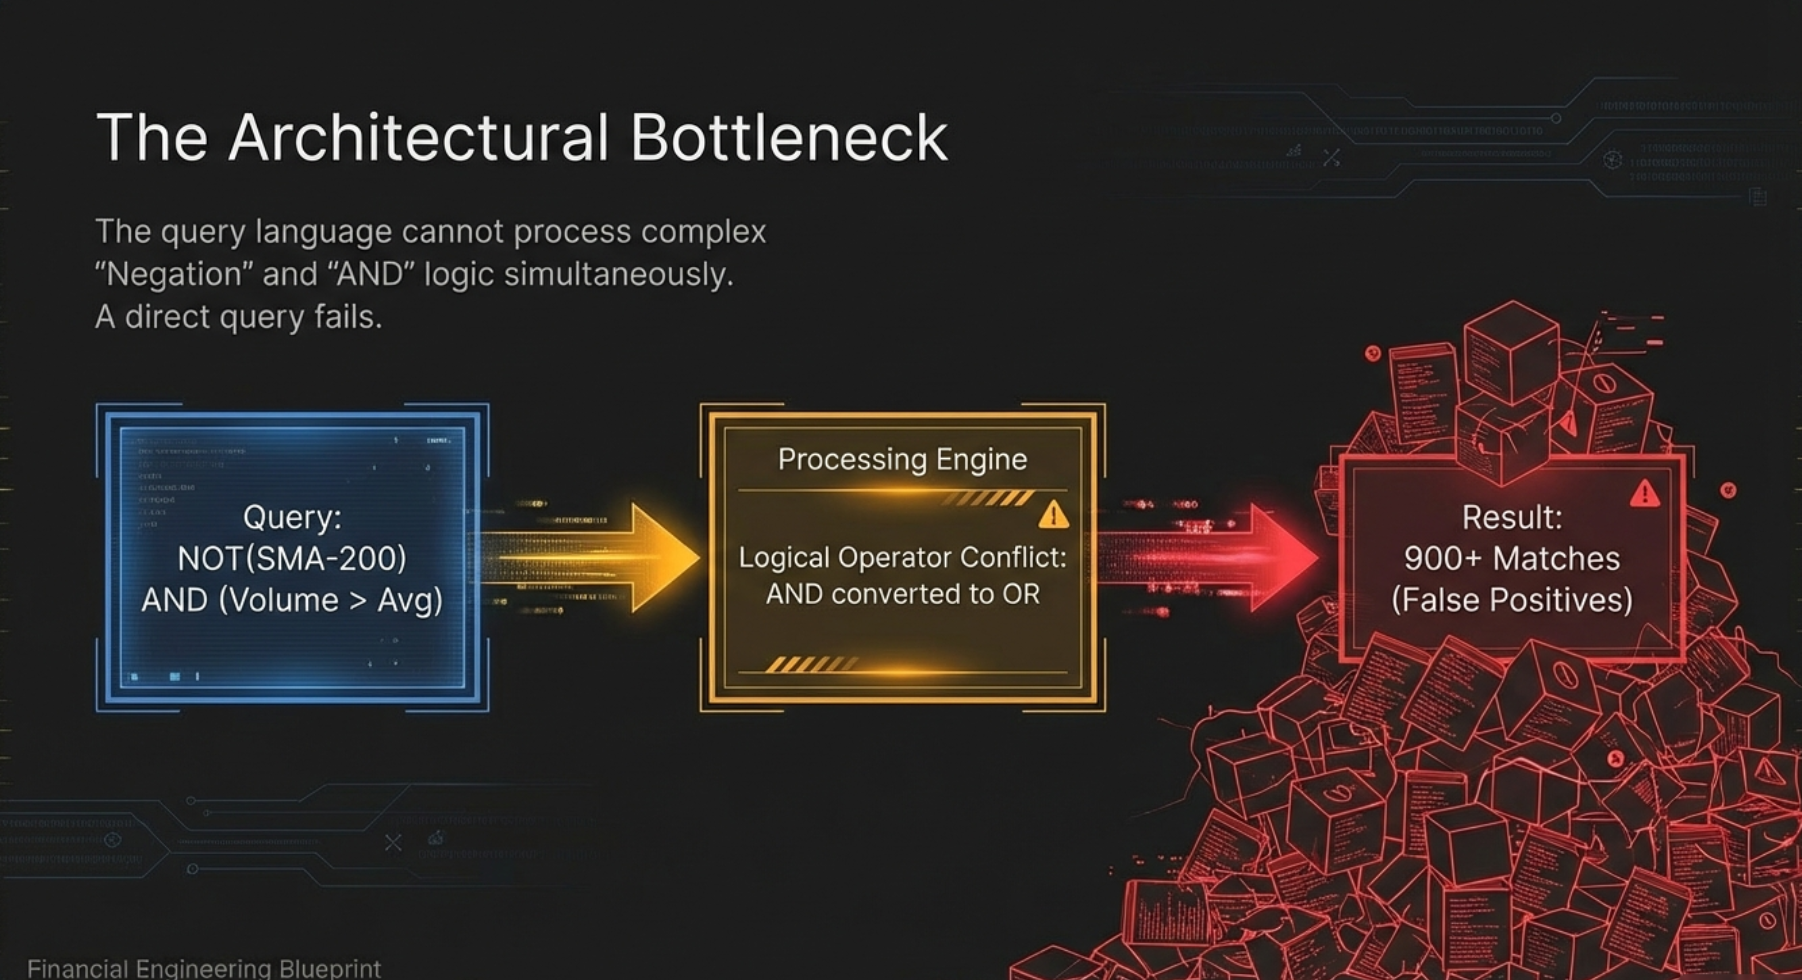
Even with the SMA-200 absence proxy, a second obstacle emerged. The screener engine has a known limitation: it cannot correctly combine a negation condition (“stock does NOT have SMA-200”) with multiple positive AND conditions (“and price is near 52-week high, and volume is above average”) in a single query. When you attempt this combination, the logic silently breaks — the AND operators are evaluated as OR, returning hundreds of incorrect results. This was confirmed through direct testing: the naive single-query approach returned over 900 stocks instead of the expected 10–20. Completely wrong.
The Solution — Dual-Fetch Architecture

If you cannot ask both questions simultaneously, ask them separately and find the overlap yourself. The scanner runs two completely independent queries in parallel, then intersects the results in the browser. No server-side logic required.

Fetch 1 — The Young Stocks List: A wide-net query that returns every stock without a 200-day SMA — all recently listed stocks, including penny stocks, micro-caps, and everything in between. This is the allow-list of stock identifiers for recently listed companies. It typically yields 150–250 names depending on the volume of recent IPO activity.
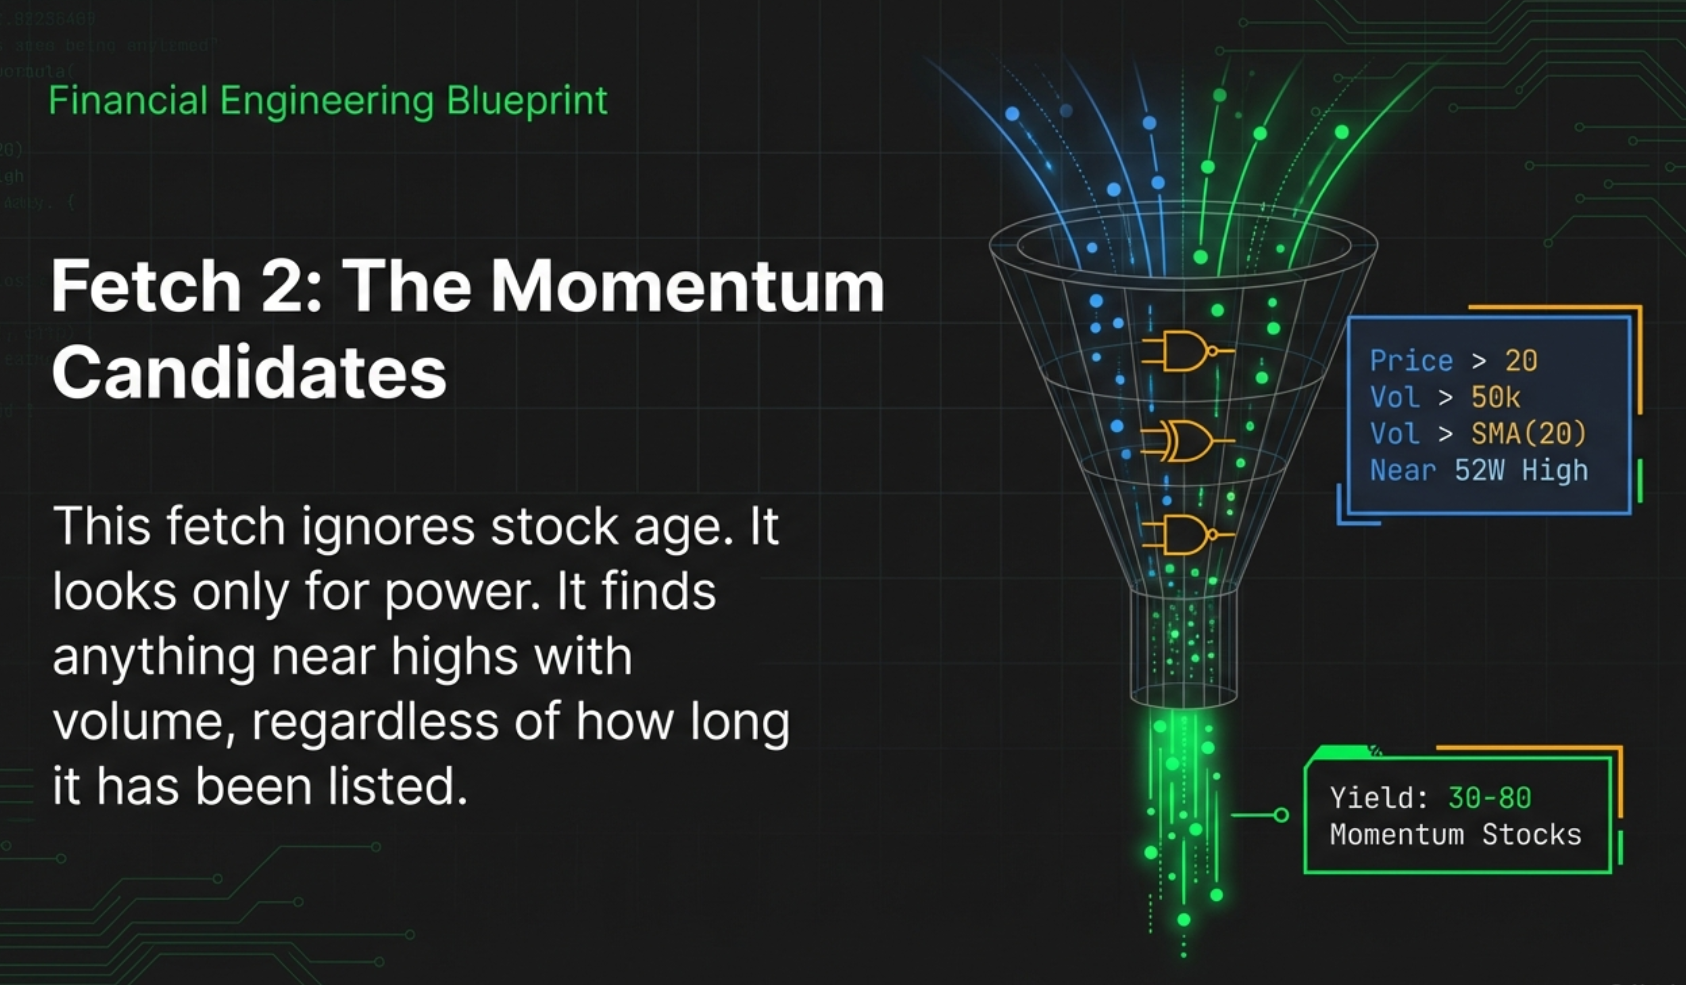
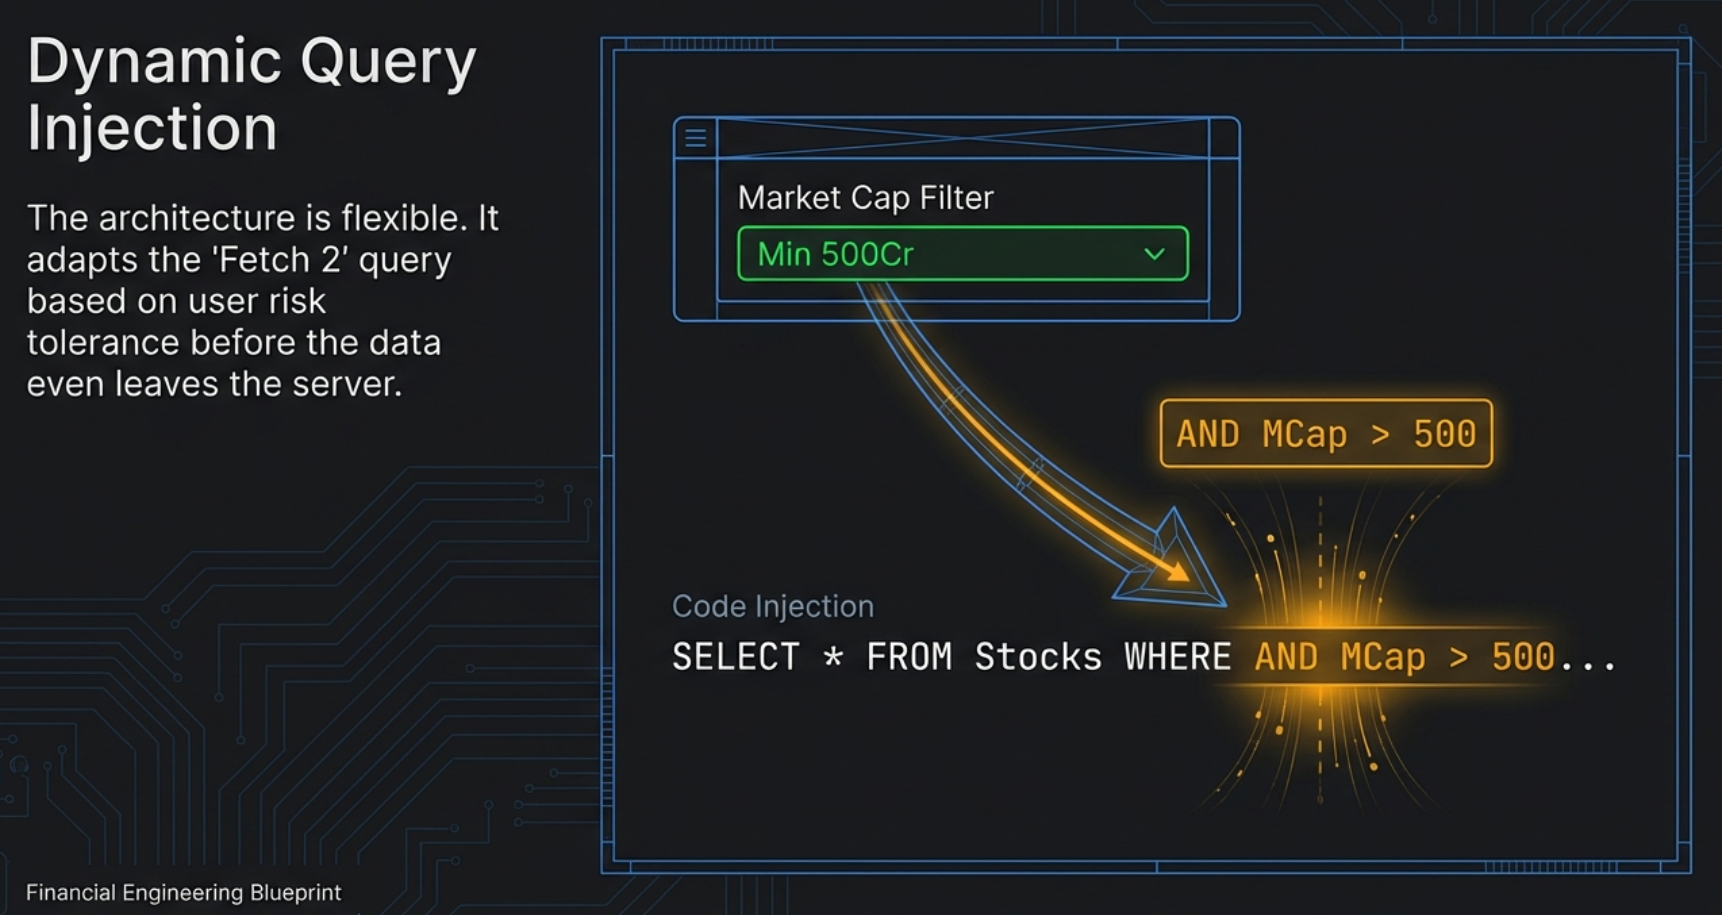
Fetch 2 — The Strong Stocks List: A completely separate query that ignores listing age entirely. It asks only: is this stock near its 52-week high on above-average volume, with a price above ₹20 and a market cap above ₹200 Crore? This typically yields 30–80 stocks from across the entire market — a mix of recently listed and long-established companies.
The Intersection — The IPO Breakout List: The two lists are compared in the browser. Any stock whose identifier appears on both lists is a recently listed stock that is simultaneously near its all-time high on above-average volume. That is the IPO Breakout result — sometimes 0 names, sometimes 3, rarely more than 10.
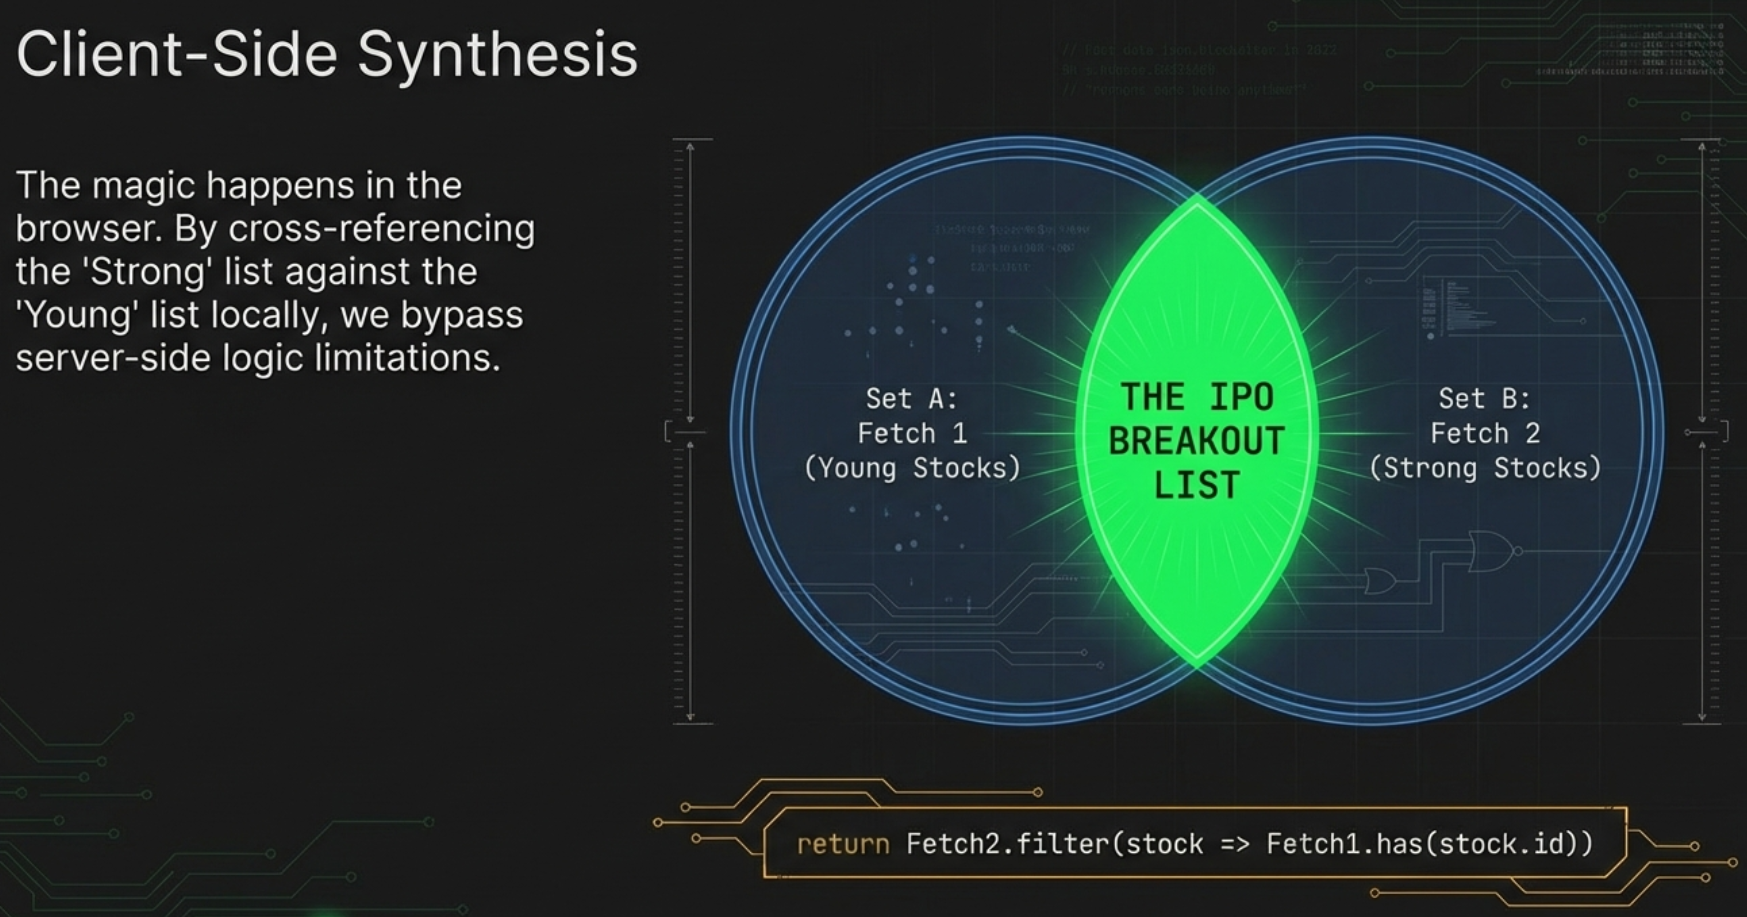
return Fetch2.filter(stock => Fetch1.has(stock.id))The two fetches run simultaneously — not one after the other. Total data retrieval time is determined by whichever query takes slightly longer, not the sum of both. Results appear in the dashboard in the same time as any single-fetch tab. Speed is fully preserved despite the two-step architecture.
This dual-fetch approach is also why the scanner shows zero results far more often than other tabs. You are finding the intersection of two independent lists. Most of the time, no stock that is recently listed also happens to be near its all-time high on above-average volume on the same day. Zero is the correct and honest answer when that intersection is empty — not a glitch, not a failure.
Why the 52-Week High Is the Listing-Day High for Recent IPOs
For an established stock, the 52-week high reflects the highest closing price in the prior twelve calendar months. This might be a recent high, or it might be a high set many months ago from which the stock has since retreated. In either case, the 52-week high may or may not coincide with the all-time high.
For a stock listed fewer than ten months ago, the situation is fundamentally different. The 52-week window encompasses the stock's entire trading history. Its 52-week high is, by definition, its highest ever closing price — its all-time high. In most cases, this is either the listing day's intraday or closing spike (common when IPO enthusiasm drives price sharply upward on day one before fading) or a subsequent momentum high set during the stock's strongest post-listing period.
| Scenario | What the 52W High Represents | What Approaching It Means |
|---|---|---|
| IPO listing-day spike, then correction | The excitement high from listing day — the first and highest price the stock traded | Approaching the level where all early IPO buyers from day one are near breakeven. Above it, zero prior buyers exist. |
| IPO opened quietly, then rallied over months | The peak of the subsequent momentum rally — a level set organically as demand built | Approaching the upper boundary of all post-listing price action. Above it, no one has ever traded. |
| Both cases combined | In either case: the stock's all-time high | Approaching territory where overhead supply is zero. The scanner's 2% proximity captures exactly this moment. |
The critical insight is that the scanner's "within 2% of 52-week high" condition, applied to a recently listed stock, is functionally equivalent to "within 2% of the all-time high." This is not true for established stocks, where the 52-week high may be well below the all-time high. For recently listed stocks, these two conditions are synonymous. The scanner is therefore identifying the exact moment a recently listed stock is approaching price discovery territory — the boundary above which no seller exists, no prior buyer is trapped, and the only force determining price will be fresh demand versus fresh supply.
"Established stocks climb through layers of overhead resistance — one batch of break-even sellers at a time. A recently listed stock approaching its all-time high for the first time faces none of that. There is no queue of sellers waiting. The stock is standing at the edge of an empty field. The question is only whether there is enough demand to walk across it."
There is one nuance to understand when the 52-week high represents a listing-day spike. If a stock opened at ₹180 on listing day, spiked intraday to ₹240, and then settled back to close at ₹160, the 52-week high would be recorded at ₹240. Buyers who chased the stock to ₹240 on listing day are sitting on losses at every level between ₹160 and ₹240. These buyers represent a real — if small — overhead supply contingent. In such a case, the zero-baggage thesis is not entirely pure: there are some trapped buyers between the listing-day spike and the subsequent close. This is one reason why the "violent listing-day spike then crash" pattern is flagged as a red flag later in this article — it contaminates the otherwise clean zero-overhead-resistance thesis.
All 7 Scanner Conditions — Decoded in Plain English
The IPO Breakout scanner applies seven distinct conditions to every NSE stock. A stock must satisfy all of them to appear in the tab. Each condition encodes a specific dimension of the IPO breakout logic. Understanding what each condition checks and why it exists is the foundation for using the results intelligently.
Condition 1 — No 200-Day Moving Average (Recently Listed)
SMA(200) is absent — "Stock has not yet accumulated 200 trading days of history"
In plain English: the stock's 200-day simple moving average does not exist because the stock has not been trading long enough to compute it. This is the primary filter that restricts the universe to recently listed stocks — those with approximately ten or fewer months of trading history since IPO.
This is also the condition that makes the IPO Breakout tab mutually exclusive with the Stage 2 tab. Stage 2 requires price to be above SMA(200), which in turn requires SMA(200) to exist. A recently listed stock without SMA(200) cannot meet Stage 2 criteria by definition — which is why the IPO Breakout tab exists as a separate, dedicated screen rather than being a subset of Stage 2.
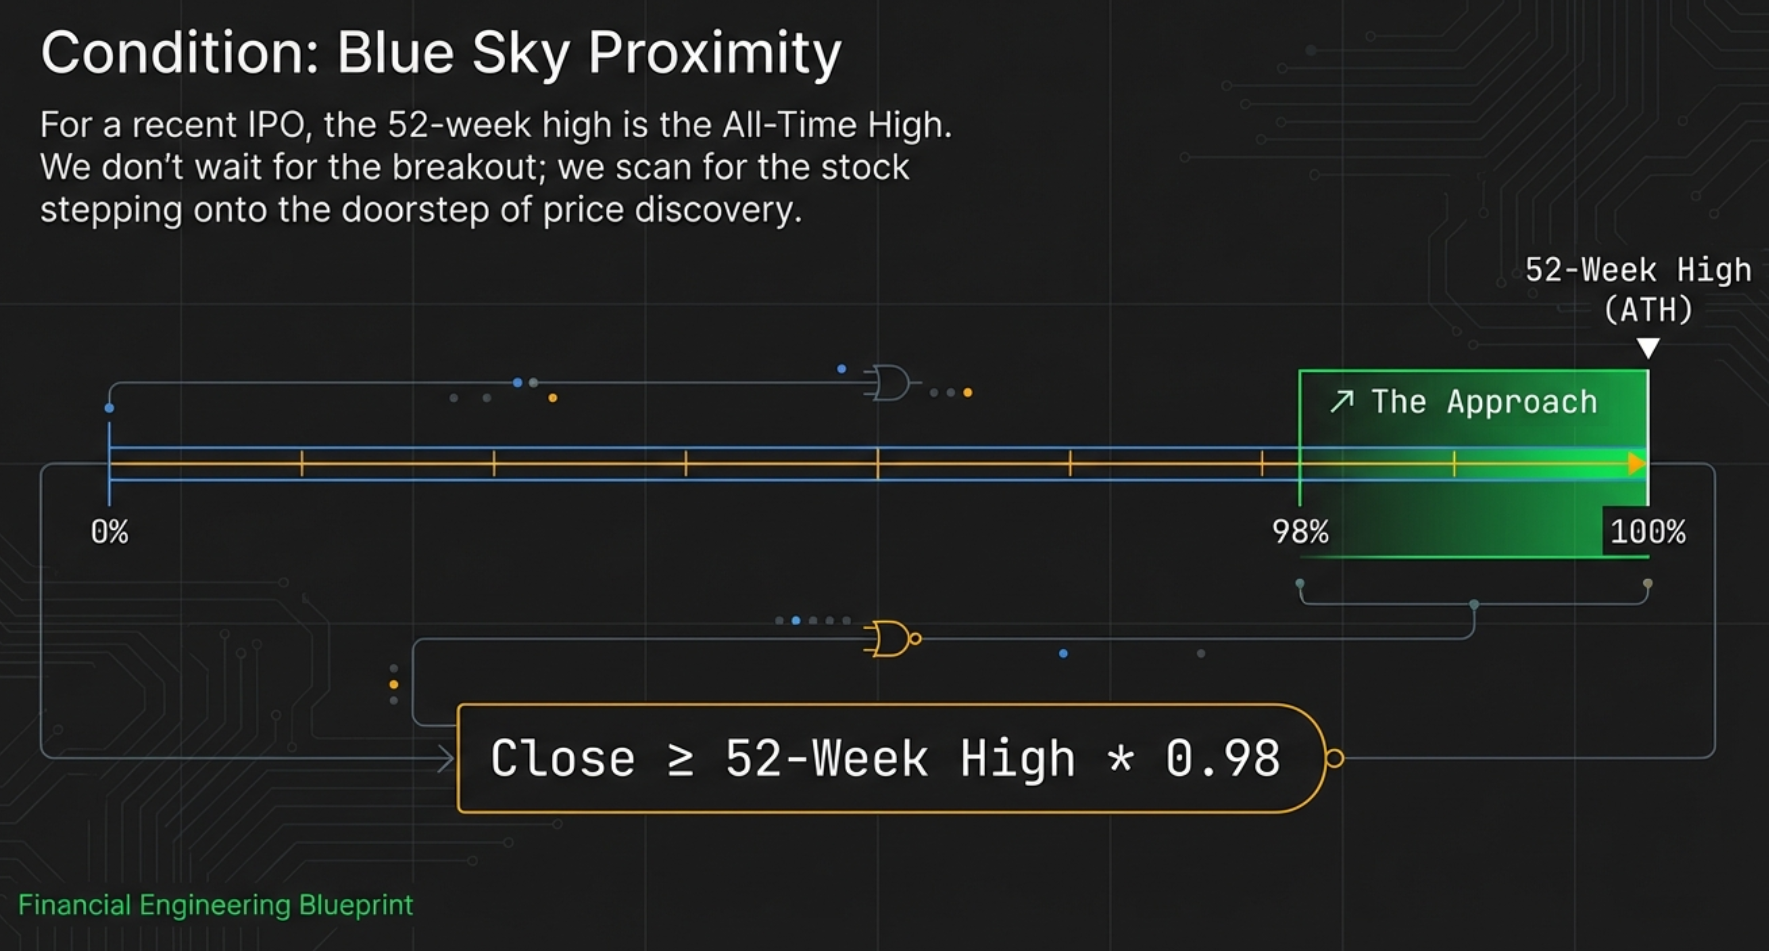
Condition 2 — Within 2% of 52-Week High
Close ≥ 52W High × 0.98 — "Within striking distance of the all-time high"
In plain English: the stock's current price must be at least 98% of its 52-week high. The 2% proximity threshold is calibrated to capture stocks that are genuinely at the doorstep of their all-time high — not merely "somewhere near the top." For a recently listed stock, this means the price is within 2% of entering completely uncharted territory.
The 2% buffer also serves as a practical trading buffer. If the stock is trading at exactly 98% of its all-time high, a trader can place a buy-stop order at the all-time high level with a modest buffer and expect to be triggered within a relatively tight price range. This makes the setup actionable rather than merely theoretical.
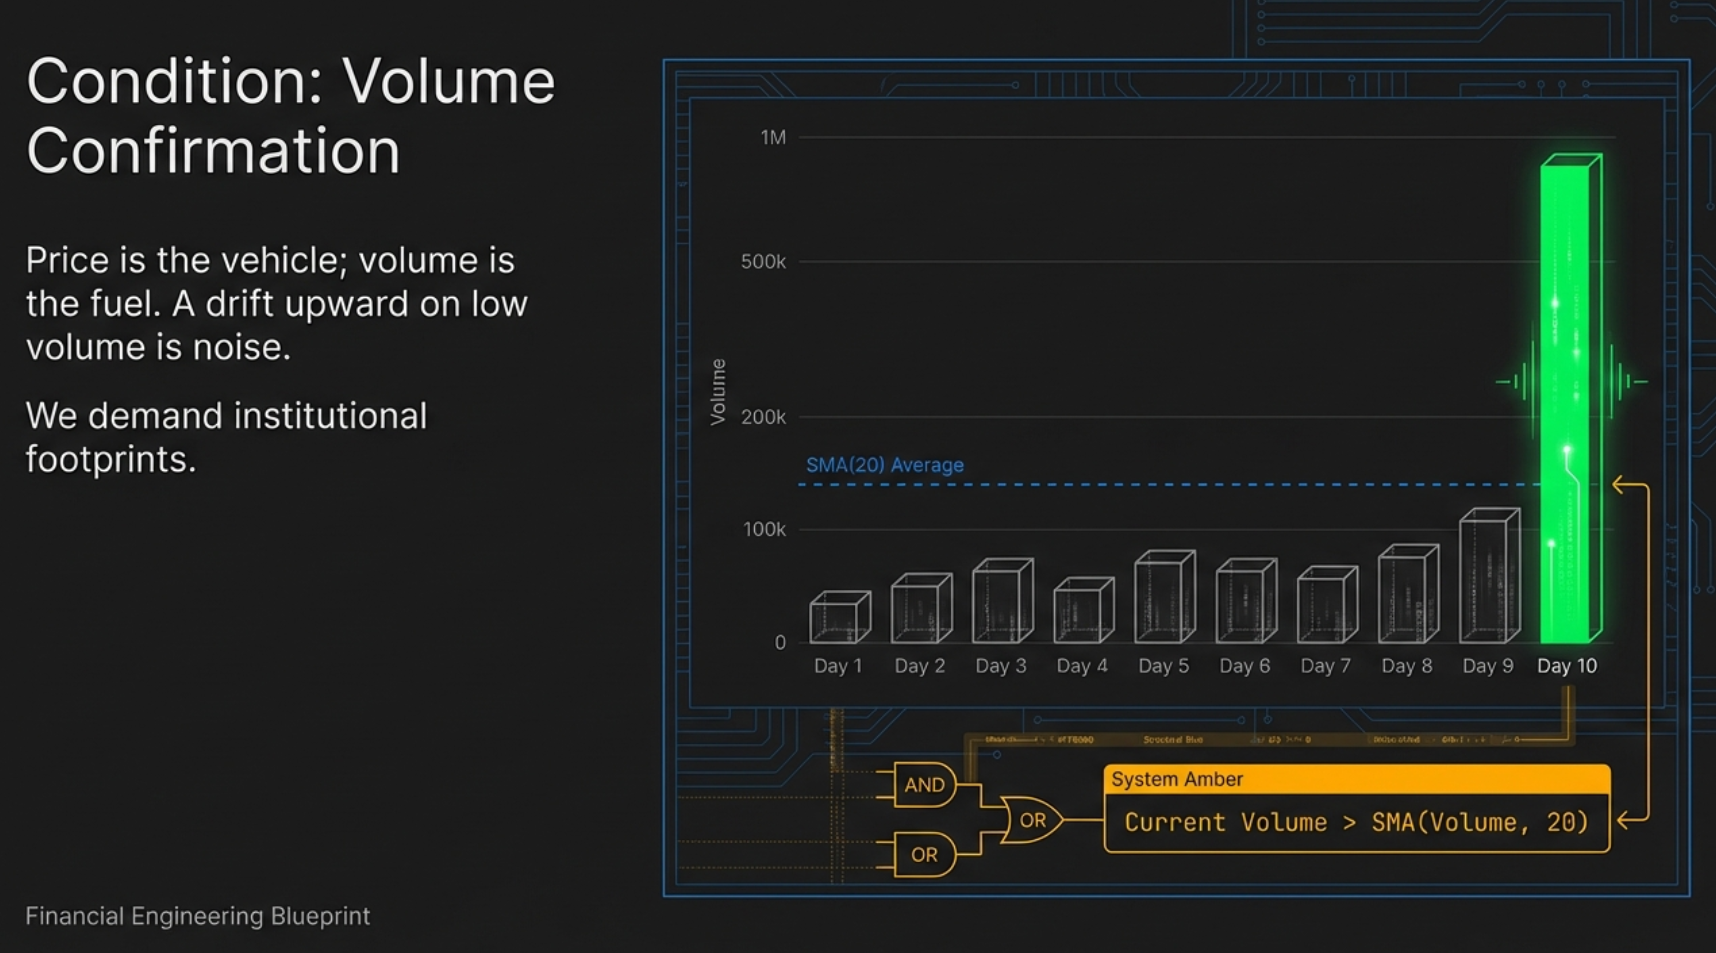
Condition 3 — Volume Above 20-Day Average
Today's volume > SMA(Volume, 20) — "Institutional participation, not a thin drift"
In plain English: the stock's current-day volume must be higher than its own 20-day average volume. This is the most important signal condition in the scanner. A recently listed stock drifting near its all-time high on anaemic volume is not a setup — it is a low-conviction accident. The price may be near the high simply because there are very few sellers, not because there is genuine buying demand accumulating. Above-average volume on the approach to the all-time high is the signal that demand is actively building — that institutional participants are taking positions ahead of what they expect will be a breakout.
The 20-day average is chosen because it captures the stock's recent baseline trading activity. For a recently listed stock, this baseline may be relatively low if the IPO excitement has faded and trading volume has normalised. Above-average volume in this context means genuine new interest, not simply the stock returning to its listing-week excitement levels.
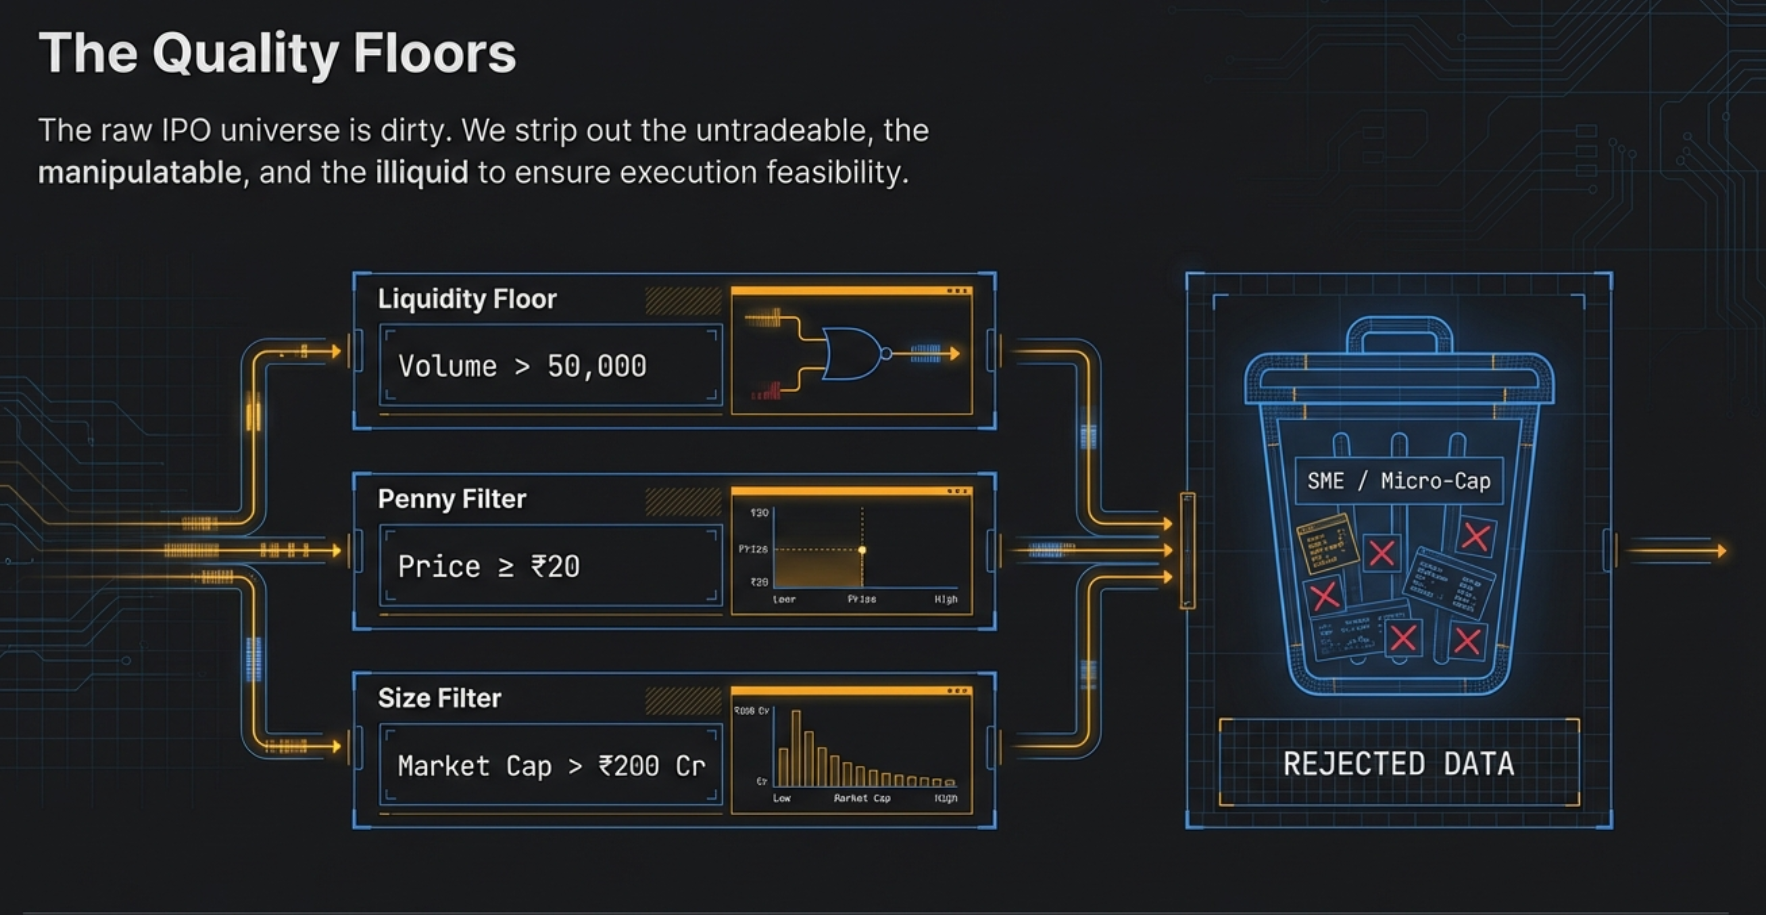
Condition 4 — Absolute Volume Minimum
Volume > 50,000 shares — "Minimum liquidity for execution"
In plain English: the stock must have traded more than 50,000 shares on the current day, regardless of its relative volume. This is the absolute liquidity floor. Some recently listed stocks — particularly smaller SME listings — have such low average daily volume that even "above average" might mean 30,000 or 40,000 shares. At those volumes, a retail investor cannot execute a meaningful position without causing significant market impact. The 50,000-share minimum ensures that any stock appearing in the tab is at least marginally executable. This is not a signal filter; it is a practical prerequisite for participation.
Condition 5 — Minimum Price Threshold
Close ≥ ₹20 — "Removes penny stocks and SME micro-listings"
In plain English: the stock's closing price must be at least ₹20. This threshold is deliberately low compared to the ₹100 minimum in the VCP tab, reflecting the reality that some legitimately interesting recently listed companies have lower unit prices. However, stocks below ₹20 are typically micro-cap SME listings with structurally insufficient liquidity, wide bid-ask spreads as a percentage of price, and vulnerability to manipulation. The ₹20 floor removes these while retaining a broad eligible universe among legitimately actionable recent listings.
Condition 6 — Minimum Market Capitalisation
Market Cap > ₹200 Crore — "Removes micro-cap SME issues"
In plain English: the stock's market capitalisation must exceed ₹200 Crore. This filter removes the smallest SME listings from the results. Stocks with market caps below ₹200 Crore are frequently subject to illiquidity, wide spreads, thin institutional participation, and in some cases governance concerns that are not visible in price and volume data alone.
The ₹200 Crore floor is a relatively low bar that preserves small-cap IPOs while eliminating the truly micro-scale listings where the risk profile is qualitatively different. A stock that listed at ₹250 Crore market cap and has since grown to ₹400 Crore approaches its all-time high within a size range where institutional interest is plausible and execution is feasible for retail participants using normal position sizing.
Condition 7 — Sort by Percentage Change Descending
Sorted by % change descending — "Strongest momentum first"
The results are sorted by the day's percentage price change, highest first. This puts the stocks with the strongest current-day momentum at the top of the list. When multiple recently listed stocks are simultaneously approaching their all-time highs on above-average volume, the one moving most strongly on that day has the most immediate momentum confirmation. This is the candidate to examine first.
All 7 Conditions — Master Reference Table
| Condition | What It Checks | Plain English | Why It Exists |
|---|---|---|---|
| 1 | No SMA(200) | Recently listed (<10 months) | Zero overhead resistance thesis applies only to recently listed stocks |
| 2 | Close ≥ 52W High × 0.98 | Within 2% of all-time high | Approaching uncharted territory where zero sellers exist above |
| 3 | Volume > SMA(Vol, 20) | Above-average volume | Confirms institutional participation, not thin low-conviction drift |
| 4 | Volume > 50,000 shares | Minimum absolute liquidity | Ensures position is executable without excessive market impact |
| 5 | Close ≥ ₹20 | Above penny stock threshold | Removes micro-listings with structurally unusable bid-ask spreads |
| 6 | Market Cap > ₹200 Cr | Above micro-cap floor | Removes SME listings where institutional participation is absent |
| 7 | Sort by % change desc | Strongest momentum first | Prioritises candidates with most immediate current-day momentum |
All seven conditions confirm quantitative eligibility — they do not confirm that the stock has a constructive base pattern, that the volume quality is sufficient for a high-conviction breakout, or that the sector context is supportive. The scanner delivers a short candidate list. Deep chart analysis on TradingView is the required next step before any trade decision.
Four Structural Tailwinds That Make IPO Breakouts Powerful
Zero overhead resistance is the primary reason IPO breakouts can move fast and far once they clear the all-time high. But it is not the only structural factor at work. Four additional dynamics converge in the months following a stock's listing to create a uniquely supportive environment precisely when these breakouts tend to occur.
Tailwind 1 — Lock-Up Expiry Dynamics
When a company lists on an exchange through an IPO, pre-IPO shareholders — promoters, early-stage investors, venture funds, and private equity backers — are typically subject to a lock-up period. In India, SEBI regulations impose lock-up restrictions that prevent pre-IPO shareholders from selling their shares in the open market for a defined period following listing. The exact duration varies by shareholder category, but six months to one year is typical for non-anchor investors.
During the lock-up period, these holders cannot sell regardless of the stock's price. When the lock-up expires, they regain the legal right to sell. This creates a theoretically negative event — the potential for large selling by holders who have accumulated unrealised gains. In practice, however, the dynamic is more nuanced. If the stock is approaching its all-time high near or above the listing price, virtually all pre-IPO holders are sitting on profits. When a holder is deeply in profit with no immediate financing need, the urgency to sell is low. They may choose to hold for further upside, reducing the actual selling pressure even as the legal right to sell is restored. The overhead supply increase at lock-up expiry is smaller than feared when the stock is near its highs — and may be negligible when the stock is at an all-time high with holders comfortably in profit.
A pre-IPO holder with a ₹50 investment now worth ₹120 at the stock's all-time high has a 140% unrealised gain. Unless they have a specific financing need, tax deadline, or portfolio rebalancing requirement, there is no psychological urgency to sell at this moment. Compare this to a holder sitting on a 30% loss at lock-up expiry — where the pressure to cut exposure is genuine. When IPO Breakout candidates are approaching their highs near lock-up expiry, the supply risk from unlocking is structurally lower than headlines suggest, because profitable holders are not distressed sellers.
Tailwind 2 — Analyst Initiation Pipeline
The first six to twelve months following a company's IPO listing is the period when sell-side investment analysts typically initiate coverage. There is a regulatory quiet period immediately post-listing (typically 40 days for underwriting banks in India) during which the IPO underwriters cannot publish research. After this lifts, the analysis pipeline opens.
When an analyst at a reputable brokerage initiates coverage with a "Buy" rating and a target price significantly above the current market price, the stock attracts a new wave of institutional attention. Fund managers who had not previously tracked the name begin building positions. The timing of analyst initiations — clustered in the six to twelve months post-listing — means they frequently coincide with the period when recently listed stocks are building bases and preparing to challenge their all-time highs. Positive analyst initiation near the all-time high level can be the catalyst that converts an imminent breakout into a confirmed one.
When an IPO Breakout candidate appears in the tab, a useful supplementary check is whether any analyst initiations have been published in the prior 30 to 60 days. A fresh "Buy" initiation from a credible brokerage adds a fundamental dimension to the technical setup. It suggests that the above-average volume on approach to the all-time high may reflect institutional position-building in response to that initiation — a particularly powerful combination of fundamental catalyst and technical trigger.
Tailwind 3 — Float Dynamics and Supply Exhaustion Speed
Newly listed companies frequently have a lower publicly available free float than their established counterparts. Promoter holdings are often above 60%, SEBI lock-up restrictions reduce the tradeable float further, and institutional allotments from the IPO may not immediately become active sellers. The result is that the publicly available supply of shares — the float that trades in the open market — may be relatively small.
A smaller float means that the same amount of buying pressure moves price further. An institutional fund allocating ₹30 Crore to a newly listed stock with a ₹300 Crore free float is buying 10% of the entire tradeable supply. The price impact of that purchase is significantly larger than if the same ₹30 Crore were deployed in a large-cap with thousands of crores of free float. When a small-float IPO approaches its all-time high on elevated volume, the supply exhaustion process happens more quickly than in a large, deeply floated stock. The breakout, when it comes, can be sharper and more sustained precisely because there is less supply available to absorb the buying demand at every level above the breakout point.
Tailwind 4 — Index Inclusion Pipeline
Many Indian market indices have eligibility criteria that include a minimum listing history — typically six months to one year. Stocks that listed less than one year ago are not yet eligible for inclusion in major indices such as the Nifty Smallcap 250 or Nifty Midcap 150. As a recently listed stock approaches its first anniversary, it begins to attract attention from passive fund managers evaluating its eligibility for upcoming index reviews.
The mechanics are straightforward: if a stock becomes eligible for index inclusion and is subsequently added to a major index, passive index funds and ETFs that track that index are required to buy shares in proportion to the index weighting. This creates a known, inelastic demand event. Active fund managers who anticipate the inclusion may begin accumulating shares ahead of the official inclusion date to avoid the announcement-day price jump. This pre-inclusion accumulation, concentrated in the months before a newly listed stock crosses its eligibility timeline, can drive precisely the kind of sustained above-average volume near the all-time high that the IPO Breakout scanner is designed to detect.
No single tailwind is reliably timed or guaranteed to appear. Lock-up expiry may not trigger selling. Analyst initiations vary in impact. Float dynamics depend on promoter concentration. Index inclusion is uncertain and conditional. But the combination of all four — operating simultaneously in the six-to-twelve-month window post-listing — creates a structural environment that is uniquely supportive for newly listed stocks approaching their all-time highs. The zero overhead resistance thesis provides the ceiling-removal logic; these four tailwinds provide the floor-building and demand-injection dynamics that can push price through that ceiling with surprising force.
Green Flags and Red Flags — Separating the Clean Setups from the Traps
The scanner confirms quantitative eligibility. It does not distinguish between a stock with a clean, constructive post-listing base and one with a violent, spike-and-crash history that leaves trapped buyers at the listing high. The chart review is what separates genuine setups from traps. These are the most important quality signals to assess on a chart review of any IPO Breakout candidate.
Green Flags — Characteristics of High-Quality IPO Breakout Setups
Enough time for IPO excitement to fade and a genuine base to form, but not so long that the window is nearly closed. The sweet spot for base quality and structural tailwind alignment.
Price action that narrows progressively after the initial post-listing period. Narrowing weekly ranges, controlled pullbacks, and price finding support at higher lows — all signs of constructive accumulation rather than distribution.
The scanner requires only above-average volume. But a day with volume at 2× or 3× the 20-day average is a qualitatively stronger signal than merely 1.1×. Higher relative volume is more conclusive evidence of institutional participation.
A recently listed stock moving toward its all-time high in a sector that is broadly in favour benefits from a tailwind that extends beyond the individual stock. Sector momentum reduces the friction of the move and increases the probability of continuation.
A stock that listed at a modest premium (10–30%) and has since built a genuine base is cleaner than one that rocketed 80% on listing day and then corrected sharply. The modest listing premium means the 52-week high is not contaminated by a large population of trapped listing-day chasers.
A "Buy" or "Outperform" initiation from a credible brokerage in the prior 30–60 days adds a fundamental catalyst dimension. The technical setup plus a fresh positive research report is a powerful combination.
Red Flags — Characteristics That Reduce Setup Quality
A stock that doubled on listing day and then fell 40% creates a meaningful population of trapped IPO-day buyers at the spike high. The zero overhead resistance thesis is compromised — there are concentrated sellers at the spike level who are watching for a chance to exit.
The scanner requires above-average volume, but "just barely above average" (1.05×) is categorically different from 2× or 3× average. Thin elevation of volume near the all-time high may be coincidental rather than institutional. Low relative volume on approach to the high is a weak signal.
A stock that has been listed for eight months and is only now — for the first time — approaching its listing-day high suggests that the post-listing period was characterised by sustained selling rather than accumulation. This is not the profile of a base-building IPO; it is a struggling listing. Approach with caution.
Post-listing price action characterised by large, random daily swings without a discernible pattern suggests neither accumulation nor distribution in control — simply volatility without direction. This stock has not formed a genuine base from which to mount a sustained breakout.
A stock with average daily volume of 30,000 shares that appears in the tab because today's volume is 55,000 shares (above average, above 50K minimum) still has structurally thin liquidity. Even a modest position of ₹2–3 lakhs can move the price on exit. The absolute volume floor catches the worst cases, but use judgement on stocks near the boundary.
Even the cleanest individual setup faces headwinds if the broader sector is under sustained institutional selling. Index inclusions, analyst initiations, and lock-up expiry tailwinds can be overwhelmed by sector-level headwinds. Check the sector ETF or index before treating the individual setup as high conviction.
Why IPO Stocks Cannot Be in Stage 2 — And Why That Matters
A common question from traders discovering the IPO Breakout tab is: why isn't this simply captured by the Stage 2 tab? If a recently listed stock is in a strong uptrend and approaching its high, shouldn't it appear in Stage 2? The answer is structural, and understanding it clarifies the fundamental difference between the two tabs.
Stage 2 — the Weinstein Stage 2 Markup Phase — requires three conditions to be simultaneously true: the current price must be above the 200-day SMA, the current price must be above the 50-day SMA, and the 50-day SMA must be above the 200-day SMA. The 200-day SMA requires 200 daily price observations to compute. A stock listed fewer than 200 trading days ago has no 200-day SMA. It cannot satisfy "price above SMA(200)" because SMA(200) does not yet exist. Stage 2 qualification is therefore mathematically impossible for recently listed stocks — not as a deliberate exclusion, but as a natural consequence of the data requirement.
| Dimension | IPO Breakout Tab | Stage 2 Tab |
|---|---|---|
| SMA(200) requirement | Must be absent (no SMA-200) | Must exist and price must be above it |
| Stock age | Fewer than ~10 months since listing | At least 10 months of trading history |
| Trend anchor | Listing price and listing-day high | 200-day and 50-day SMAs (established trend) |
| Stop-loss anchor | Base low (no SMA to reference) | Below SMA(200) or base low |
| Overhead supply profile | Zero above listing-day high (ideal case) | Variable; depends on prior trading history |
| Typical stock count on average day | 0–15 stocks | 100–200 stocks |
| Primary structural advantage | Zero overhead resistance above all-time high | Confirmed institutional uptrend; established support levels |
| Primary structural risk | No SMA anchors; limited technical framework | Overhead supply from prior highs may be substantial |
The absence of SMA(200) is not only the identifying condition for recently listed stocks — it is also the most significant technical limitation of the IPO Breakout setup. Traditional technical analysis relies heavily on moving averages as anchors for trend identification, stop-loss placement, and relative-strength analysis. A recently listed stock without a 200-day SMA lacks the framework that makes these anchors available. There is no long-term trend to confirm, no SMA to use as a stop reference, and no relative-strength comparison to the broader market index using the standard SMA-based approach.
This limitation has direct implications for risk management, which the execution section addresses specifically. Understanding that the IPO Breakout tab exists precisely because Stage 2 cannot capture this universe is what explains the tab's design philosophy: it is not Stage 2 with a different filter — it is a fundamentally different setup type, with different structural advantages and different risk management requirements.
The Execution Playbook — From Scanner Result to Trade Setup
The scanner has delivered a short list of recently listed stocks approaching their all-time highs on above-average volume. The chart review has confirmed constructive base-building and clean post-listing price action. Now the execution protocol converts the chart confirmation into a precisely defined trade with a specific entry level, stop reference, and exit plan.
Step 1 — Check the Chart From Listing Day
Open TradingView and set the chart to display from the stock's listing date. The full post-listing price history is the relevant context for this setup. Assess: Did the stock spike sharply on listing day? How deep was the subsequent correction? Is the current approach to the all-time high coming from an orderly base or from a chaotic recovery? Where is the current price relative to the listing price and the listing-day high?
1. Is the listing-day high a spike high (intraday extreme, well above the close) or a clean high (the stock opened strong and closed near its high)? A spike high with a large intraday wick suggests trapped buyers at that level — reducing the purity of the zero-overhead thesis. 2. Has the stock been building progressively higher lows since the initial post-listing correction? This is constructive base behaviour. 3. Is the current elevated volume a one-day anomaly or part of a multi-day pattern of increasing volume as the stock approaches the high? Sustained volume build is more convincing than a single elevated day.
Step 2 — Identify the Breakout Level and Stop Reference
For an IPO Breakout setup, the breakout level is the 52-week high (which equals the all-time high for a recently listed stock). This is the exact price above which the zero overhead resistance thesis applies in its purest form — the price above which no one has previously traded, and therefore no one is waiting to sell at breakeven.
The stop-loss reference for an IPO Breakout is the base low — the low of the most recent consolidation period before the approach to the high. Without an SMA(200) to reference, the base low is the primary technical stop anchor. The logic: if the stock's thesis is that it is building constructively and approaching its all-time high from a position of strength, it should not fall below the low of that constructive base. If it does, the thesis is invalidated.
Step 3 — Volume Confirmation on the Breakout Day
Place a buy-stop limit order just above the 52-week high with a modest buffer of 0.2% to 0.5%. On the day the stock clears its all-time high, volume must be meaningfully above the 20-day average — ideally 2 times or more. A breakout through the all-time high on barely-above-average volume is a weak confirmation. The more conclusive the volume surge, the stronger the institutional participation signal and the higher the probability of sustained follow-through.
In an established stock breaking above a prior resistance level, you can assess the overhead supply at that level by looking at how much the stock traded at or near that level historically. For a recently listed stock breaking its all-time high for the first time, there is no historical volume reference at the new price levels to use for supply estimation. The zero overhead resistance thesis is a structural argument, not an empirically verified historical analysis. Treat the volume on the breakout day as your primary real-time confirmation signal, compensating for the absence of historical supply data.
Step 4 — Position Sizing: Smaller Than Established Stocks
IPO Breakout setups carry higher uncertainty than established-stock momentum setups for several reasons: less price history to analyse, no SMA anchors for trend confirmation, potentially thinner liquidity, and the novelty of the post-listing environment which makes the stock's true supply-demand equilibrium harder to assess. These factors warrant a meaningfully smaller position size than you would use for a well-formed Stage 2 or VCP setup. A reasonable approach: size the IPO Breakout position at 50% to 70% of your normal position size for an equivalent risk level, to compensate for the additional uncertainty that the limited price history creates.
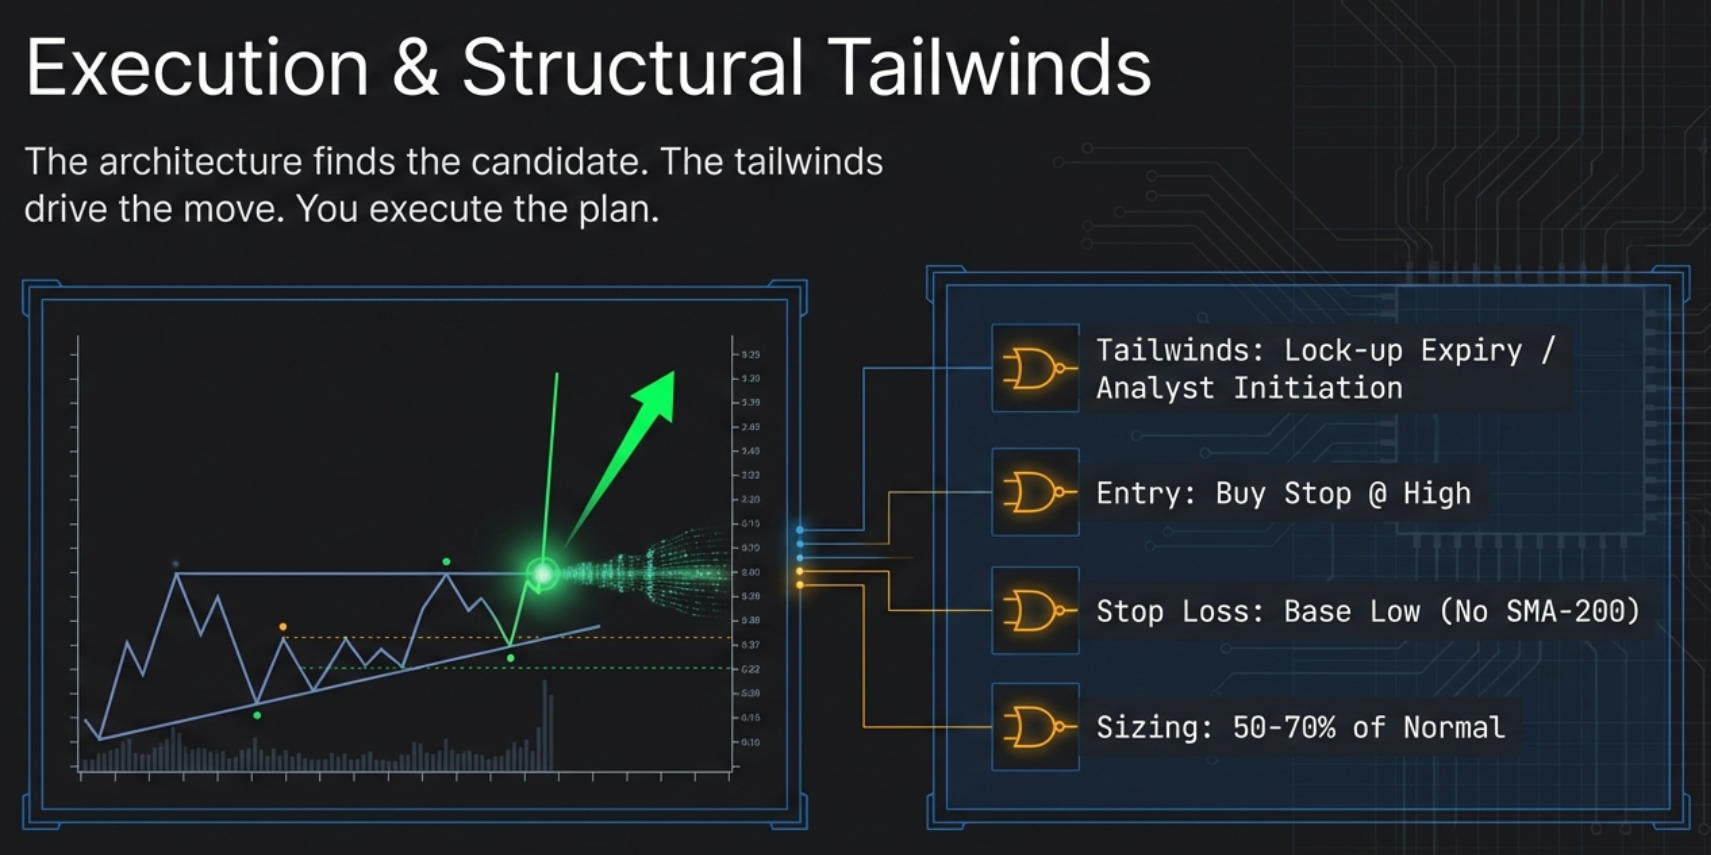
Chart from listing day
Review the full post-listing price history on TradingView. Assess base quality, listing-day spike size, and the orderliness of the approach to the all-time high.
Identify breakout level
The 52-week high is the all-time high for a recently listed stock. Mark it on the chart. This is the exact level above which zero sellers are trapped. Your buy-stop goes just above it.
Set stop at base low
Without SMA(200), the low of the most recent consolidation base is the primary stop anchor. If the stock falls below this level post-breakout, the thesis has failed. Exit without hesitation.
Confirm volume & execute
Wait for the breakout day. Confirm volume is at least 2× the 20-day average. Execute via buy-stop limit. Size smaller than normal — 50–70% of typical position — due to higher uncertainty.
Risk Management for IPO Breakouts — The Special Considerations
IPO Breakout setups require a modified risk management framework compared to established-stock momentum strategies. The absence of the 200-day SMA — the single most widely used technical anchor for institutional stop-loss reference — fundamentally changes the toolkit available for managing these trades. These are the specific adjustments required.
No SMA-200 Anchor — Use the Base Low Instead
Many momentum traders use the 200-day SMA as the "line in the sand" for a position — if price closes below the 200-day SMA, the long-term trend is violated and the position is exited. For IPO Breakout stocks, this anchor does not exist. The substitute is the base low — the low of the most recent identifiable consolidation period before the approach to the all-time high. This base low is the structural support level that the stock's constructive post-listing price action has built. A close below it invalidates the base, the thesis of orderly accumulation, and the setup itself.
Know the Lifecycle Position
Always understand where you are in the post-listing lifecycle before entering. Three pieces of information are essential: (1) the listing price — where the stock entered the public market, (2) the listing-day high — the peak of initial excitement, and (3) the current price in relation to both. A stock at ₹180 with a listing price of ₹120 and a listing-day high of ₹195 has a specific profile: it listed at ₹120, excited buyers pushed it to ₹195 on day one, and it has since recovered to ₹180 while approaching its ₹195 all-time high. Buyers between ₹180 and ₹195 from listing day are not yet at breakeven and could sell as the stock approaches ₹195. This is different from a stock where the listing-day high of ₹195 was the closing price — with far fewer trapped buyers in that range.
Accept That You Are Operating in Thinner Information Territory
For an established stock, ten years of price history, multiple earnings cycles, analyst coverage history, and institutional positioning data all exist to inform the analysis. For a stock listed six months ago, none of this is available. Management has not yet been tested through a full market cycle. The first few earnings reports post-listing may produce large surprises in either direction as the market calibrates expectations. Insider selling patterns have not yet had time to establish a readable history. Operating in thinner information territory means accepting higher uncertainty — and compensating for it with smaller position size and wider respect for the stop.
The reward profile of an IPO Breakout — zero overhead resistance above the all-time high, structural tailwinds from float dynamics and analyst initiations — can be compelling. But the risk profile is also genuinely higher than an equivalent established-stock setup. The practical response is not to avoid the setup but to participate at a proportionally smaller size. A trade where you risk ₹10,000 on a VCP setup might appropriately risk ₹6,000 to ₹7,000 on an IPO Breakout setup of equal technical quality. The reduced size acknowledges the information asymmetry while still allowing meaningful participation if the setup delivers its potential.
Have an Exit Plan Before the Market Opens
IPO Breakout stocks, with their lower trading history and potentially thinner float, can move sharply and quickly. An unexpected large gap up on the breakout day could mean the stock opens several percent above your intended entry level. A surprise negative earnings preannouncement could trigger a sharp gap down through the stop. In both cases, having pre-defined responses — what to do on a gap-up open above your limit, what to do on a gap-down open below your stop — prevents emotional decision-making in fast-moving conditions. Write the plan before the market opens. Execute the plan when the market opens.
Find Today's IPO Breakout Candidates
Finmagine Trader scans all recently listed NSE stocks for the zero overhead resistance setup in real time — every qualifying candidate in one click, ready for chart review and trade planning.
Open Finmagine Trader — FreeFree Chrome Extension
Ready to scan your first momentum list?
Install Finmagine Trader and scan 2,000+ NSE stocks for Stage 2 uptrends, VCP breakouts, near 52-week highs, and volume surges — in one click.
Install from Chrome Web Store →No account required • Works on Chrome, Edge, Brave • NSE stocks only
Continue the Finmagine Trader Series
All Three Signal Stage 2 Stocks VCP Breakout Setups TradingView Watchlist Precision Filters Tight Volatility 🔴IPO Breakout — Frequently Asked Questions
The most common questions about the IPO Breakout tab and the zero overhead resistance setup for recently listed Indian stocks, answered in detail. Click any question to expand the answer.