📚 Multimedia Learning Hub
Learn through multiple formats — read, watch, listen, and test yourself
What You'll Master in This Guide
⚡ Three Rebalancing Modes
Deploy Cash, Sell to Buy, and Both — each designed for a different situation. Know which to pick and why.
📐 The Drift Maths
Exactly how current weight, target weight, drift, BUY qty, and SELL qty are calculated — step by step.
⚠️ STCG Tax Warnings
How the STCG badge works, what it means for your tax bill, and how to act on it before placing orders.
🎯 Custom Target Weights
How the Edit Targets modal works, manual overrides, equal weight reset, and how settings persist across sessions.
📋 What You'll Learn:
- Why drift-triggered rebalancing beats calendar rebalancing for most Indian equity investors
- The exact formula for allocating new cash proportionally to underweight stocks
- How sell proceeds are redistributed — and why all underweight stocks get a fill (not just threshold-breakers)
- What the ⚠ STCG badge means and how to use it to defer tax-costly sells
- How to set per-stock target weights and what happens to unassigned stocks
- Why the tab doesn't execute trades — and exactly what to do after you get the action plan
- When to run the Backtest tab instead of (or before) rebalancing
Video Guide — Coming Soon
A full walkthrough video of the Rebalance tab is in production. Subscribe to the Finmagine YouTube channel to be notified when it drops.
Audio Deep Dive — Coming Soon
An audio commentary walking through the rebalancing logic, mode selection, and tax implications is coming soon.
🎯 25 Flashcards — Test Your Knowledge
Click any card to reveal the answer. Click again to flip back.
⚖️ What Is Portfolio Rebalancing — and Why Does It Matter?
You build a portfolio with intention. HDFC Bank at 10%, Titan at 8%, Bajaj Finance at 7%. Six months later, one of your picks has run up 60% while two others have barely moved. Your 7% Bajaj Finance position is now 12% of the portfolio. You're now running a concentrated bet you never consciously made.
This is portfolio drift — and it happens to every investor, automatically, as markets move. Left unchecked, drift means your winners keep getting bigger (concentration risk) and your laggards keep getting smaller (missing the recovery). Rebalancing is the disciplined act of correcting drift back to your intended weights.
The Rebalance tab in Finmagine Portfolio Manager makes this concrete: it reads your live holdings, computes the drift for every stock, and outputs an exact action plan — with share quantities, rupee amounts, and tax warnings — so you know exactly what to do today.
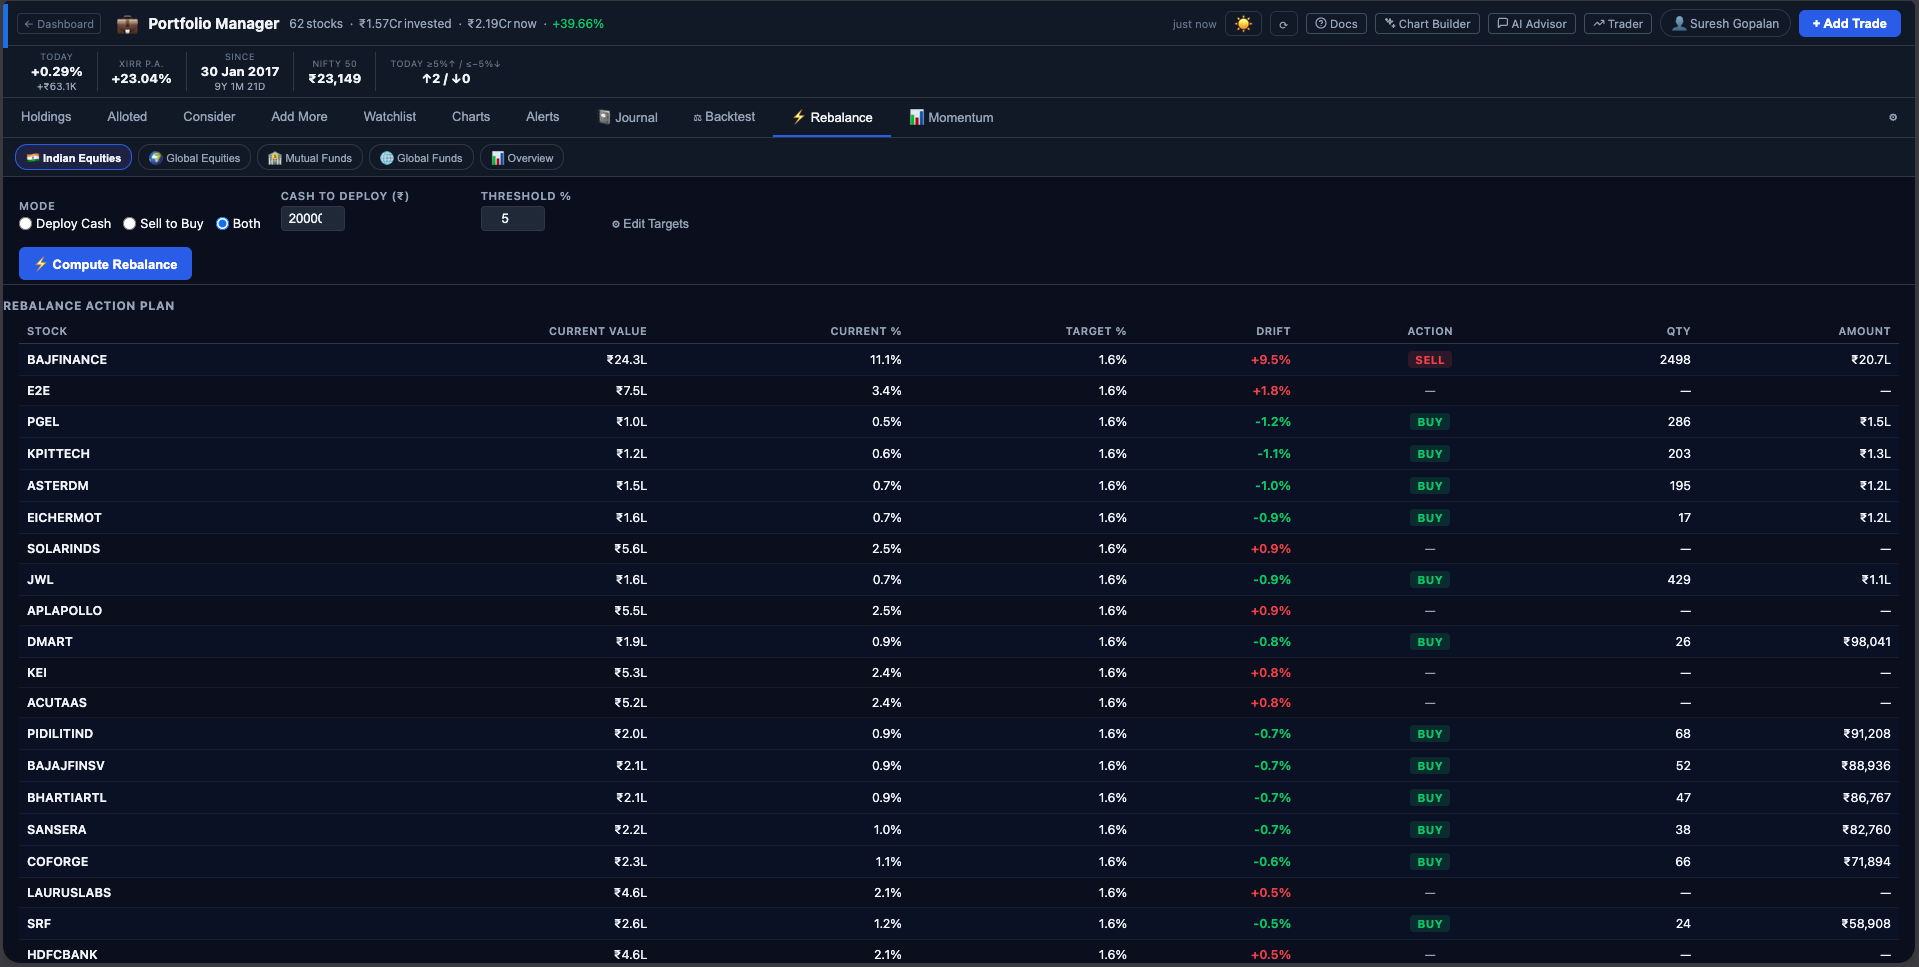
📋 The Action Plan Table — Column by Column
After clicking ⚡ Compute Rebalance, the results table appears with one row per holding. Rows are sorted by absolute drift — the stocks that have drifted furthest from target (in either direction) appear first.
| Stock | Current Value | Current % | Target % | Drift | Action | Qty | Amount |
|---|---|---|---|---|---|---|---|
| BAJAJFINSV | ₹2.05L | 14.2% | 8.3% | +5.9% | SELL ⚠ STCG | 5 | ₹8,550 |
| DMART | ₹1.73L | 12.0% | 8.3% | +3.7% | — | — | — |
| PGEL | ₹50.6K | 3.5% | 8.3% | −4.8% | BUY | 18 | ₹9,216 |
| HDFC | ₹45.2K | 3.1% | 8.3% | −5.2% | BUY | 3 | ₹4,110 |
- Stock — NSE ticker symbol
- Current Value — live market value (LTP × qty held), formatted compactly (₹K / ₹L / ₹Cr)
- Current % — this stock's share of your total portfolio value right now
- Target % — your desired weight (from Edit Targets, or equal weight by default)
- Drift — Current % minus Target %. Red = overweight, blue = underweight
- Action — BUY (green badge), SELL (red badge), or — (within threshold, no action needed). An ⚠ STCG badge appears alongside SELL when the position was opened less than 1 year ago
- Qty — whole shares to buy or sell (BUY rounds up; SELL rounds down)
- Amount — approximate rupee value of the action at current LTP
⚡ Three Rebalancing Modes
The most important decision before clicking Compute is choosing the right mode for your situation. Each mode has a distinct use case:
Deploy Cash
You enter a cash amount (e.g. ₹50,000 from your monthly savings). The tab allocates it to stocks that are more than Threshold % below their target weight, proportional to how underweight they are. No selling happens. Zero capital gains tax. Best when: adding fresh savings, or when many holdings are STCG-flagged and you want to defer selling.
Sell to Buy
No new cash. Stocks more than Threshold % above target are sold; proceeds are redistributed to all underweight stocks (not just threshold-breakers). A complete internal rebalance. Best when: no fresh capital is available, or when your portfolio is significantly skewed and needs surgical correction.
Both
First deploys your cash to threshold-underweight stocks. Then sells overweight stocks and uses proceeds to fill any remaining deficit across all underweight stocks. The most complete rebalancing — minimises required selling by using cash first. Best when: you have fresh capital AND meaningful drift in the portfolio.
📐 The Maths — Exactly How It's Calculated
Understanding the underlying maths helps you predict the output before running it — and spot if something looks wrong.
Portfolio Weights
Current Weight % = (stock's market value ÷ Total Portfolio Value) × 100
Drift = Current Weight % − Target Weight %
Overweight → Drift > 0 → potential SELL
Underweight → Drift < 0 → potential BUY
Deploy Cash — BUY Allocation
Total deficit = Σ |Drift| for all eligible stocks
Stock allocation = Cash × (|stock drift| ÷ Total deficit)
BUY qty = Math.ceil(allocation ÷ LTP) ← always rounds UP
Example: ₹50,000 to deploy. Two eligible stocks — Stock A is 8pp below target, Stock B is 4pp below. Total deficit = 12pp. Stock A gets ₹50,000 × (8/12) = ₹33,333; Stock B gets ₹50,000 × (4/12) = ₹16,667.
Sell to Buy — SELL Calculation
Excess value = (Drift / 100) × Total Portfolio Value
SELL qty = Math.floor(Excess value ÷ LTP) ← always rounds DOWN
Sell proceeds = SELL qty × LTP
Proceeds distributed to: ALL stocks where Drift < 0
(proportional to each stock's deficit vs total deficit of underweight stocks)
Both Mode
Step 2: Sell overweight stocks (same formula as Sell to Buy)
Step 3: Distribute sell proceeds to ALL underweight stocks,
but only to fill the GAP remaining after Step 1 allocations
Gap = max(0, deficit_value − already_buying_amount)
🎚️ Setting the Right Threshold %
The Threshold % (default: 5) is the most important tuning parameter. It directly controls how often you rebalance and how large the corrective trades are.
Effect of Different Threshold Values
- 1–2% threshold — Very sensitive. Almost every stock will need an action after any meaningful market move. Creates frequent small trades with high transaction costs relative to the correction size. Not recommended for most investors.
- 3–5% threshold — The practical sweet spot for most Indian equity portfolios. Triggers only when drift is meaningful. For a 10-stock equal-weight portfolio (10% each), a 5% threshold means a stock must reach 15% weight before being sold. Good balance of discipline and cost efficiency.
- 7–10% threshold — Conservative. Only triggers on large concentration events. Fewer trades, lower tax drag, but allows significant drift to accumulate. Suits investors who prefer a lighter-touch approach.
- 15–20% threshold — Near-inertia. Functionally only rebalances after a major multi-bagger run-up or a deep drawdown in one position. Closer to buy-and-hold with occasional corrective action.
🎯 Custom Target Weights — Edit Targets Modal
By default, the Rebalance tab assumes an equal-weight portfolio — every holding gets 100 ÷ N % as its target. For most investors this is a fine starting point. But if you have strong convictions about specific positions, you can set custom targets.
Click ⚙ Edit Targets to open the modal. It shows every holding with its current % and an editable target % field.
How Overrides Work
You don't need to set targets for every stock. The system handles partial overrides intelligently:
Remaining weight = 100% − Manual targets sum
Auto-equal per stock = Remaining weight ÷ count of stocks WITHOUT a manual target
Example: 12-stock portfolio. You set HDFC at 15% and Titan at 12%. Manual sum = 27%. Remaining = 73%. The other 10 stocks each get 73 ÷ 10 = 7.3% as their auto-target.
↺ Equal Weight Reset
The Equal Weight button instantly sets every stock to 100/N % and clears all manual overrides. Useful when you want to start fresh or quickly check what equal-weight rebalancing would look like.
Settings Persistence
Your target weights, mode, threshold, and cash amount are saved to your Portfolio Manager settings and cloud-synced. The next time you open the Rebalance tab — even on a different device — your configuration is restored automatically.
⚠️ The STCG Tax Warning — Understanding It and Acting on It
One of the most practically useful features of the Rebalance tab is the STCG badge. Indian equity investors face two different capital gains tax regimes depending on holding period:
- Short-Term Capital Gains (STCG) — Shares held for less than 12 months. Tax rate: 20% on gains (post Budget 2024-25). No exemption threshold.
- Long-Term Capital Gains (LTCG) — Shares held for 12 months or more. Tax rate: 12.5% on gains above ₹1.25 lakh annual exemption.
How the Tab Detects STCG Risk
The tab uses the earliest purchase date for each ticker across all your recorded trades. If any trade for that stock is less than 1 year old, the ⚠ STCG badge appears when that stock is flagged for selling.
What to Do When You See a STCG Badge
- Check how far away the 1-year mark is. If it's 1–3 months away, consider waiting — the tax saving may be worth more than the rebalancing correction.
- Use Deploy Cash mode instead — invest new money into underweight stocks without selling the STCG-flagged position.
- Accept the STCG if the overweight position is causing meaningful concentration risk that outweighs the tax cost.
- Always consult a chartered accountant or tax professional before making decisions based on tax implications.
🗺️ Step-by-Step Rebalancing Workflow
- Open the Rebalance tab — available at finmagine.com/portfolio/ for Premium subscribers. Ensure your trades are up to date and LTPs have been refreshed (hit ⟳ if needed).
- Choose your Mode — Deploy Cash if you have new savings, Sell to Buy if you're working within the existing portfolio, Both for the most complete rebalance.
- Set Cash to Deploy (Deploy Cash / Both modes only) — enter your available investment amount. The tab uses this exact figure.
- Set Threshold % — start with the default of 5%. Lower it if you have a large concentrated portfolio that needs more frequent nudging; raise it if you prefer a light-touch approach.
- Edit Targets (optional) — click ⚙ Edit Targets if you want custom weights. Use ↺ Equal Weight to reset to equal distribution. Ensure Total reads 100.0% before saving.
- Click ⚡ Compute Rebalance — the Action Plan table appears instantly.
- Review the Drift column — stocks sorted by absolute drift. The largest drifts are at the top. Confirm the direction (over vs under) makes intuitive sense given recent market moves.
- Check the Summary row — total buys and sells at a glance. Verify the total buy amount is within your cash budget (Deploy Cash mode) or covered by sell proceeds (Sell to Buy mode).
- Review STCG badges — for each ⚠ STCG sell, decide: wait for the 1-year mark, accept the tax, or use Deploy Cash instead.
- Place orders manually in your broker app — use the Qty and Amount columns as your reference. Note that prices may have moved since computation; verify before placing.
🚫 Important Limitations
Being clear about what the Rebalance tab does not do is as important as understanding what it does:
- No broker integration — The tab cannot place orders. It produces an action plan only. You execute it manually in Zerodha, Upstox, Groww, or any other broker.
- No FIFO lot analysis — The STCG flag uses earliest purchase date per ticker. Actual tax liability depends on lot-by-lot FIFO accounting. Consult a tax professional for precise tax calculations.
- No transaction cost modelling — Brokerage charges, STT (Securities Transaction Tax), exchange transaction charges, SEBI fees, and GST on brokerage are not deducted from the action amounts. Factor these in when evaluating whether a small rebalancing trade is worth the cost.
- Indian Equities only — Mutual funds, global equities, and global funds/ETFs are excluded. The Rebalance tab works on IN_EQ holdings only.
- Prices are live but not real-time — LTPs are fetched from Yahoo Finance and may be delayed. For volatile markets, recompute just before placing orders.
- Not investment advice — The action plan is a mathematical output of weight drift calculations. It does not account for business fundamentals, earnings outlook, sector rotation, or any qualitative factor. Always do your own research.
⚡ Ready to Rebalance?
Open the Portfolio Manager web app, head to the Rebalance tab, and compute your action plan in seconds.
Open Rebalance Tab →