Following along? Install the extension first
Finmagine Financial Chart Builder — free • no account needed • Chrome, Edge, Brave
🎙 Multimedia Learning Hub
Four display modes, period filters, CSV export, chart type flexibility — video walkthrough, deep-dive audio, and 60 interactive flashcards
What You Will Master
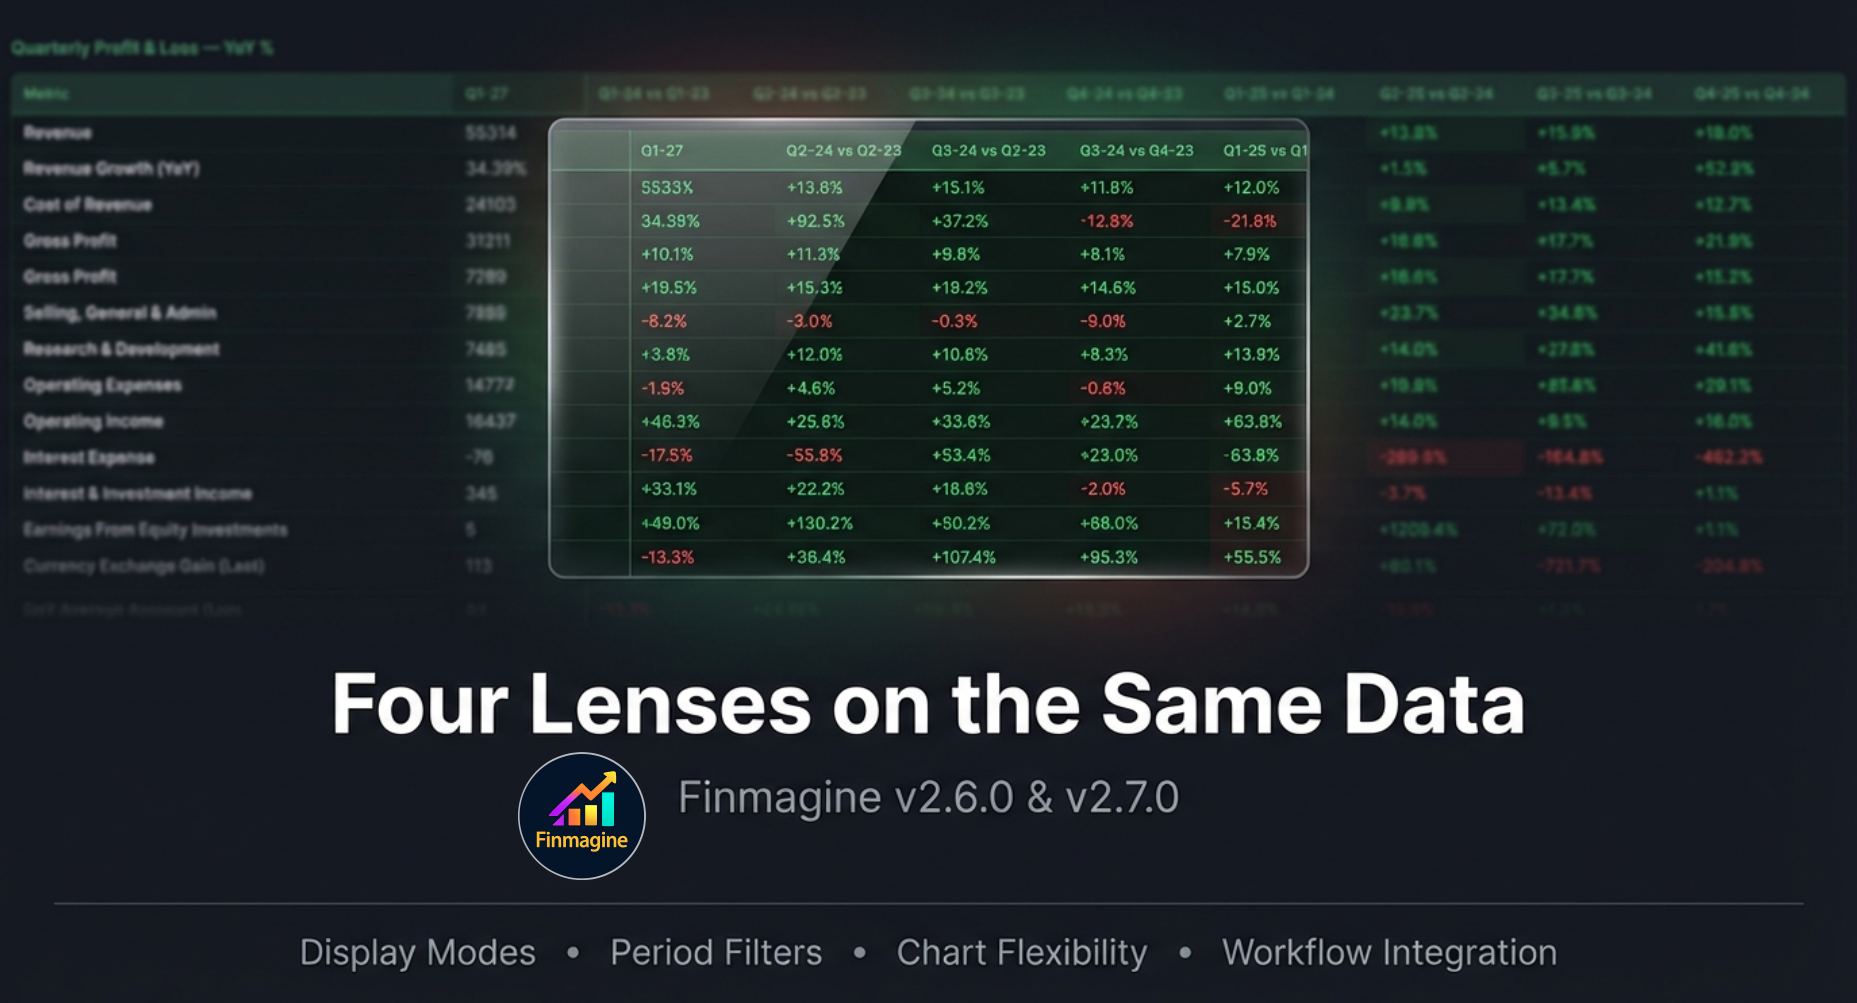
The Charts tab has always let you select metrics and draw charts. Finmagine v2.6.0 adds a layer on top: four Display Modes that transform the same financial table into four different analytical perspectives — each designed to answer a specific question that raw numbers cannot answer by themselves.
v2.7.0 adds chart type flexibility: switch all charts to clean trend lines with one click, or fine-tune individual metrics via the legend. Plus dedicated scroll buttons and a Back to Top pill for long-panel navigation.
The Four Lenses Covered:
- Raw numbers, absolute scale
- Sizing the business
- Ground truth reference
- Year-over-year growth rates
- Growth inflection points
- Operating leverage check
- Quarter-on-quarter momentum
- Acceleration badges (⬆/⬇/→)
- Early recovery signals
- Every line as % of revenue
- YoY margin pp deltas
- Operating leverage audit
Also Covered (v2.6.0 & v2.7.0):
- All / Last 8 / Last 4
- Focus on current momentum
- Affects charts & CSV export
- WYSIWYG export
- Exports calculated values
- Respects period filter
- Global one-click override
- Per-metric legend badge toggle
- Non-destructive — fully reversible
- ↑/↓ scroll buttons (200px/click)
- Back to Top pill (300px trigger)
- Context-aware across all 5 tabs
Plus: A live case study using Alphabet Inc. (GOOGL) with real quarterly P&L data demonstrating all four Display Modes in sequence, a complete 6-step analytical workflow, and a “Which Mode When?” decision reference table.
Stop Staring at Financial Statements — Use This 6-Step Finmagine Workflow Instead
Four display modes explained, the 6-step analytical sequence, and a live Alphabet Inc. (GOOGL) walkthrough — all in one video.
Four display modes • The 6-step analytical workflow • Live walkthrough with Alphabet Inc. (GOOGL)
🎧 X-Ray Vision for Financial Statements — Audio Deep Dive
A podcast-style deep dive into how Display Modes transform financial analysis — featuring the Alphabet GOOGL live case study, the “empty calorie growth” concept, and the full 6-step analytical hierarchy. ~20 minutes.
Generated with NotebookLM • Covers all four Display Modes in depth • Includes live GOOGL walkthrough • Best enjoyed with headphones
Test Your Knowledge — 60 Flashcards
Click any flashcard to reveal the answer. Search by topic to focus on a specific area.
Table of Contents
- The Data Perspective Problem — and Four Solutions
- The Display Mode Toggle: A New Way to Read Your Tables
- YoY% Mode — Spotting Growth Inflection Points
- QoQ% Mode — Catching Quarterly Acceleration
- % of Sales Mode — The Margin Telescope
- Period Filter — Zoom In or Out
- CSV Export — Data Beyond the Browser
- Lines/Bars Toggle (v2.7.0) — Chart Type Freedom
- Per-Metric Chart Type Toggle — Fine-Grained Control
- The Complete Workflow — All Modes, One Company
- Panel Navigation — Scroll Buttons & Back to Top
- Live Case Study — Alphabet Inc. (GOOGL) Step-by-Step
- Which Mode When? A Decision Guide
The Data Perspective Problem — and Four Solutions
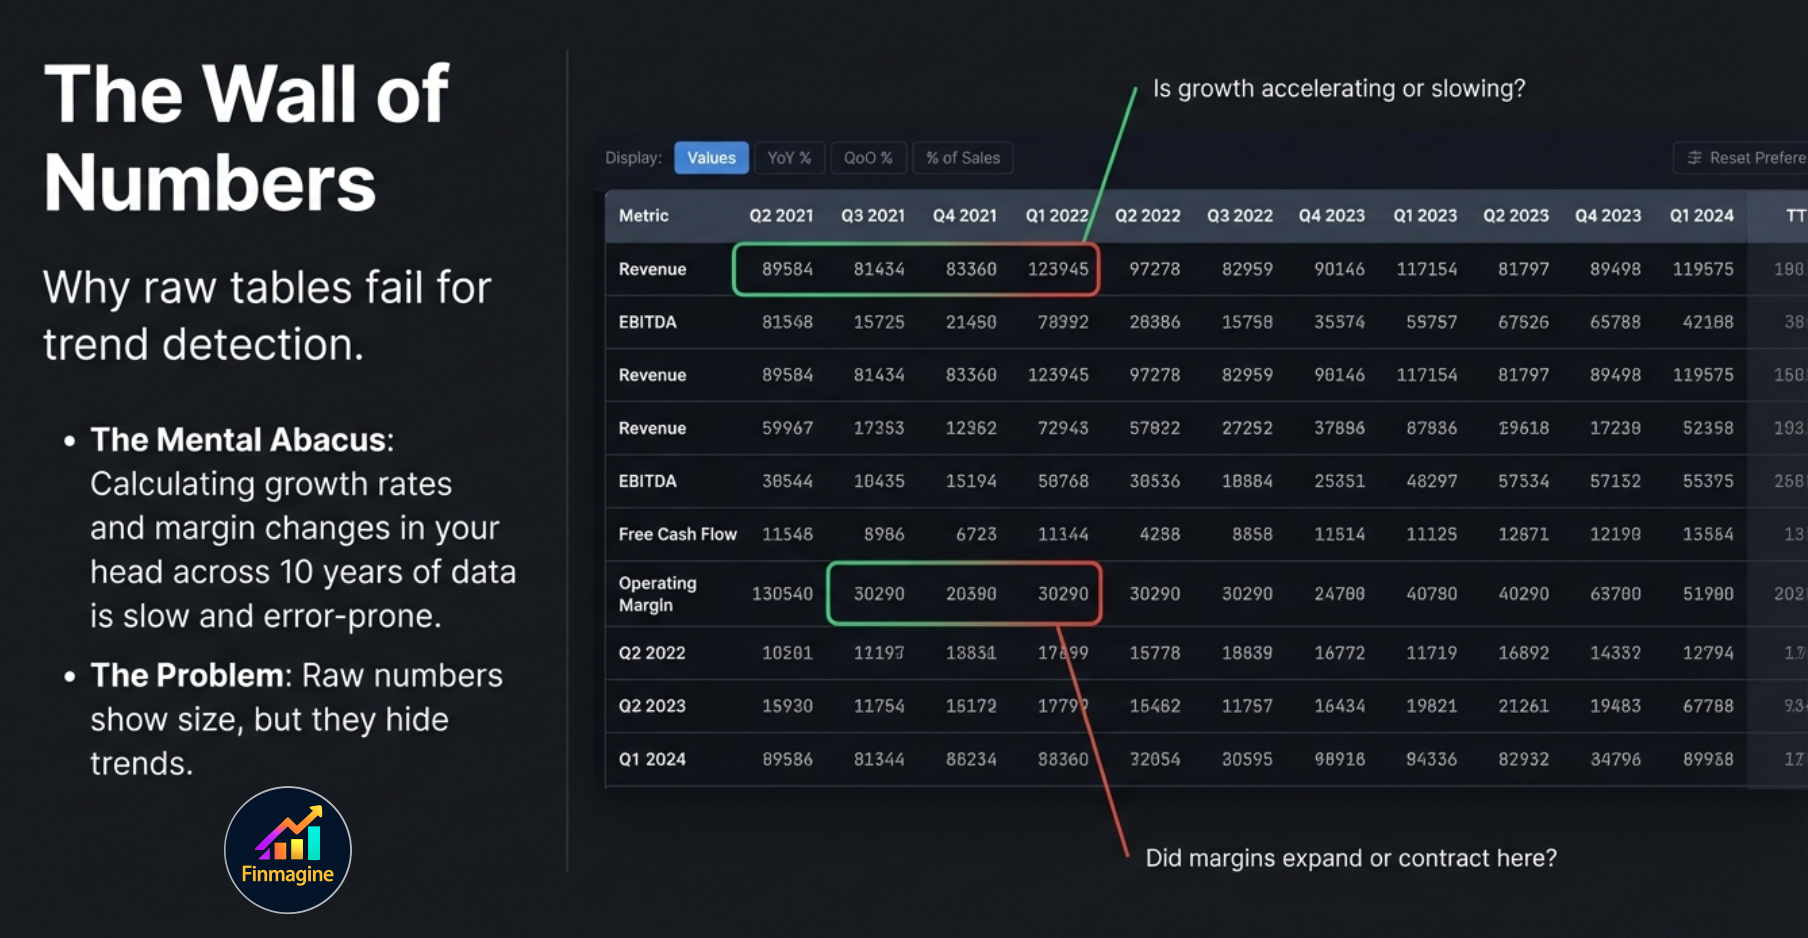
It’s 11 PM. You’ve finally sat down to look at a company you’ve been meaning to research for weeks. You pull up the quarterly P&L on Screener.in. Revenue: ₹23,451 Cr. Year before: ₹18,932 Cr. Year before that: ₹17,200 Cr. Year before that: ₹14,800 Cr.
You squint at the numbers. Is growth speeding up or slowing down? You pull out the mental abacus. 23,451 minus 18,932... divide by 18,932... that’s about 24%. And the year before... 18,932 minus 17,200... divide by 17,200... about 10%. So growth accelerated. But then you need to check if Operating Profit is keeping pace. And margins. And whether this quarter’s results follow the same pattern. Forty-five minutes later you’ve done a lot of arithmetic and very little actual analysis.
This is The Mental Abacus Problem. Raw financial tables are data-dense but insight-poor. They show you size. They hide trends. And answering the most important analytical questions — is growth accelerating? are margins expanding? is operating leverage real? — requires calculations that your brain shouldn’t be doing manually.
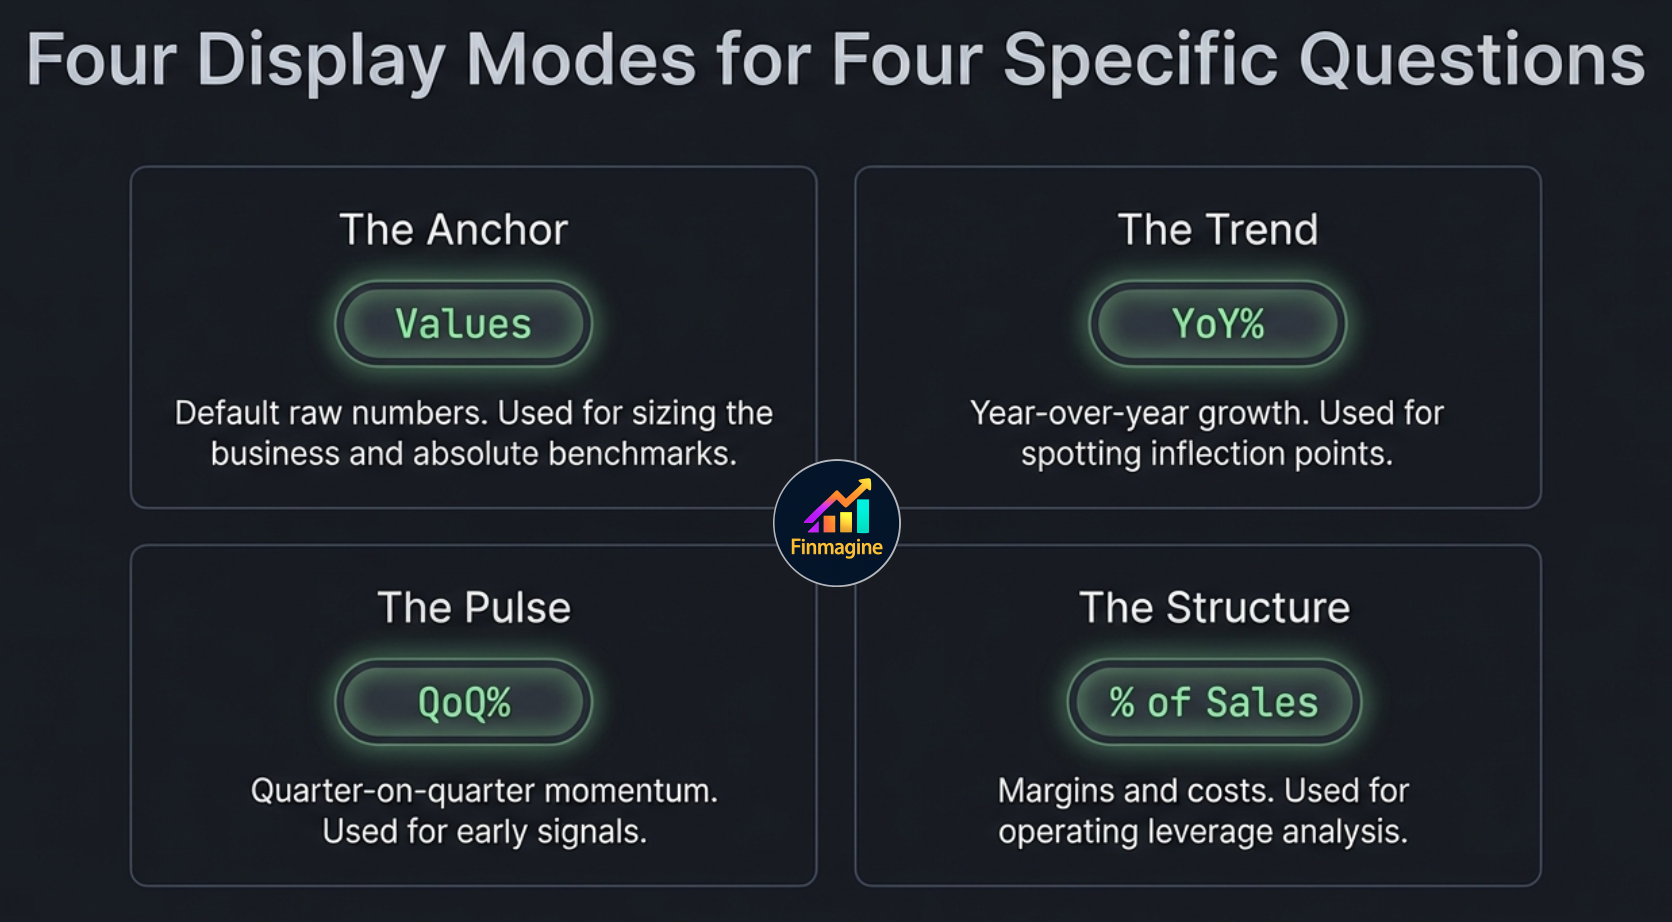
Finmagine v2.6.0 solves this with four Display Modes. Instead of one view of the data, you get four purpose-built lenses, each designed to answer a specific analytical question:
The Four Perspectives in v2.6.0
- Values (the default) — Raw numbers: Revenue of ₹23,451 Cr. Needed for: sizing the business, absolute benchmarks.
- YoY% — Year-over-year growth: Revenue grew +23.9% this year vs +10.1% last year — acceleration confirmed. Needed for: spotting inflection points.
- QoQ% — Quarter-on-quarter change: Revenue up +8.2% this quarter vs +3.1% last quarter — ⬆ Accelerating. Needed for: momentum, early signals.
- % of Sales — Costs and profits as a share of revenue: EBITDA margin 21.7% ↑+1.2pp. Needed for: margin structure and operating leverage.

Version 2.7.0 adds a fifth dimension — not to the tables, but to the charts themselves:
This guide covers every one of these features in depth: how they work, what they reveal, and when to use each one. A live case study using Alphabet Inc. (GOOGL) demonstrates the full 6-step workflow on real data.
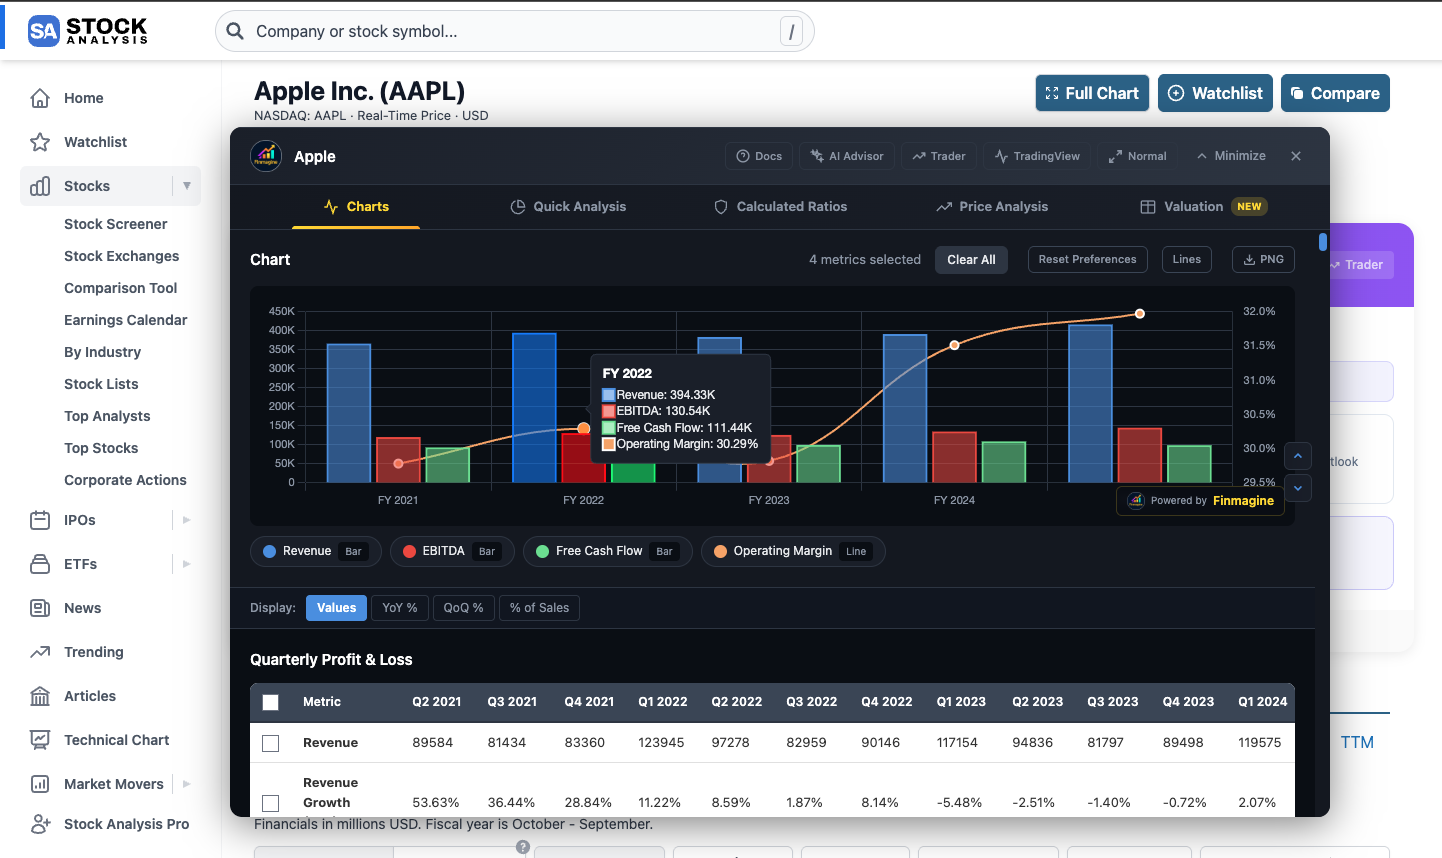
The Display Mode Toggle: A New Way to Read Your Tables
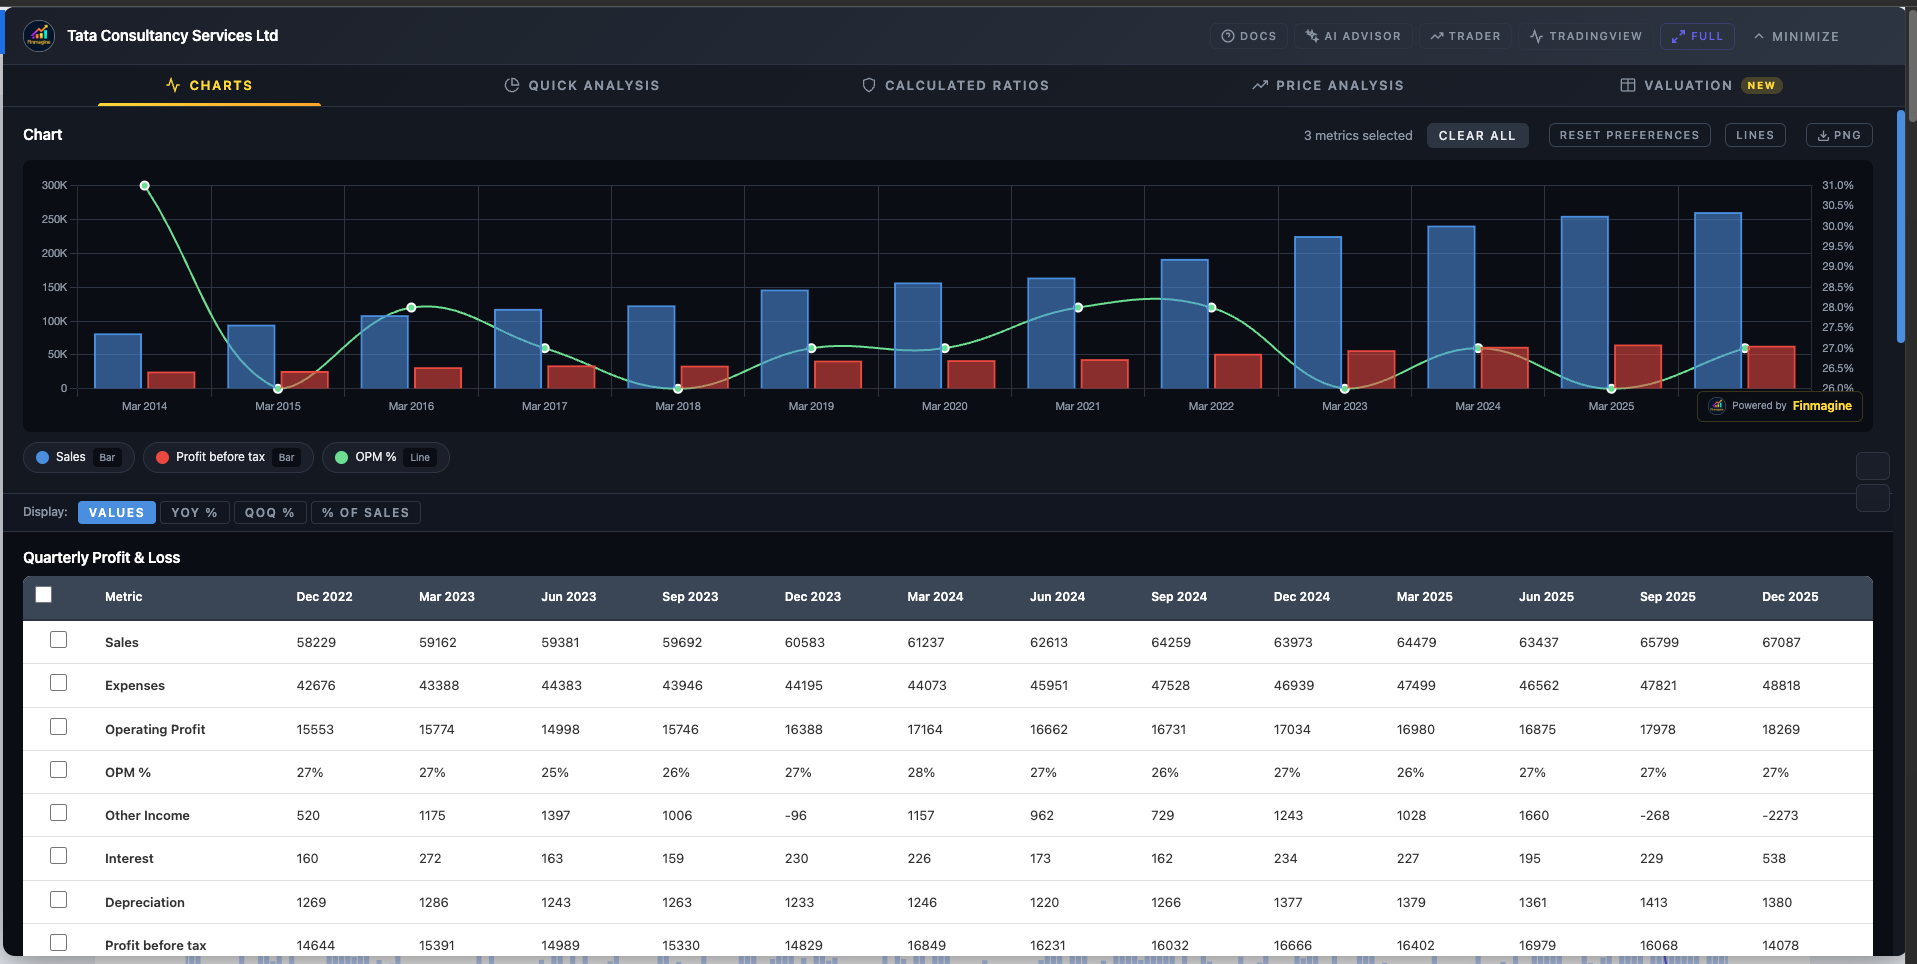
The Display Mode toggle appears as four buttons directly in the Charts tab panel header, next to the existing section controls:
Clicking any button instantly transforms all visible financial tables into that perspective. The chart above the tables updates simultaneously to reflect any data that has been selected for charting. Clicking Values returns to the default raw number view at any time.
The Dark-Green View Table — Separation of Concerns
This is the most important design principle to understand about Display Modes. When you activate YoY%, QoQ%, or % of Sales, the extension does not modify your original financial tables. Instead, it creates a separate read-only "view table" displayed with a dark-green theme, rendered below the mode toggle buttons.
Your original tables remain exactly as Screener.in rendered them — intact, untouched, ready to be charted from. The view table is purely a derived display layer. This means:
- You can chart raw values AND view them as YoY% simultaneously
- Switching modes never breaks your selected metrics
- The original data is always recoverable by clicking "Values"
Here is what the dark-green view table looks like in YoY% mode for a hypothetical P&L table:
| Metric (YoY%) | Mar 2020 | Mar 2021 | Mar 2022 | Mar 2023 | Mar 2024 |
|---|---|---|---|---|---|
| Sales | — | -4.2% | +18.6% | +23.9% | +10.1% |
| Operating Profit | — | -11.3% | +22.1% | +31.4% | +8.7% |
| Net Profit | — | -18.5% | +34.2% | +45.8% | +12.3% |
YoY% view table — dark green theme, read-only, does not affect original charting tables
How to Activate Each Mode
| Mode | Button | What Changes | Chart Updates |
|---|---|---|---|
| Values | Values | Returns to default raw numbers view | No change; charts show absolute data |
| YoY% | YoY% | All table cells show year-over-year % change | Charts update to show YoY% growth rates |
| QoQ% | QoQ% | All table cells show quarter-over-quarter % change + badges | Charts update to show QoQ% changes |
| % of Sales | % of Sales | All cells as % of Sales/Revenue + YoY pp delta | Charts update to show % of Sales ratios |
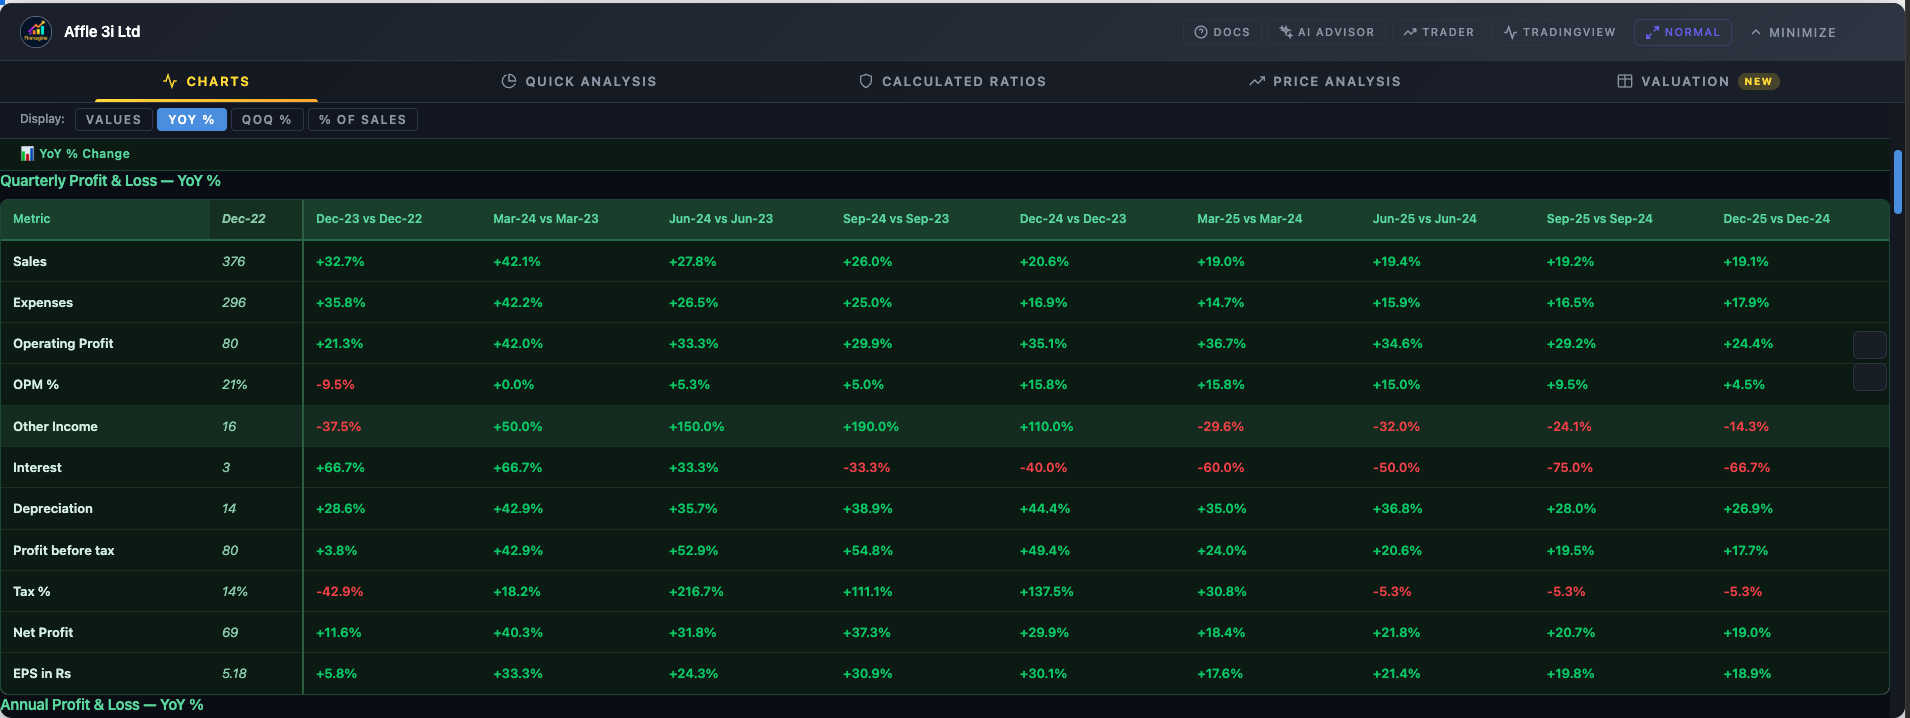
YoY% Mode — Spotting Growth Inflection Points v2.6.0
Year-over-year percentage change is the most fundamental measure of business momentum. A company growing revenue at +25% this year vs +8% last year tells a completely different story than the raw numbers alone. YoY% mode transforms every cell into a growth rate, making inflection points immediately visible.
What You See in YoY% Mode
Each cell shows the percentage change from the same period in the prior year:
| Metric (YoY% — Annual) | Mar 2020 | Mar 2021 | Mar 2022 | Mar 2023 | Mar 2024 |
|---|---|---|---|---|---|
| Sales | — | ▼ -4.2% | ▲ +18.6% | ▲ +23.9% | ▲ +10.1% |
| OPM % | — | ▼ -8.1% | ▲ +2.9% | ▲ +5.6% | ▼ -1.4% |
| Net Profit | — | ▼ -18.5% | ▲ +34.2% | ▲ +45.8% | ▲ +12.3% |
Green = positive growth, Red = contraction, — = base year (no prior data)
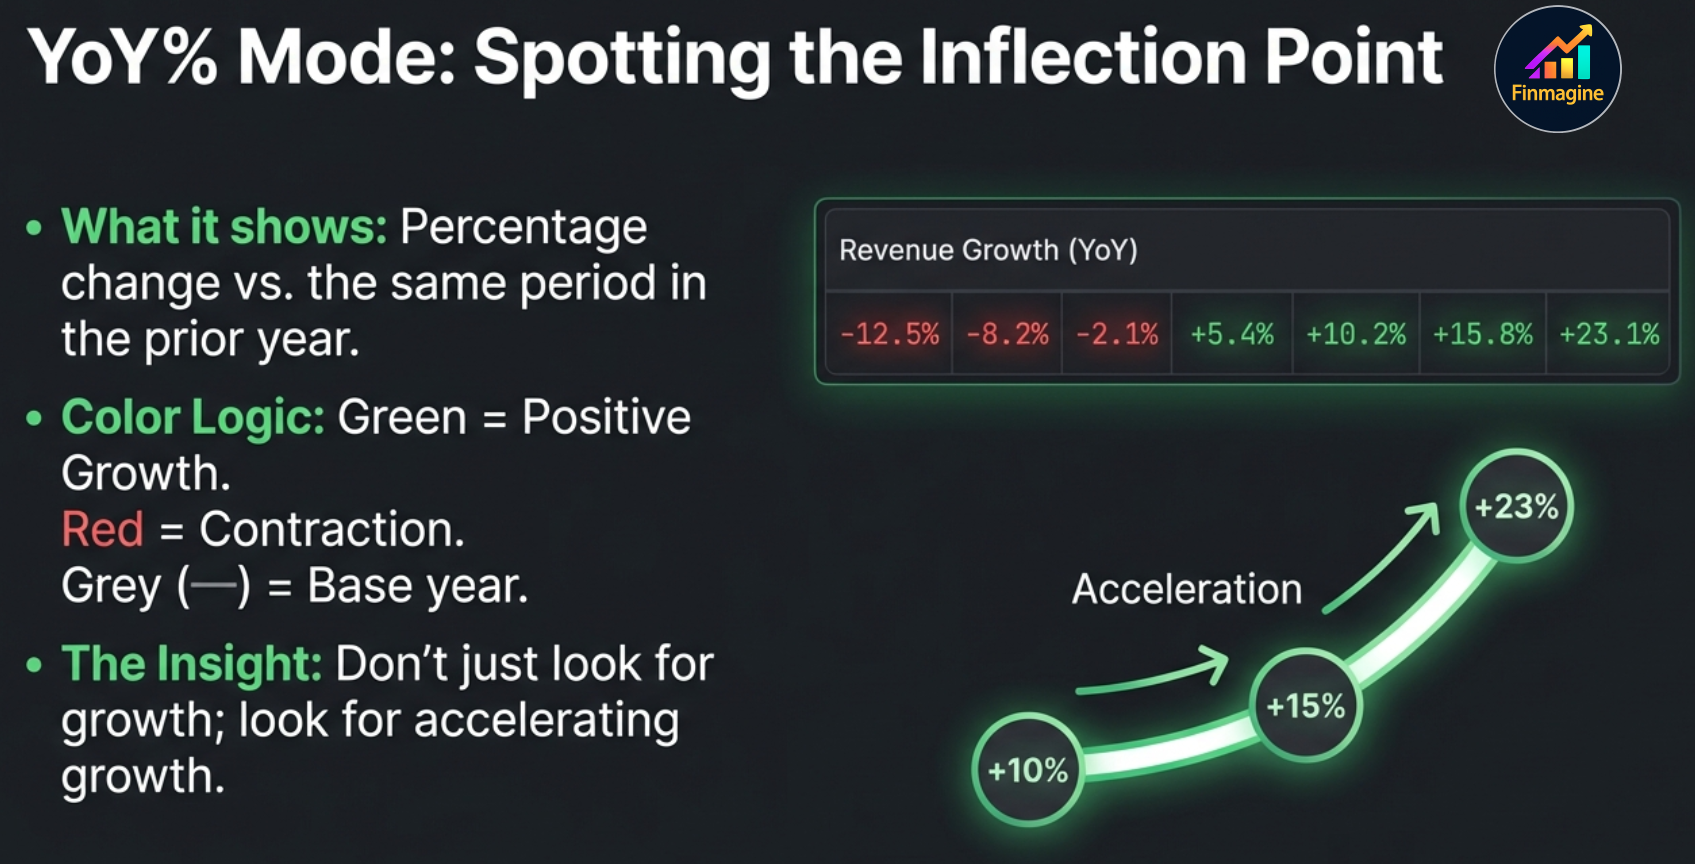
Color Coding
| Color | Meaning | Example |
|---|---|---|
| Green | Positive growth (above zero) | +23.9% revenue growth |
| Red | Contraction (below zero) | -4.2% revenue decline |
| Grey (—) | Base year — no prior period available | First year in dataset |
The Inflection Point Signal
An inflection point occurs when the rate of change itself changes direction. A company growing at +10%, +15%, +23%, +32% shows accelerating growth — not just growth, but improving growth. A company growing at +32%, +23%, +15%, +10% shows decelerating growth — still positive, but the engine is slowing. Without YoY% view, you cannot see this pattern in the raw numbers without mental arithmetic across 5 years. In YoY% view, it is immediately obvious from the color gradient and the direction of numbers.
Practical Applications
- Revenue acceleration: Are YoY% growth rates climbing? The business may be hitting a flywheel moment.
- The operating leverage check: Is Net Profit YoY% consistently higher than Revenue YoY%? If so, costs are growing slower than revenue — operating leverage is real. In YoY% mode, this comparison takes seconds: you just scan two rows and compare the numbers.
- One-time spike vs sustained growth: A single year of exceptional YoY% surrounded by average growth years is likely a one-time event, not a trend. YoY% mode makes this pattern immediately obvious — a lone green spike in a sea of moderate numbers.
- COVID base-effect warning: FY2021 often shows large negatives in YoY% (pandemic impact), followed by large positives in FY2022 (base-effect recovery). Seeing this pattern in “All” filter view helps you avoid mistaking base-effect rebounds for genuine business acceleration.
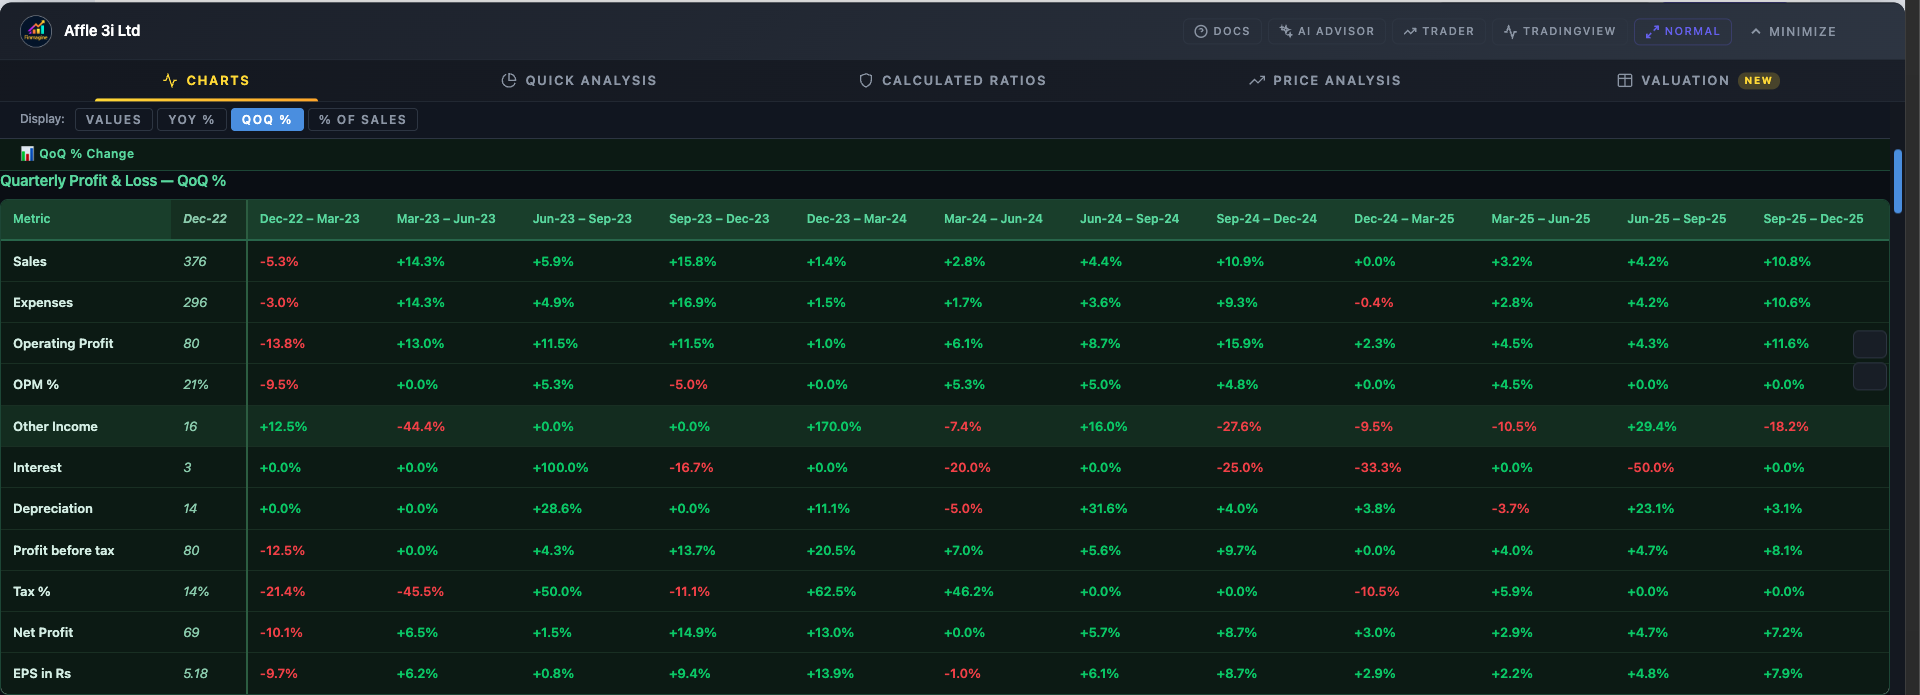
QoQ% Mode — Catching Quarterly Acceleration v2.6.0
While YoY% is ideal for annual trend analysis, QoQ% is the pulse monitor. It measures how each quarter performed relative to the immediately preceding quarter — not the same quarter a year ago. This distinction matters enormously: QoQ% captures momentum as it builds in real time, quarter by quarter.
This mode is most valuable on quarterly P&L tables, where you have 12–20 data points per metric. The extension calculates each cell as:
QoQ% = (Current Quarter Value − Previous Quarter Value) / |Previous Quarter Value| × 100Note: The denominator uses the absolute value to handle sign changes (e.g., a loss turning to profit). The first quarter in the dataset shows “—” as there is no prior period.
| Metric (QoQ%) | Jun 23 | Sep 23 | Dec 23 | Mar 24 | Jun 24 |
|---|---|---|---|---|---|
| Sales ⬆ Accelerating | +4.1% | +3.2% | +6.8% | +8.4% | +11.2% |
| Operating Profit ⬇ Decelerating | +12.3% | +9.6% | +7.1% | +4.8% | +2.2% |
| Net Profit → Stable | +5.4% | -1.2% | +3.8% | +4.1% | +3.9% |
Each metric row shows a badge indicating its most recent momentum trend based on the last three QoQ values
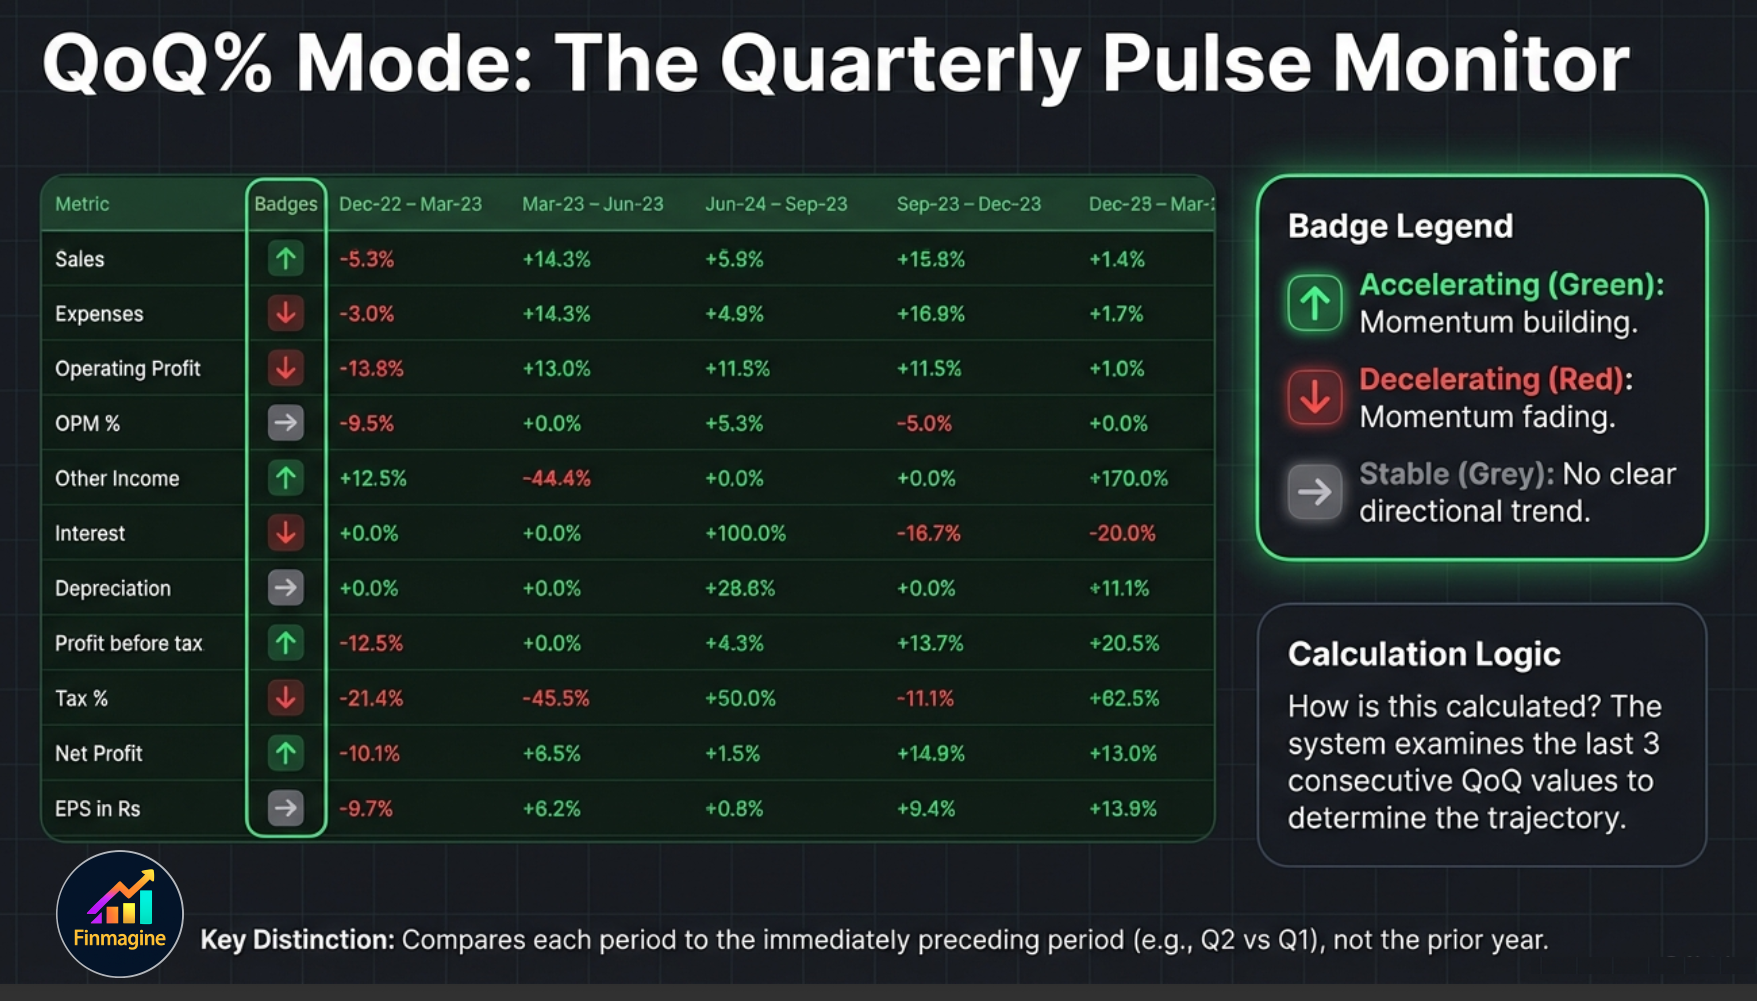
Acceleration Badges: ⬆ Accelerating / ⬇ Decelerating / → Stable
The most powerful feature of QoQ% mode is the automatic acceleration badge appended to each metric row label. The badge summarizes the direction of momentum — not just whether growth is positive, but whether it is speeding up, slowing down, or holding steady.
How Badges are Computed
The extension examines the last three consecutive QoQ values for each metric. Specifically:
- Take the three most recent QoQ% changes: Q(n), Q(n-1), Q(n-2)
- Compare the most recent value against the older two
- Assign the badge based on the overall direction of change
| Badge | Color | Condition | Reading |
|---|---|---|---|
| ⬆ Accelerating | Green | Recent QoQ values trending higher over last 3 periods | Momentum is building — early positive signal |
| ⬇ Decelerating | Red | Recent QoQ values trending lower over last 3 periods | Momentum is fading — watch carefully |
| → Stable | Grey | No clear trend in last 3 QoQ values | Consistent growth; no major directional shift |
When Acceleration Badges Are Most Useful
- Early recovery detection: A company showing “Decelerating” YoY% but “Accelerating” QoQ% may be in early recovery — the quarterly trend is improving before the annual comparisons show it.
- Earnings preview: If the last two quarters show Accelerating badges for Net Profit, the upcoming quarterly result may surprise positively.
- Sector comparison: Use QoQ% with acceleration badges to quickly compare which companies in a sector are gaining momentum vs losing it, without digging through numbers.
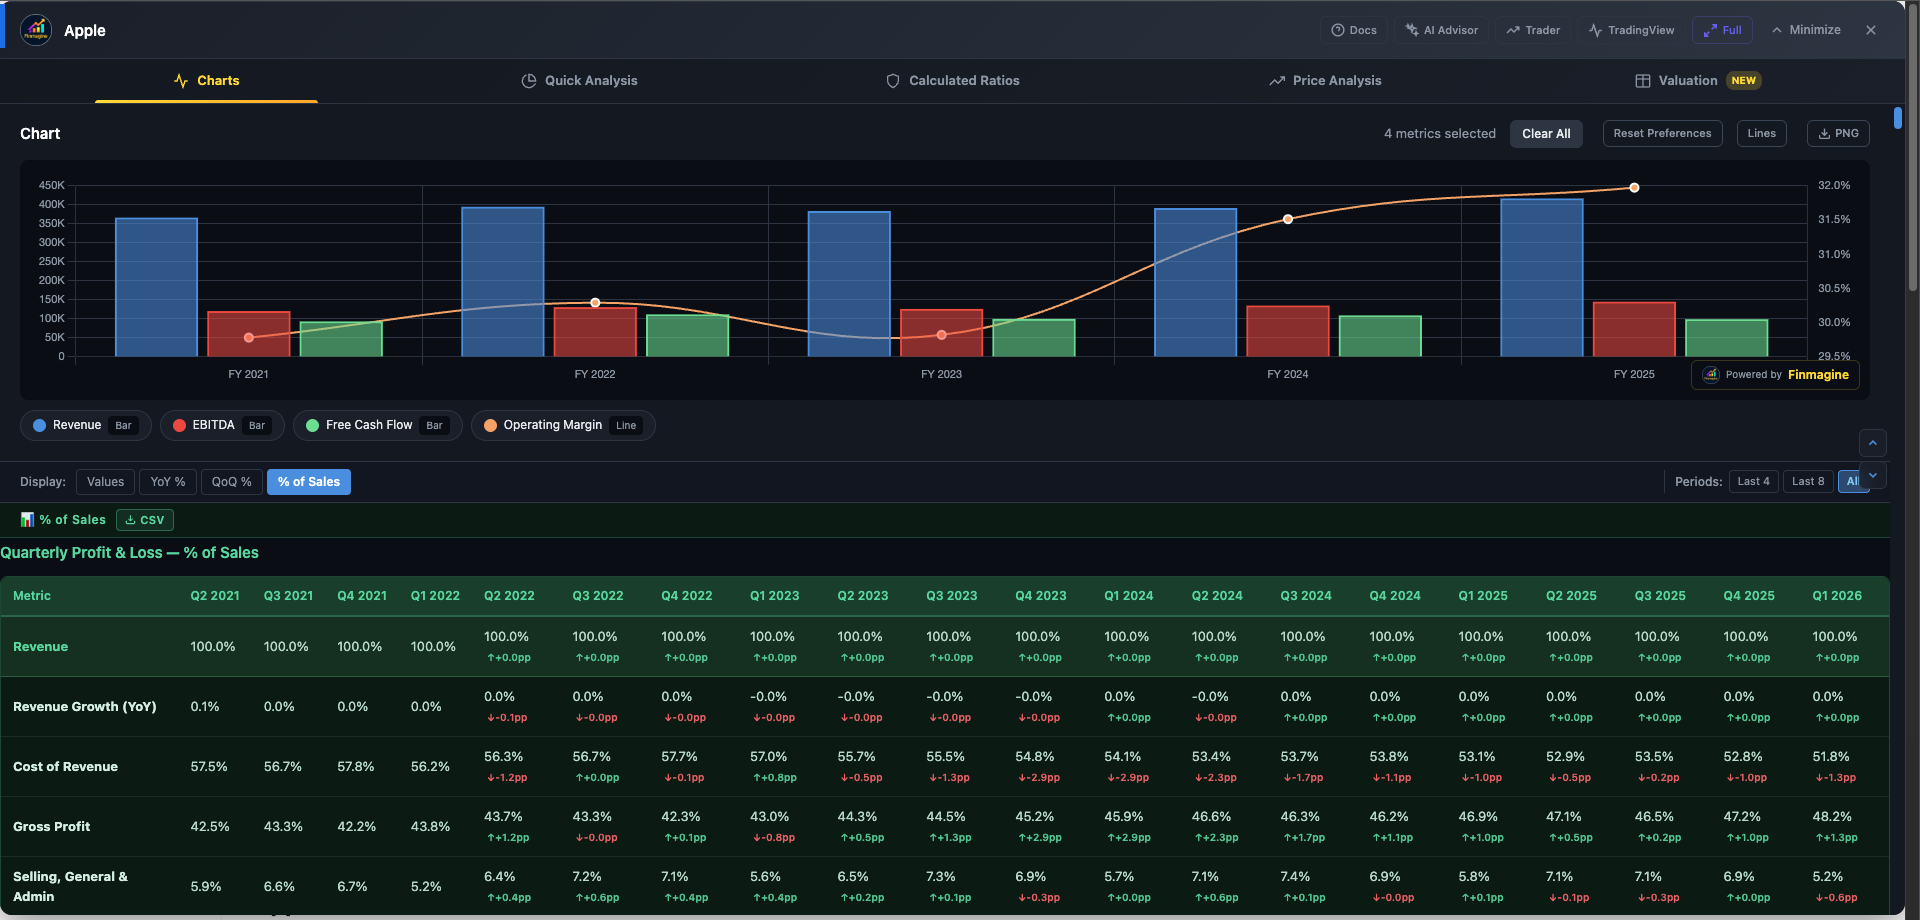
% of Sales Mode — The Margin Telescope v2.6.0
When you look at a company's P&L, every line below "Sales" is ultimately a fraction of that top line. Raw material costs, employee expenses, EBITDA, Net Profit — these numbers only tell part of the story. Their relationship to Sales reveals the structure of the business model: how much of every rupee of revenue becomes profit, how cost-efficient the operations are, and whether margins are structurally expanding or contracting over time.
% of Sales mode divides every cell by the Sales/Revenue value in the same column (same year or quarter), expressing the result as a percentage of the top line.
What % of Sales Reveals
| Metric (% of Sales) | Mar 2020 | Mar 2021 | Mar 2022 | Mar 2023 | Mar 2024 |
|---|---|---|---|---|---|
| Sales | 100.0% | 100.0% | 100.0% | 100.0% | 100.0% |
| Raw Material | 38.4% | 41.2% | 39.8% | 37.1% | 35.9% |
| EBITDA / OPM | 19.2% | 17.3% | 20.1% | 22.4% | 23.6% |
| Net Profit | 8.4% | 7.1% | 9.2% | 11.8% | 12.9% |
Sales always = 100.0%. All other rows are proportional. Raw Material declining from 38.4% to 35.9% = direct margin improvement.
From this table, the narrative is clear: Raw Material costs as % of Sales have been falling consistently (from 38.4% to 35.9%), EBITDA margins have expanded from 19.2% to 23.6%, and Net Profit margin has grown from 8.4% to 12.9%. Without % of Sales mode, deriving this from raw numbers alone would require years of calculations.
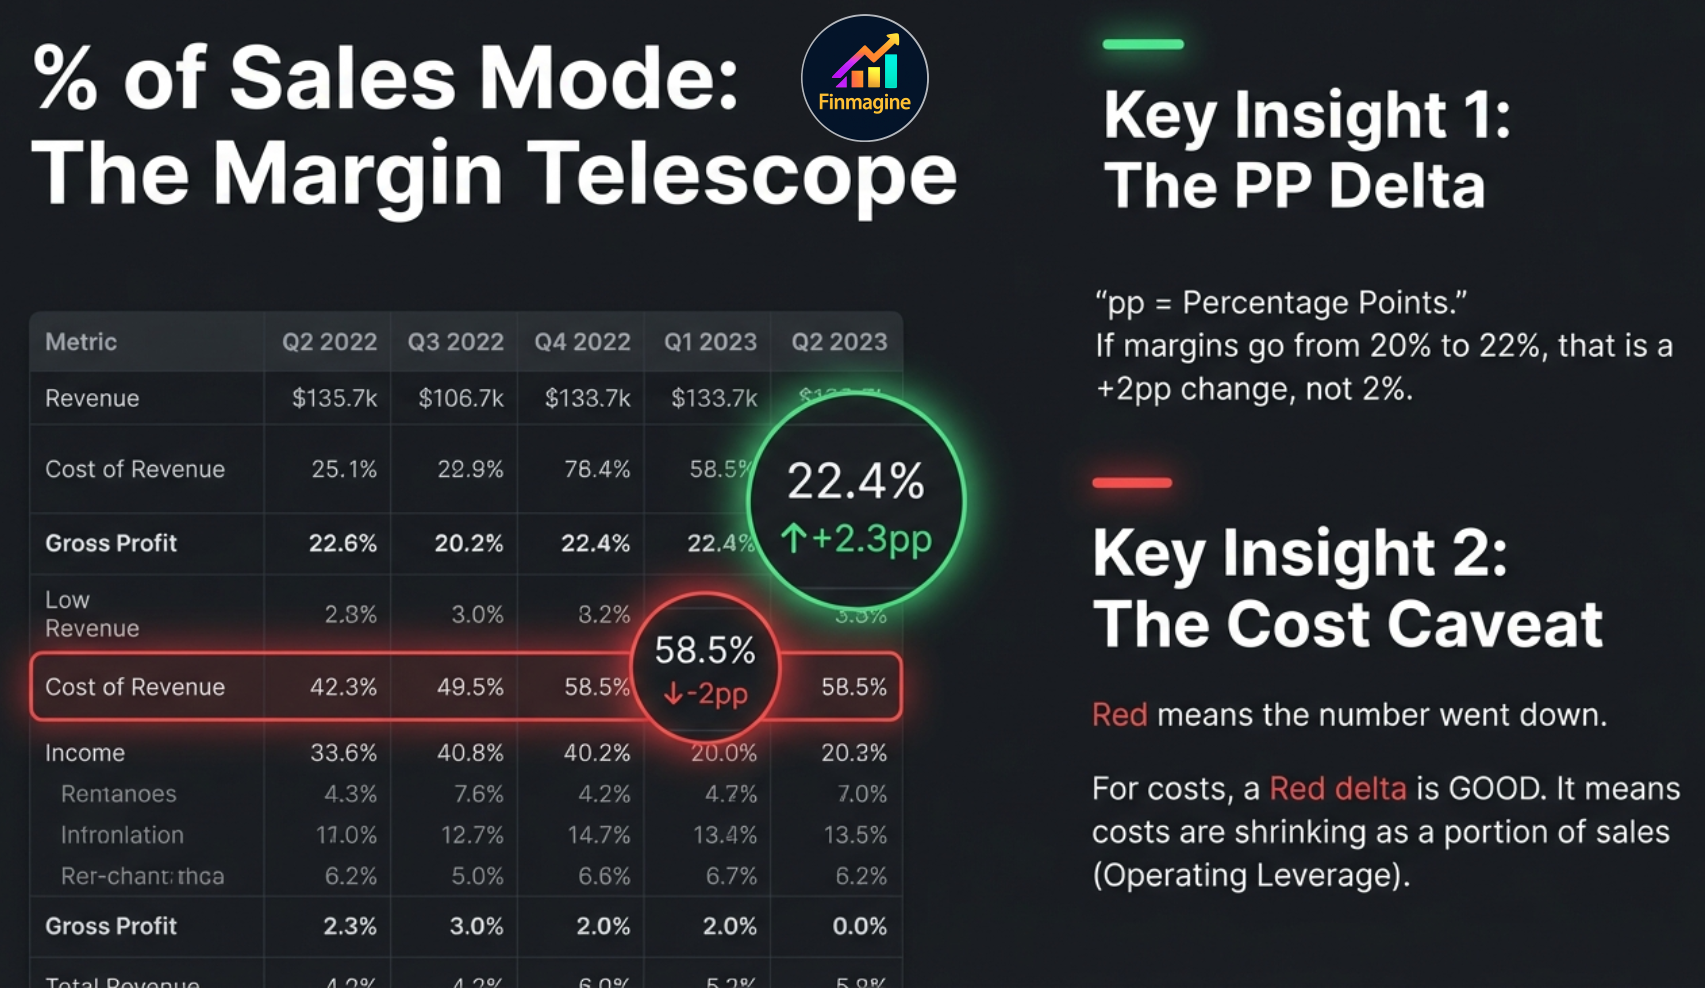
The YoY Percentage Point Delta
The most powerful feature within % of Sales mode is the YoY percentage point (pp) delta. Every cell in the view table shows not just the current % of Sales value, but also how it has changed vs the prior year in percentage points.
The cell format is:
23.4% ↑+1.2pp
or
18.6% ↓-0.8pp
This distinction is critical and often misunderstood. If OPM was 20% last year and is 22% this year, it increased by 2 percentage points — not by 2%. The percentage increase would be 10% (2/20 × 100). These are different measurements. The pp (percentage point) notation is the correct way to express the difference between two percentages. ↑+2pp means the margin rate itself went up by 2 percentage points — from 20% to 22%, or from 15% to 17%, or from any level by exactly 2 units.
Color Coding of the Delta
| Delta | Color | Meaning | Example |
|---|---|---|---|
| ↑+Xpp | Green | Margin expansion — this row grew faster than Sales | EBITDA: 22.4% ↑+2.3pp |
| ↓-Xpp | Red | Margin contraction — this row grew slower than Sales | Raw Mat: 35.9% ↓-1.2pp (costs fell faster = good) |
Quarterly % of Sales Delta Logic
In quarterly % of Sales mode, the delta compares the current quarter's % of Sales to the same quarter one year ago (4 quarters back), not to the immediately preceding quarter. This eliminates seasonal distortions:
↑+1.8pp — comparing June quarter to June quarter, not March quarter to June quarter (which would be meaningless seasonally).
Reading the Margin Structure
The % of Sales view is particularly effective for answering:
- Is operating leverage real? If Revenue is growing and EBITDA as % of Sales is also rising, yes — fixed costs are getting leveraged.
- Where are costs compressing or expanding? Scan every cost row for the delta sign — rising cost percentages need an explanation.
- Is the bottom line improving faster than the top line? If Net Profit as % of Sales is rising while raw material costs are falling, the company is keeping the gains.
- Structural vs cyclical margin improvement: A consistent multi-year trend of rising EBITDA % is structural. A single year of improvement may be cyclical (commodity tailwind, one-time cost cut).
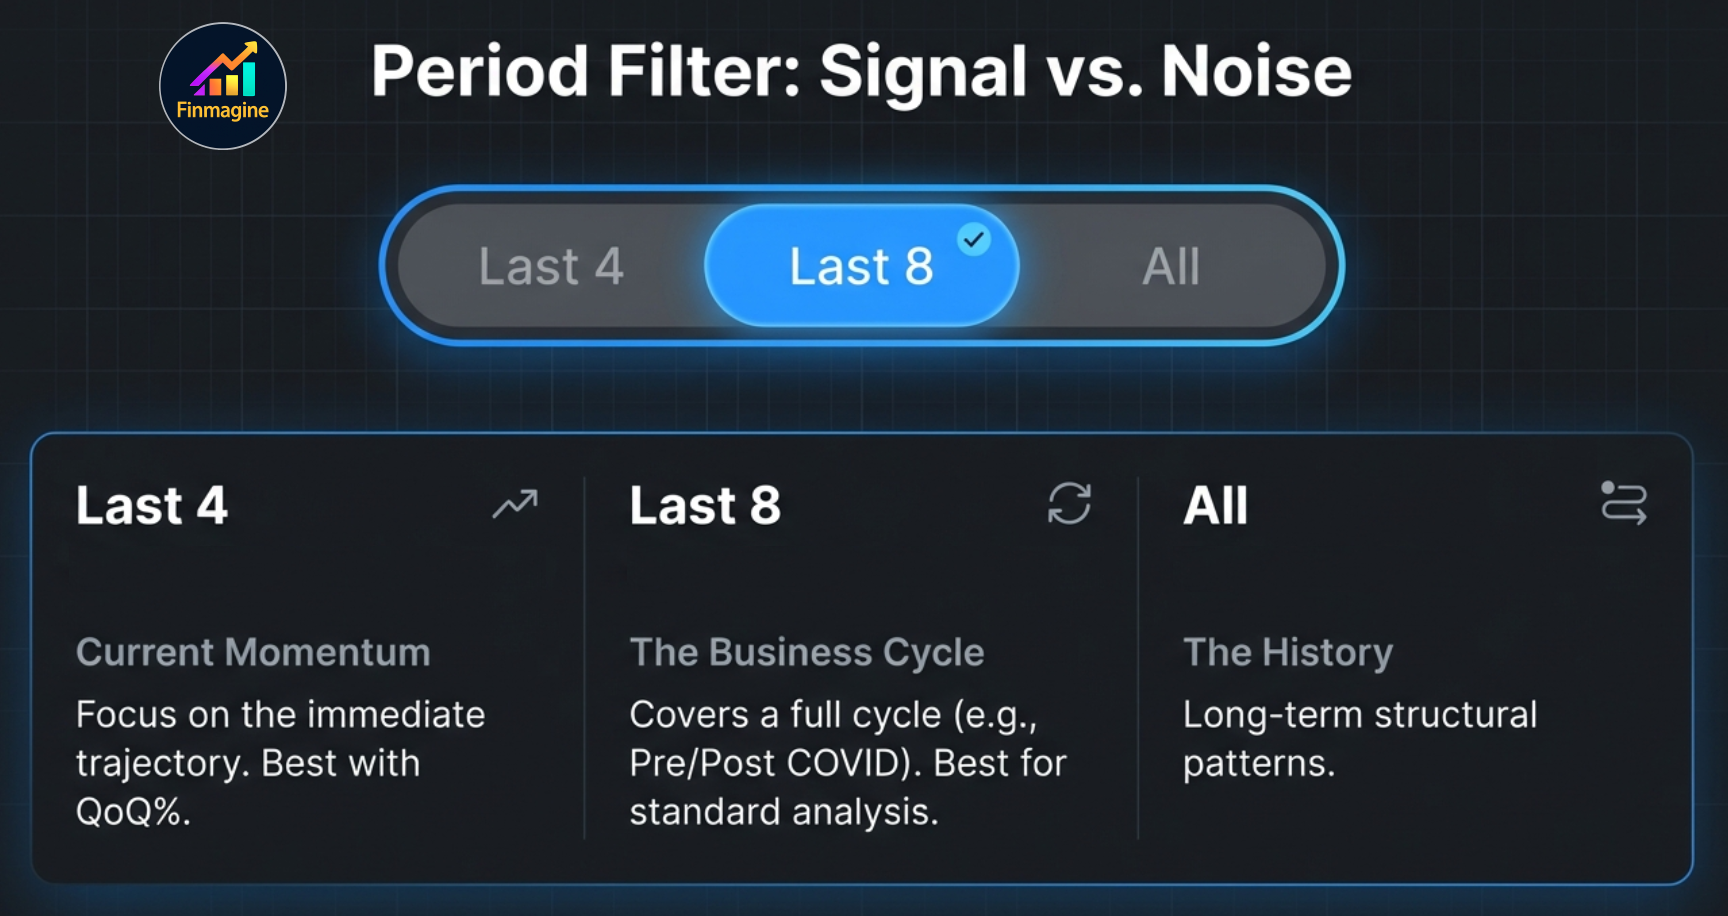
Period Filter — Zoom In or Out v2.6.0
The Period Filter works alongside Display Modes (or independently in Values mode) to control how many years or quarters of data are shown in the view table. It sits adjacent to the mode toggle buttons in the panel header.

| Filter | Shows | Best For |
|---|---|---|
| All | Complete dataset (typically 10+ years annual, 16+ quarters) | Long-term structural patterns, full cycle analysis |
| Last 8 | Most recent 8 years / 8 quarters | Medium-term trends covering a full business cycle; pre/post COVID comparison |
| Last 4 | Most recent 4 years / 4 quarters | Recent momentum only; tight focus on current trajectory |
Period Filter with Display Modes
The period filter and display mode work independently — you can combine any filter with any mode. Common combinations:
- Last 8 + YoY%: An eight-year growth trend — removes the "noise" of the company's early years while still covering a full cycle
- Last 8 + % of Sales: Eight years of margin structure — enough to see operating leverage build and test across different market conditions
- Last 4 + QoQ%: Tight quarterly momentum view — the last 4 quarters with acceleration badges to assess current trajectory
- All + YoY%: Full growth history — ideal for understanding business cycles and identifying long-run growth rates
The period filter also applies to the charting tables. When combined with a Display Mode, charts are redrawn with only the selected number of data points — making trend lines cleaner and easier to read without the full historical dataset competing for visual attention.
CSV Export — Data Beyond the Browser v2.6.0
Every Display Mode view can be exported to CSV with a single click. The Export CSV button appears in the panel header when any non-Values mode is active (or can export the current period-filtered Values view as well). The exported file captures exactly what you see in the dark-green view table.
What Gets Exported
| Export Context | What the CSV Contains |
|---|---|
| YoY% mode | Metric names in column A, percentage growth values for each year/quarter across columns B onwards |
| QoQ% mode | Same structure; QoQ% values per quarter with acceleration badge text in a separate column |
| % of Sales mode | % of Sales ratios plus the YoY pp delta for each cell as separate columns or combined cell values |
| Period filter applied | Only the filtered columns are exported (e.g., "Last 8" exports 8 years/quarters, not the full dataset) |
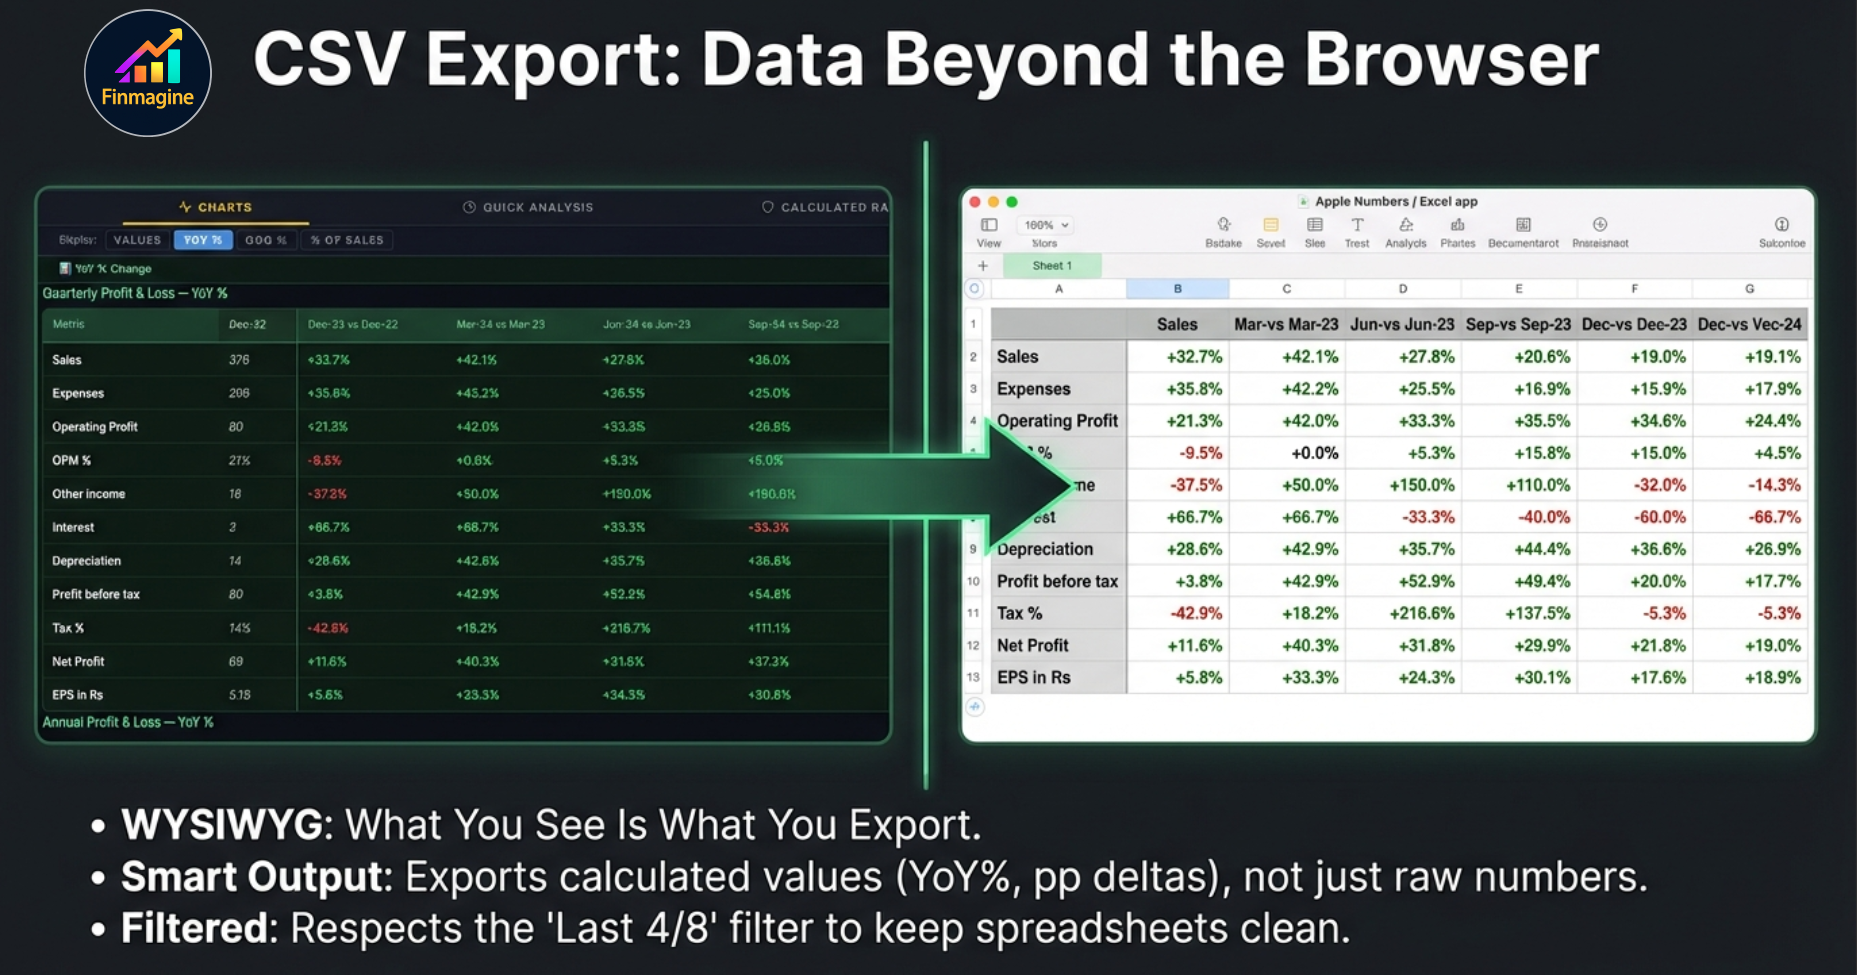
Use Cases for CSV Export
- Offline comparison: Export YoY% for 5 companies in the same sector, paste them side by side in Excel/Sheets to compare growth trajectories
- Investment notes: Export % of Sales data to document the margin structure at the time of investment decision, for review at future results
- Peer analysis: Build a sector dashboard by exporting the same metrics (e.g., EBITDA margin, Net Profit margin as % of Sales) from multiple companies
- Teaching tool: Export YoY% data for classroom or blog use without needing to compute it manually
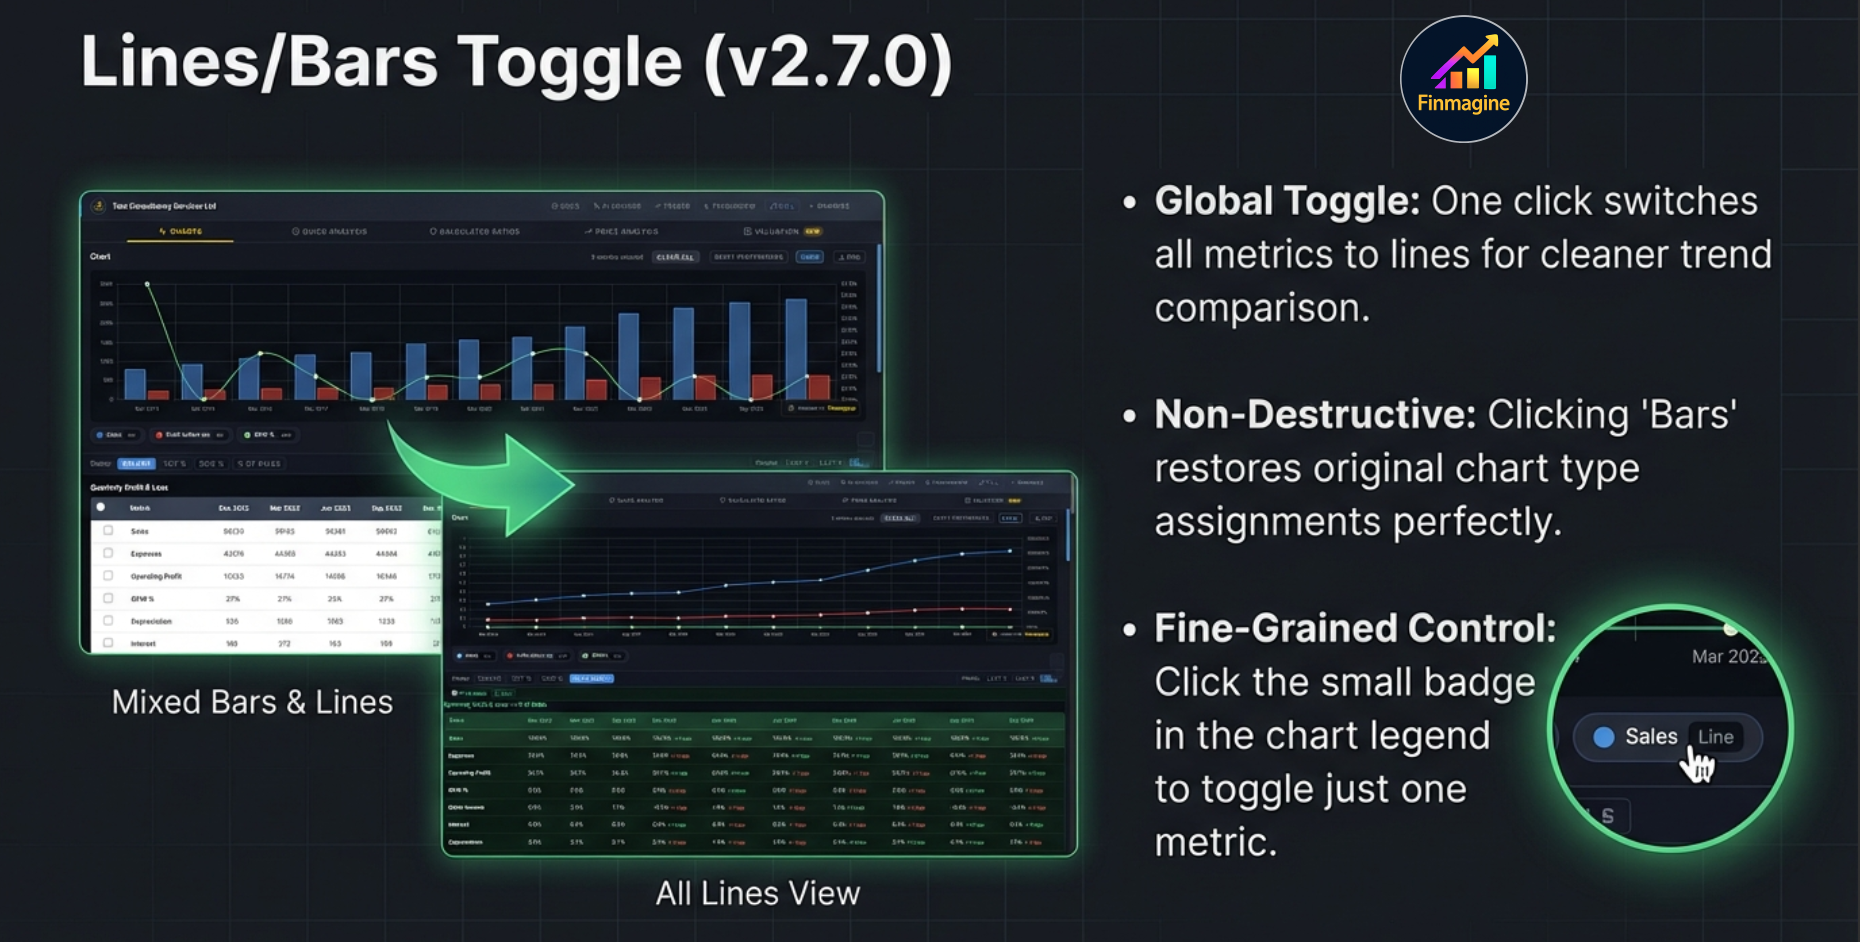
Lines/Bars Toggle — Chart Type Freedom
By default, the Charts tab assigns chart types intelligently: absolute values (Revenue, Net Profit, EBITDA) become bar charts on the left Y-axis; percentages and ratios (OPM%, ROE%, ROCE%) become line charts on the right Y-axis. This gives you a clear visual separation — bars for scale, lines for trend.
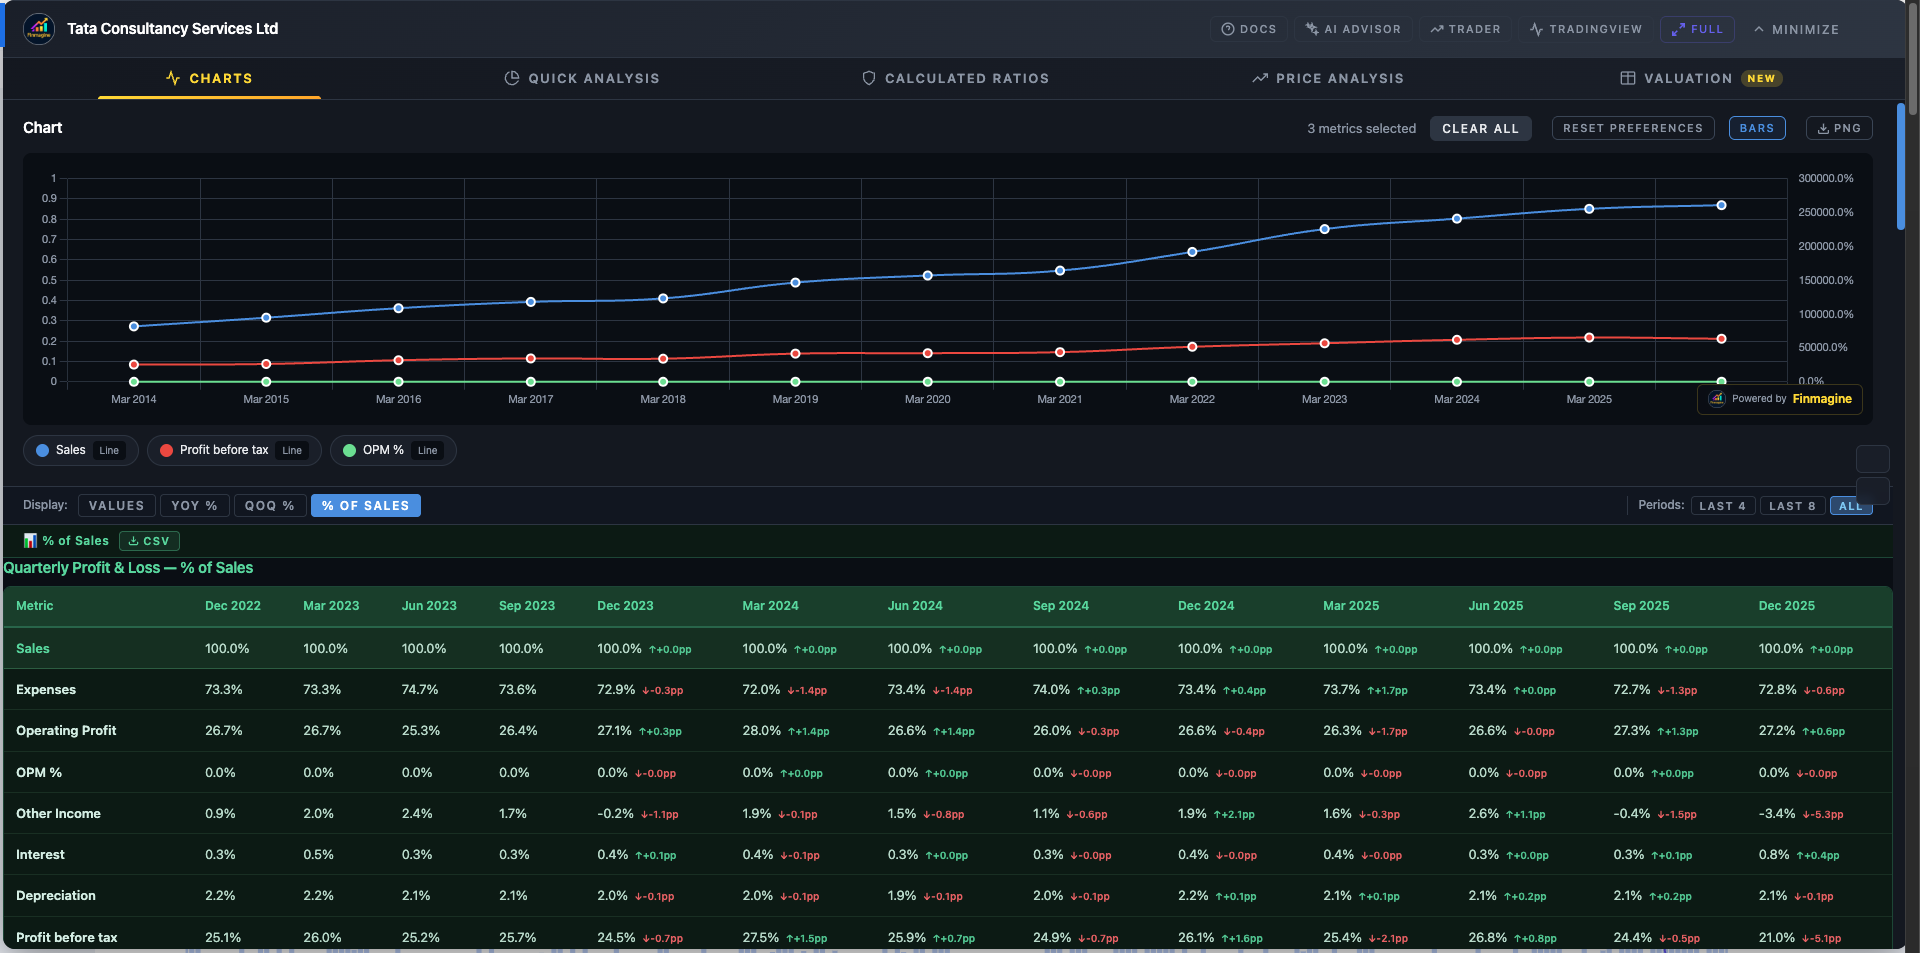
But preferences vary. Some analysts prefer an all-line view — cleaner trend lines without the visual weight of bars. The Lines/Bars toggle respects that preference.
The Lines Button
The button appears in the panel's chart action row alongside the existing Reset and Clear controls:
Default state (bar charts active):
LinesActive state (all charts are lines):
| Button State | Label | What it Means | Click Action |
|---|---|---|---|
| Default | Lines | Charts are in their default mixed bar/line format | Click to switch ALL charts to line format |
| Active (blue border) | All charts are currently showing as lines | Click to restore the default mixed bar/line format |
When to Use All-Lines Mode
- Trend comparison: When you want to compare the trajectory of Revenue, EBITDA, and Net Profit as trend lines on the same scale, without bars competing for visual space
- Presentation mode: Line-only charts screenshot more cleanly for shared analysis or blog posts
- Multiple metrics in a tight view: With 5–7 metrics selected, bars can overlap and obscure each other. Lines give each metric clear visual separation
- Long time series: With 15+ annual periods, bars become narrow and hard to read. Lines communicate the trend more clearly
When to Keep Bars
- Sizing the business: When absolute scale matters (visualizing revenue in Cr, not just trend direction), bars communicate magnitude better
- Bar + Line dual-axis: The default mixed view is purpose-built for combining absolute values (bars/left axis) with ratios (lines/right axis) — this is the classic revenue-with-margins chart and is most readable in its default mixed form
- Teaching and explanation: When explaining how a metric grew from one year to the next, bars are more intuitive for audiences unfamiliar with charts
Per-Metric Chart Type Toggle — Fine-Grained Control v2.7.0
The global Lines/Bars toggle handles all metrics at once. But sometimes you want only one metric to switch type — for example, showing Revenue as a line while keeping Net Profit and OPM% in their original formats. The per-metric toggle gives you exactly that control.
How to Toggle a Single Metric
Look at the chart legend below the chart. Each metric entry shows three elements:
- A colored square (the metric color)
- The metric name (click to toggle visibility)
- A small type badge showing the current chart type:
BarorLine
Click the Bar or Line type badge for any metric to flip just that metric between bar and line format. The badge updates to reflect the new type, and the chart redraws immediately.
| Target | Click Location | Action |
|---|---|---|
| All metrics at once | Lines button in panel header | Global toggle: all → lines, or all → restored defaults |
| Single metric | Type badge in legend (Bar/Line label) | Flips only that metric; exits global lines mode |
| Metric visibility | Metric name or color square in legend | Hides/shows metric (does NOT affect chart type) |
Common Per-Metric Use Cases
- OPM% already a line, Revenue needs to be a line too: Click Revenue's "Bar" badge → Revenue becomes a line. Both Revenue and OPM% now show as clean trend lines for a trajectory comparison.
- All lines active, one metric needs to stay as a bar: Activate Lines mode globally, then click the "Line" badge on that specific metric → it reverts to Bar while others remain as lines.
- Building a custom mixed view: Start with defaults, selectively toggle individual metrics until the chart layout is exactly right for your specific analytical question.
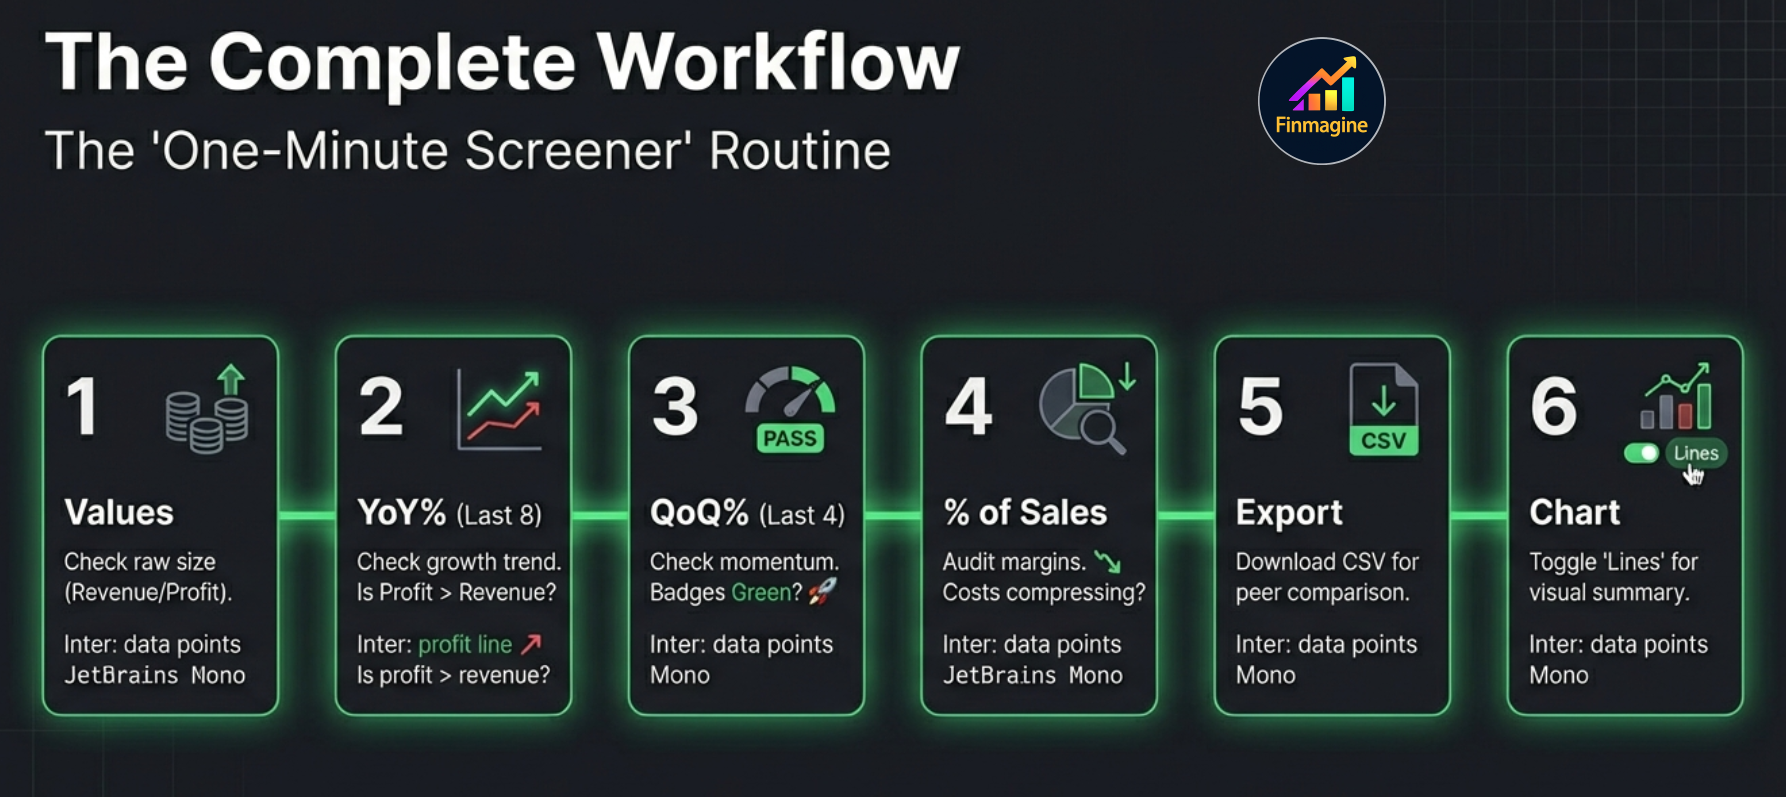
The Complete Workflow — All Modes, One Company
These features are not independent tools — they form a sequential analytical workflow. Here is how to use them together when analyzing a new company on Screener.in:
Start in Values Mode, Select Metrics for Charting
Open the Charts tab. In the default Values mode, select your key metrics: Revenue, EBITDA, Net Profit, OPM%, ROCE%. These will build your base chart showing the business in its raw form. This is your reference view — the ground truth before any transformation.
Switch to YoY% to Assess Growth Trajectory
Click YoY%. The view table transforms instantly. Scan for: consistent green (sustained growth), inflection points (rows transitioning from red/grey to green or vice versa), and whether Profit YoY% is running ahead of or behind Revenue YoY%. Use Last 8 period filter to focus on the recent cycle.
Switch to QoQ% for Quarterly Momentum (if applicable)
If you are on the Quarterly P&L section, click QoQ%. Check the acceleration badges for Revenue and Net Profit. ⬆ Accelerating on both is a strong confirmation that the YoY trend you saw is building rather than peaking. Apply Last 4 filter to see just the freshest momentum signal.
Switch to % of Sales to Audit Margin Structure
Click % of Sales. Read the EBITDA and Net Profit rows. Are margins expanding (green ↑+Xpp deltas) or compressing (red ↓-Xpp deltas)? Check the cost rows too: are Raw Material costs as % of Sales falling? This tells you whether the company is capturing operating leverage or passing growth gains to suppliers and employees.
Apply Period Filter to Focus on the Investment Horizon
Use Last 8 for standard analysis, Last 4 for a tight current-state check, or All for a full business cycle view. Export the relevant view as CSV if you want to document it or compare with peers in a spreadsheet.
Adjust Chart Types for Clarity
Return to Values mode. If you are presenting the chart or comparing trend lines, click the Lines button to switch to all-line view for a cleaner visual. Or use the per-metric legend badge to fine-tune specific metrics — keeping bars where they convey magnitude, switching to lines where trend direction is what matters.
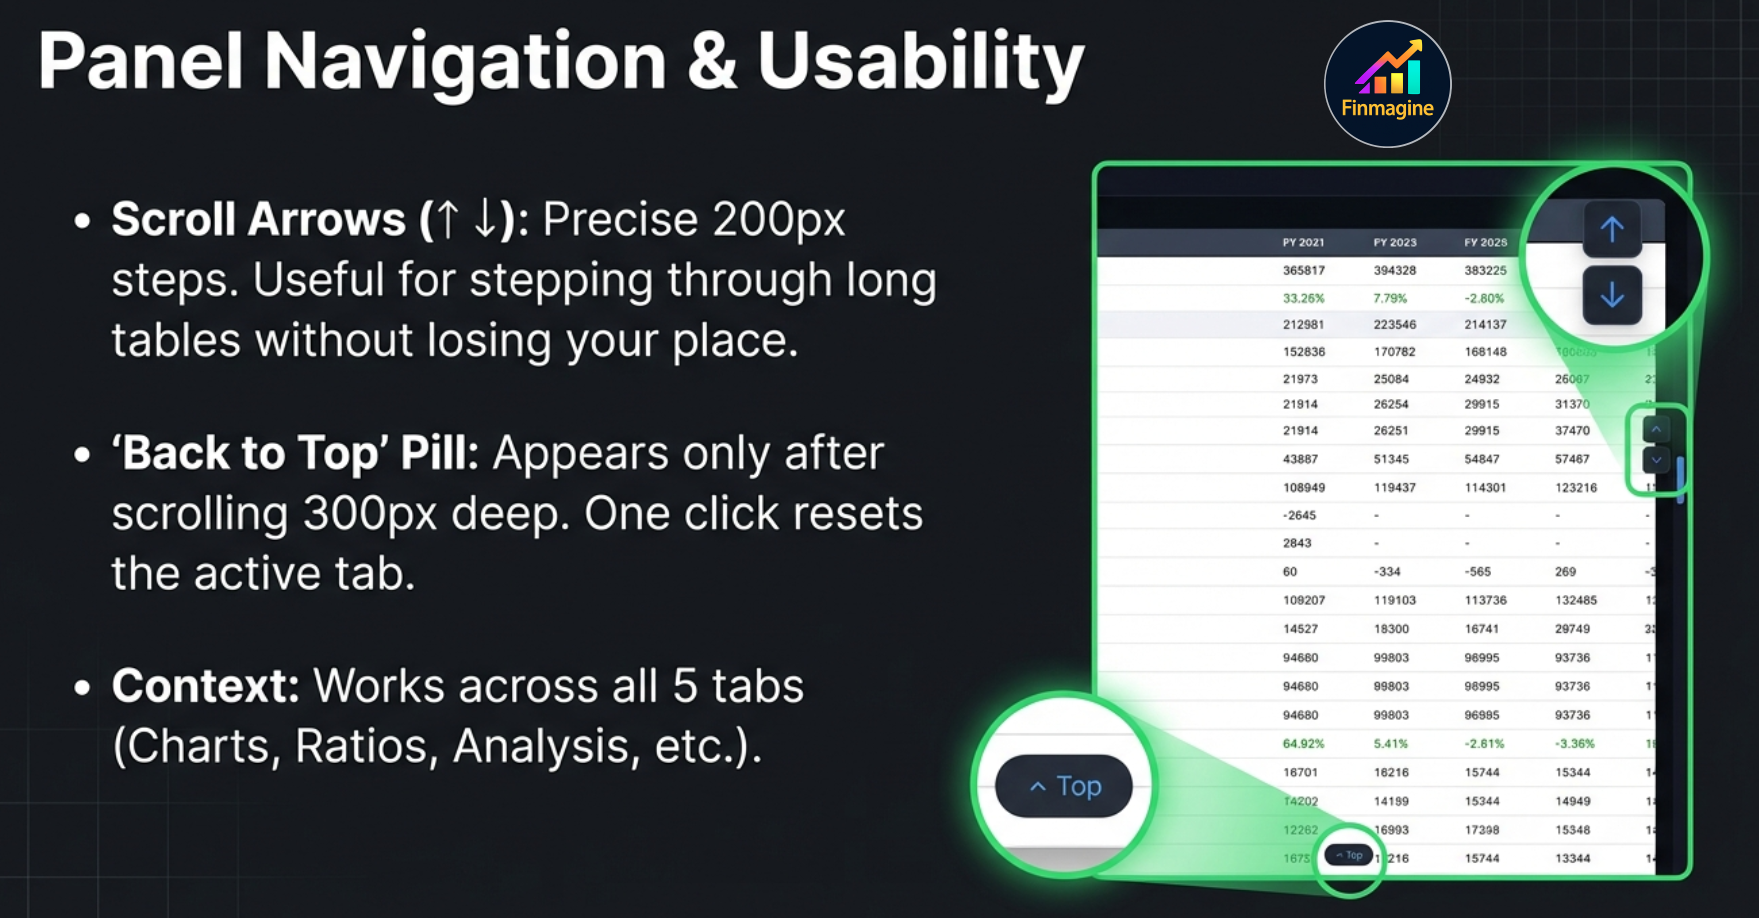
Panel Navigation — Scroll Buttons & Back to Top
As the extension has grown to five tabs with increasingly rich content — Display Mode view tables, metric lists, Quick Analysis scores, DuPont decompositions — navigating within the panel on a single screen became cumbersome. v2.7.0 adds two dedicated navigation controls to solve this.
↑ / ↓ Scroll Buttons
Two arrow buttons are permanently visible on the right edge of the panel body. Each click scrolls the active tab's content by 200px — up or down — with smooth animation. This is useful when you want to nudge through a long metrics list or step through a Display Mode view table without losing your place.
| Button | Action | Best For |
|---|---|---|
| ↑ (Up arrow) | Scrolls active tab content up 200px | Stepping back up through a long metric list or view table |
| ↓ (Down arrow) | Scrolls active tab content down 200px | Advancing through a long section without losing position |
Back to Top Button
A floating "↑ Top" pill button appears in the bottom corner of the panel once you have scrolled more than 300px within any tab. Click it to instantly jump back to the top of that tab's content with a smooth scroll.
It is context-aware: the Back to Top button tracks whichever tab is active and scrolls that tab's container back to position zero — not the browser page, and not a different tab. Switch tabs and the button's visibility resets based on the scroll position of the new active tab.
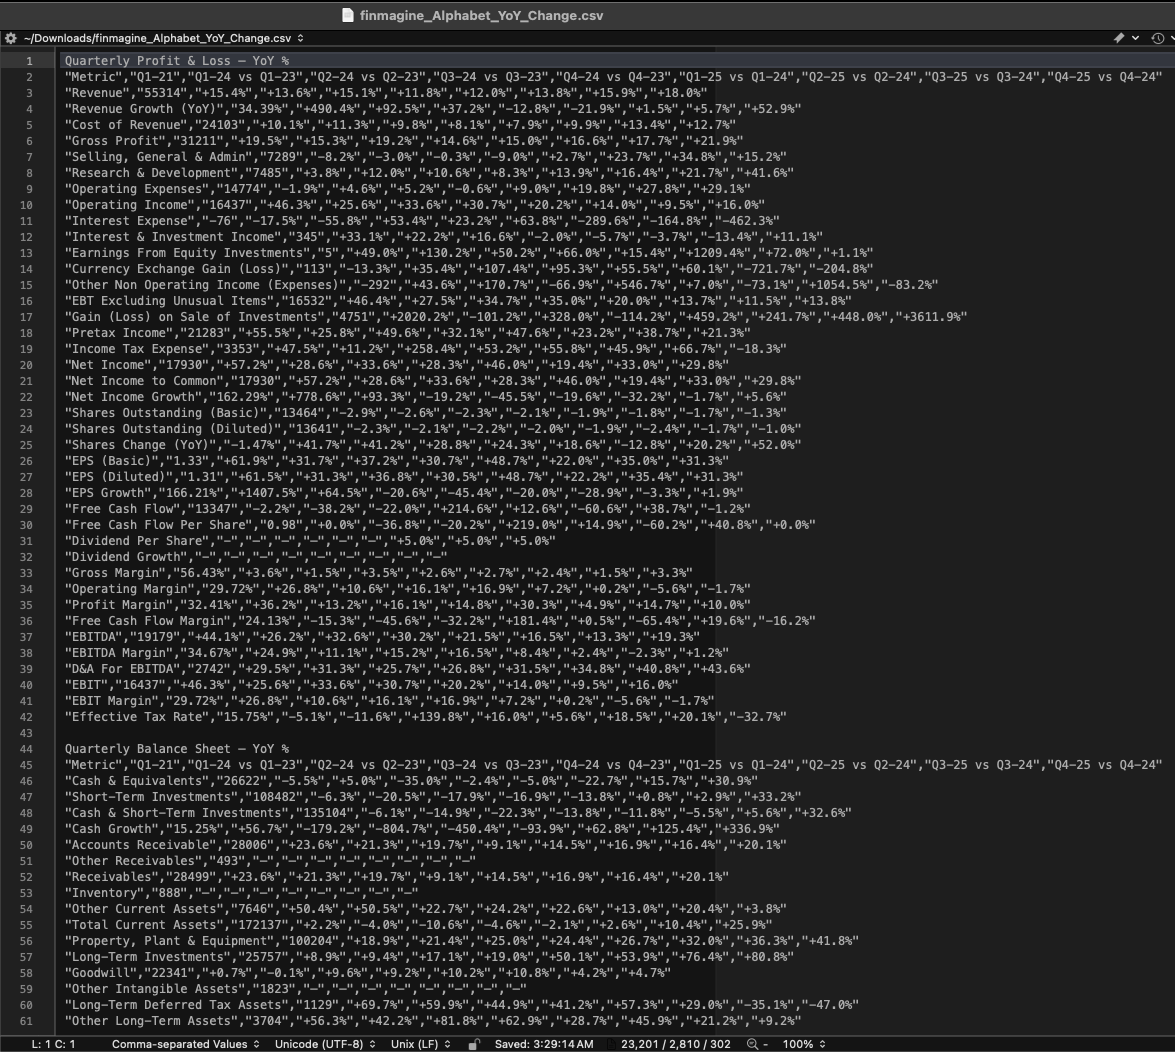
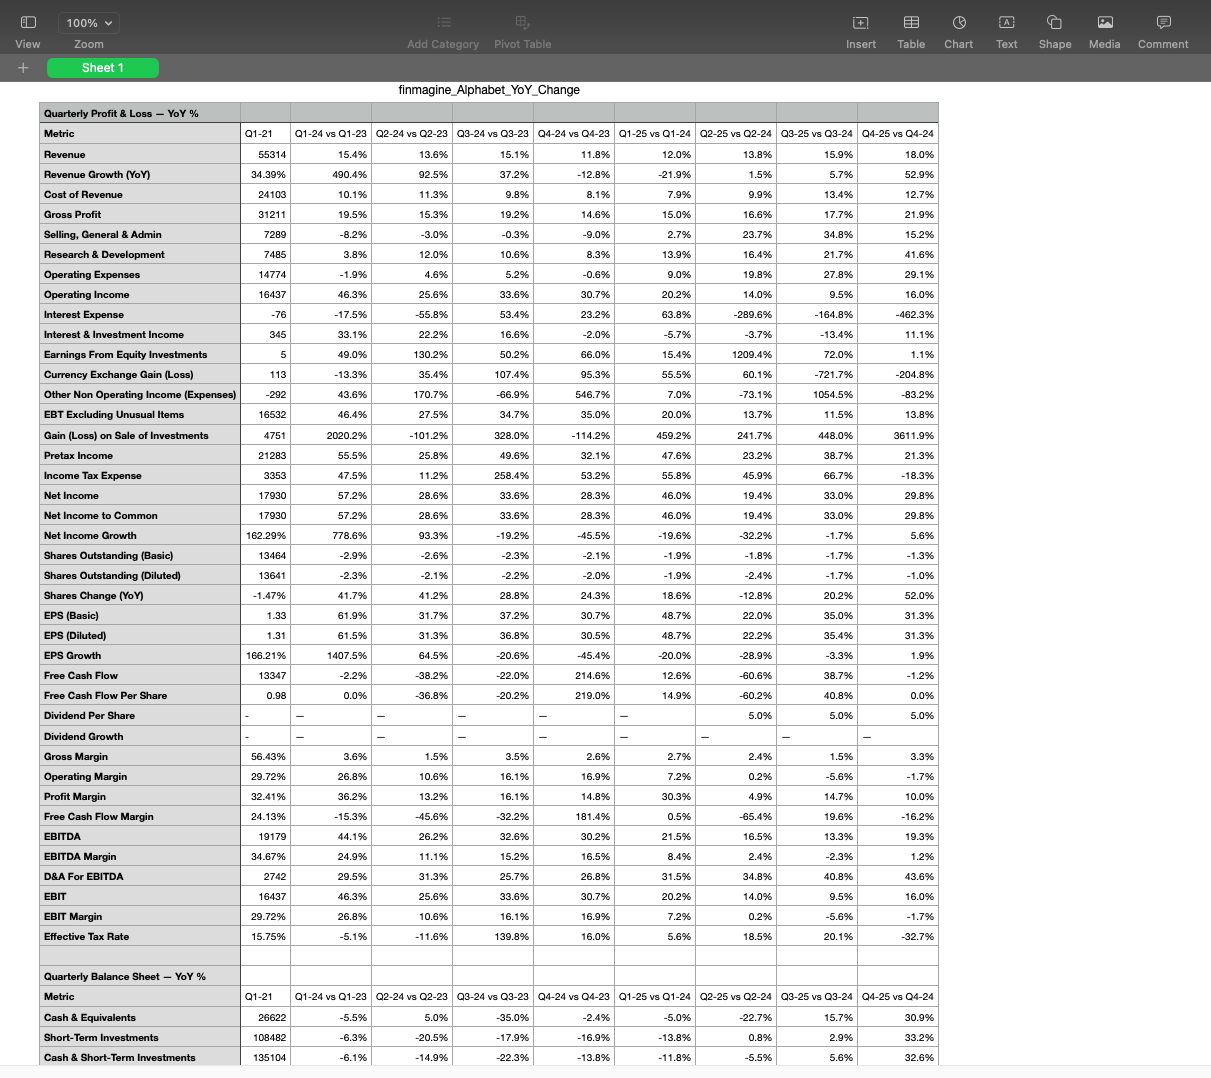
Live Case Study — Alphabet Inc. (GOOGL) Step-by-Step
Abstract concepts are best understood with real data. The following walkthrough uses Alphabet Inc. (GOOGL) — one of the most data-rich companies available on stockanalysis.com — to demonstrate the full analytical hierarchy in practice. This is the same stock used in the video walkthrough and the Deep Dive audio above.
Company: Alphabet Inc. (GOOGL) — Quarterly P&L
Data source: stockanalysis.com | Mode used: All four Display Modes in sequence
All figures are from the YoY% export shown in the screenshots above. Quarters shown: Q1-24 vs Q1-23 through Q4-25 vs Q4-24.
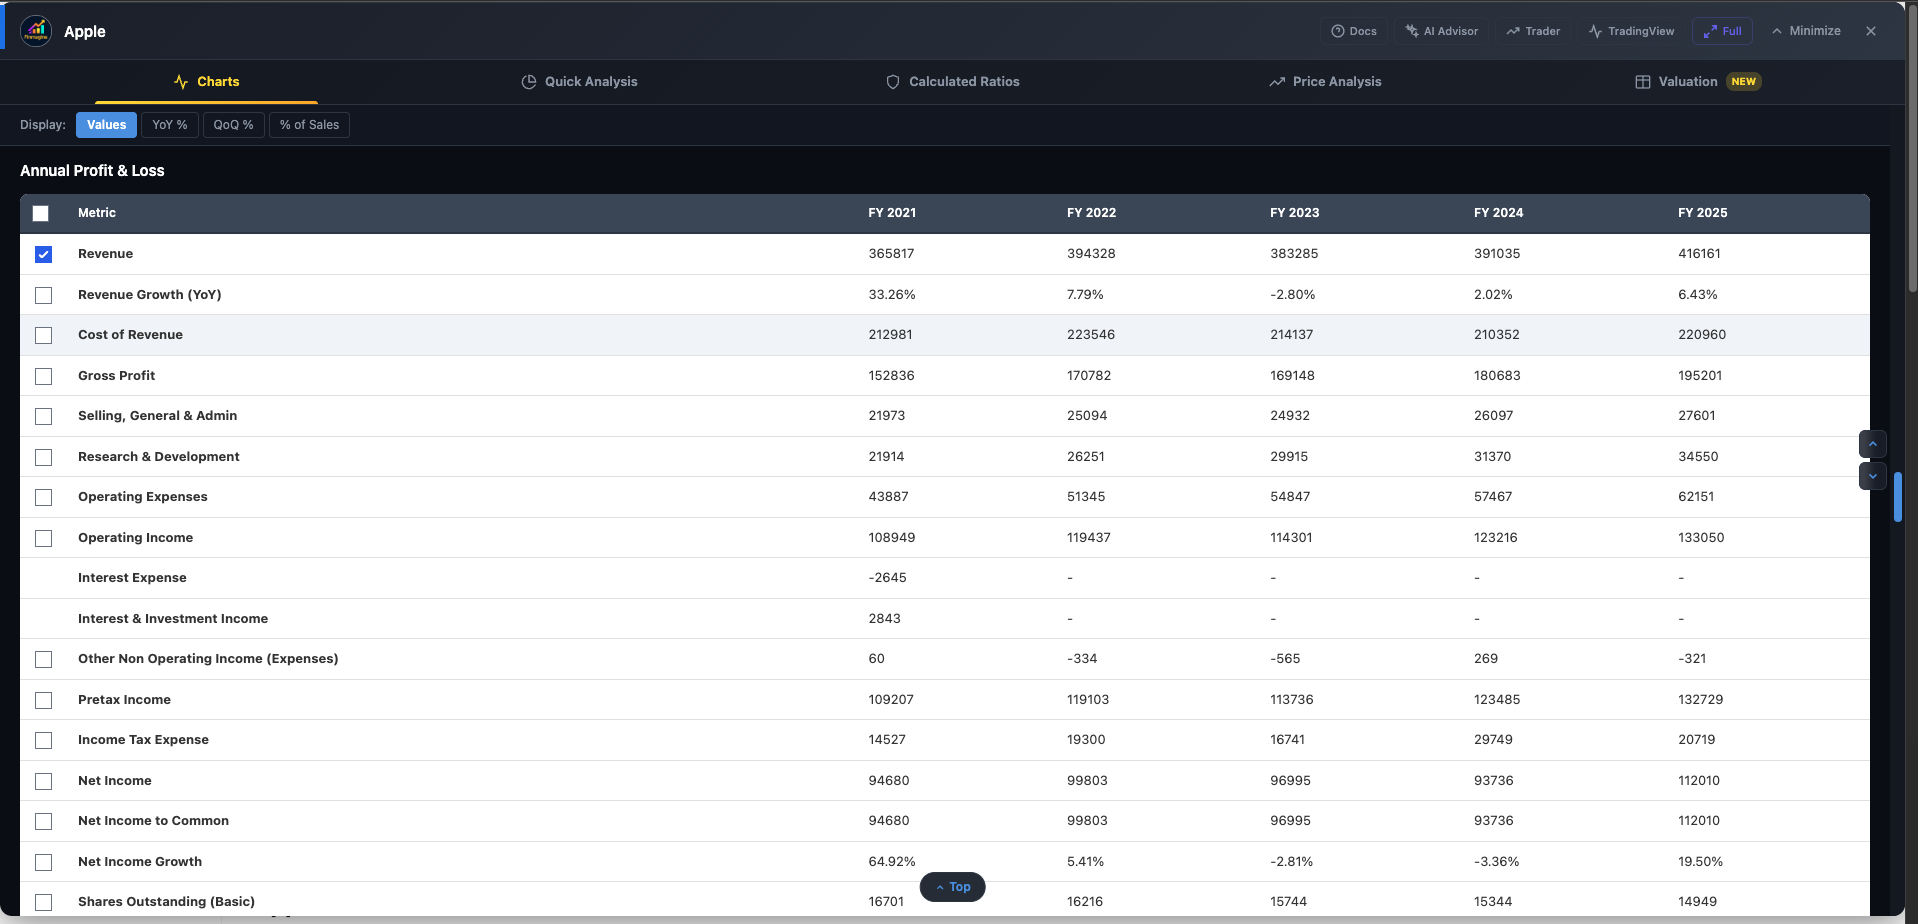
Step 1 — Values: Anchor to Scale
Before any analysis, establish what you are dealing with. GOOGL’s Q1-21 quarterly revenue was $55,314M. That single number tells you this is a mega-cap technology company. You set your mental frame: this is not a company that grows 50% per year. Single-digit to mid-teen growth at this scale is actually impressive. This context — sizing the business — is what Values mode is for.
Step 2 — YoY%: Spot the Growth Inflection
Switch to YoY%. The numbers are now growth rates. Here is what the quarterly P&L shows:
| Metric (YoY%) | Q1-24 | Q2-24 | Q3-24 | Q4-24 | Q1-25 | Q2-25 | Q3-25 | Q4-25 |
|---|---|---|---|---|---|---|---|---|
| Revenue | +15.4% | +13.6% | +15.1% | +11.8% | +12.0% | +13.8% | +15.9% | +18.0% |
| Cost of Revenue | +10.1% | +11.3% | +9.8% | +8.1% | +7.9% | +9.9% | +13.4% | +12.7% |
| Gross Profit | +19.5% | +15.3% | +19.2% | +14.6% | +15.0% | +16.6% | +17.7% | +21.9% |
| Operating Income | +46.3% | +25.6% | +33.6% | +30.7% | +20.2% | +14.0% | +9.5% | +16.0% |
| Net Income | +57.2% | +28.6% | +33.6% | +28.3% | +46.0% | +19.4% | +33.0% | +29.8% |
GOOGL Quarterly P&L — YoY% from stockanalysis.com
The YoY% view tells a very clear story in seconds:
- Revenue is re-accelerating. After dipping to +11.8% (Q4-24) and +12.0% (Q1-25), growth has climbed back to +13.8%, +15.9%, and +18.0% in recent quarters. The inflection point is visible — no calculation needed.
- Cost of Revenue is growing slower than Revenue. Every quarter: Revenue +12-18%, Cost of Revenue +8-13%. Gross Profit consistently grows faster than Revenue. This is operating leverage at the top of the P&L.
- Operating Income and Net Income grow much faster than Revenue. Revenue at +12%, Operating Income at +14-46%, Net Income at +19-57%. The profit lines are consistently darker green and showing higher numbers than the revenue line — a healthy, leveraged business.
Step 3 — QoQ%: Check the Quarterly Pulse
On the quarterly P&L section, switch to QoQ% with Last 4 filter active. This strips the view to the most recent four quarters and shows acceleration badges for each metric. For GOOGL, you would expect to see Revenue with an ⬆ Accelerating badge (revenue growth rate has been climbing), while Operating Expenses may show a ⬇ Decelerating badge (SG&A was actually declining YoY in several quarters: -8.2%, -3.0%, -9.0%).
The QoQ% mode confirms the YoY trend is not just annual averaging — the momentum is present quarter by quarter. This matters especially for investor timing: the accelerating revenue signal is visible in QoQ% before it shows up clearly in annual comparisons.
Step 4 — % of Sales: Audit the Margin Structure
Switch to % of Sales. The Gross Margin row across these quarters shows positive YoY pp deltas: ↑+3.6pp, ↑+1.5pp, ↑+3.5pp, ↑+2.6pp, ↑+2.7pp — consistent margin expansion for five consecutive quarters. Gross margin improved by roughly 2-3pp per year. In raw Values mode, detecting this requires dividing Gross Profit by Revenue for each quarter, then computing the difference. In % of Sales mode with pp deltas, it is a single green cell reading.
Step 5 — Period Filter: Focus for Decisions
Apply Last 4 to confirm the most recent signal. With only the most recent 4 quarters in view, the re-acceleration in revenue (+13.8%, +15.9%, +18.0%) is unambiguous. Export as CSV if you want to document this analysis or compare GOOGL against META or MSFT side-by-side in a spreadsheet.
What the 6-Step Workflow Revealed About GOOGL
GOOGL Analytical Summary (via Display Modes)
- Scale (Values): $55B+ quarterly revenue — every % point of growth represents $550M+ in incremental revenue
- Trend (YoY%): Revenue re-accelerating from +12% to +18%; all-green profit rows at higher YoY% than revenue — classic operating leverage
- Pulse (QoQ%): Quarterly momentum confirms annual trend; expense deceleration consistent with cost discipline narrative
- Structure (% of Sales): Gross margin expanding consistently (~+2-3pp/year); Operating margin temporarily pressured by AI infrastructure capex
- Signal: The re-acceleration visible in YoY% mode Q3-25 to Q4-25 was the key inflection — raw numbers showed a jump from $89,498M to $119,575M but the rate increase (+15.9% to +18.0%) only became obvious in YoY% view
This is the power of four lenses on the same data. Each mode eliminated a different type of analytical friction. Together, they turned a 45-minute mental arithmetic exercise into a 3-minute structured workflow.
Which Mode When? A Decision Guide
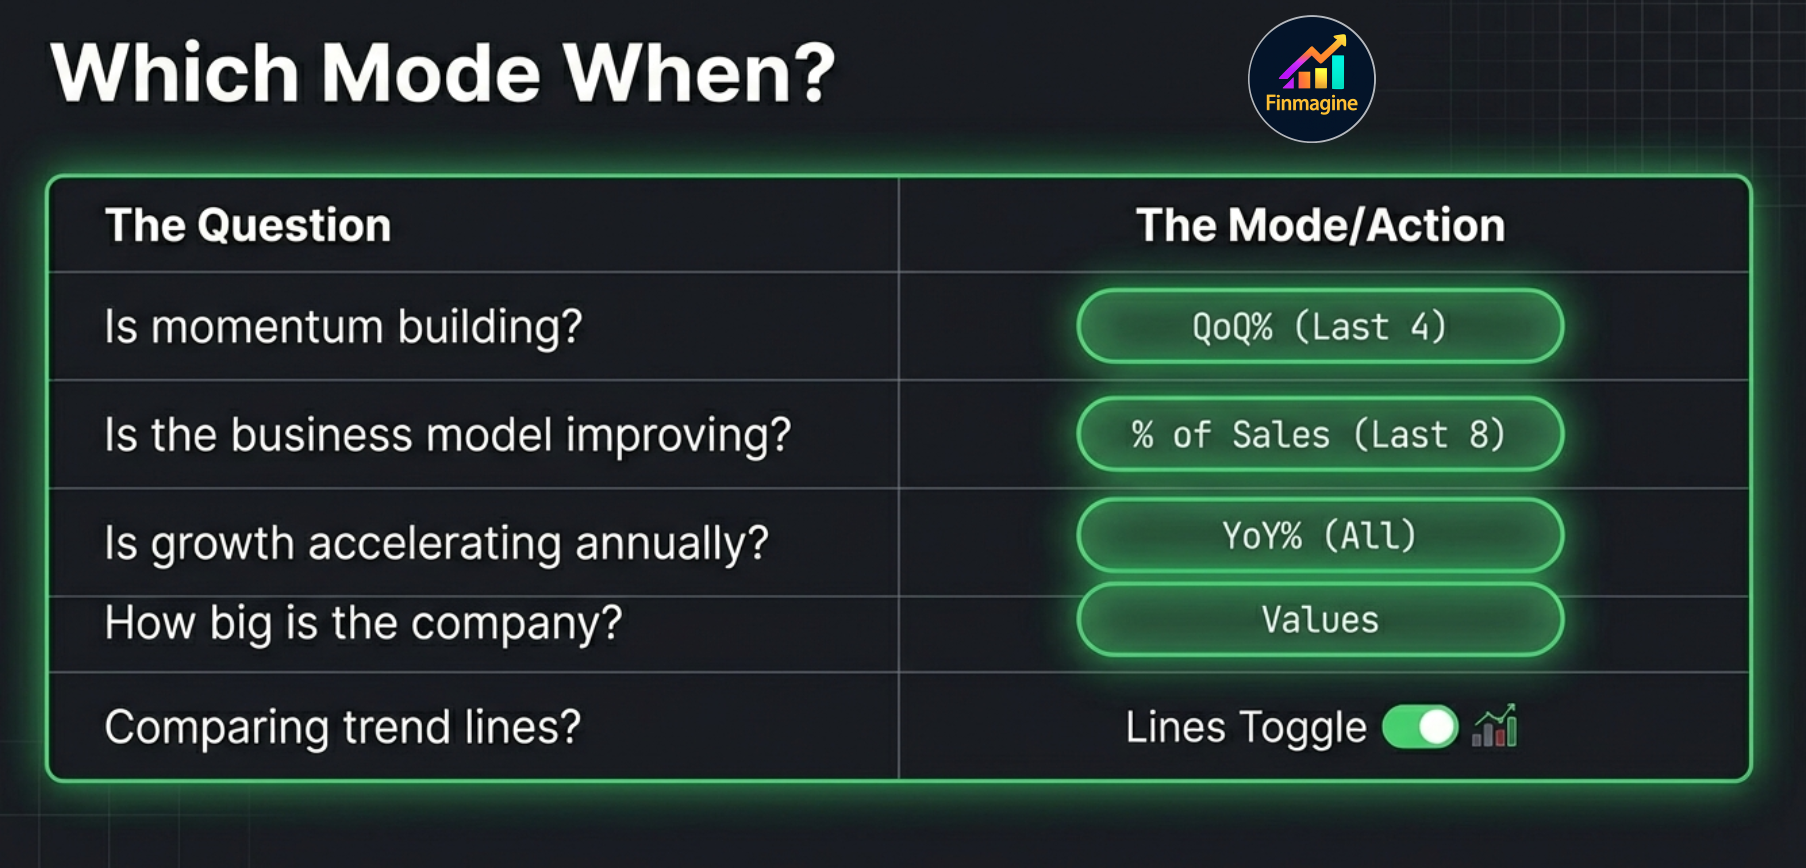
| Your Question | Best Mode | Best Filter |
|---|---|---|
| "How big is this company and how have the absolute numbers changed?" | Values | All or Last 8 |
| "Is growth accelerating or decelerating over the years?" | YoY% | Last 8 or All |
| "What is the current quarterly momentum?" | QoQ% | Last 4 |
| "Are margins expanding or contracting?" | % of Sales | Last 8 or All |
| "How much of each rupee of revenue becomes profit?" | % of Sales | Last 4 or Last 8 |
| "Is the company showing a COVID base-effect rebound or genuine growth?" | YoY% | All (to include FY21–FY23) |
| "I want to compare growth trends visually across multiple metrics" | Values + Lines toggle | Any |
| "I want to export this analysis for offline use or peer comparison" | Any Display Mode | Last 8 (clean export) |
Display Modes vs Charting: Complementary, Not Competing
A common question: if I am viewing the table in YoY% mode and charting Revenue, will the chart show raw Revenue or YoY% growth rates? The answer depends on the mode: when Display Modes is active, the chart reflects the current view — YoY% mode will chart growth rates, % of Sales will chart percentage ratios.
This means you can combine the two tools powerfully: switch to YoY% mode, select Revenue and Net Profit, and the chart becomes a growth rate comparison chart — showing whether Net Profit growth consistently exceeds Revenue growth (a sign of operating leverage) or lags behind it (a sign of cost pressure or margin dilution).
Platform Availability
| Feature | Screener.in | Google Finance | stockanalysis.com | Perplexity Finance |
|---|---|---|---|---|
| Display Modes (YoY%, QoQ%, % of Sales) | ✓ Full | ✗ Not available | ✓ Full | ✓ Full |
| Period Filter | ✓ Full | ✗ Not available | ✓ Full | ✓ Full |
| CSV Export | ✓ Full | ✗ Not available | ✓ Full | ✓ Full |
| Lines/Bars Toggle | ✓ All platforms | ✓ All platforms | ✓ All platforms | ✓ All platforms |
| Per-Metric Chart Type Toggle | ✓ All platforms | ✓ All platforms | ✓ All platforms | ✓ All platforms |
Display Modes require structured table data from the financial statements. Google Finance does not expose its data in an extractable table format for this processing, which is why Display Modes are unavailable there. The Lines/Bars toggle works on all platforms because it operates entirely on the charted data, regardless of source.
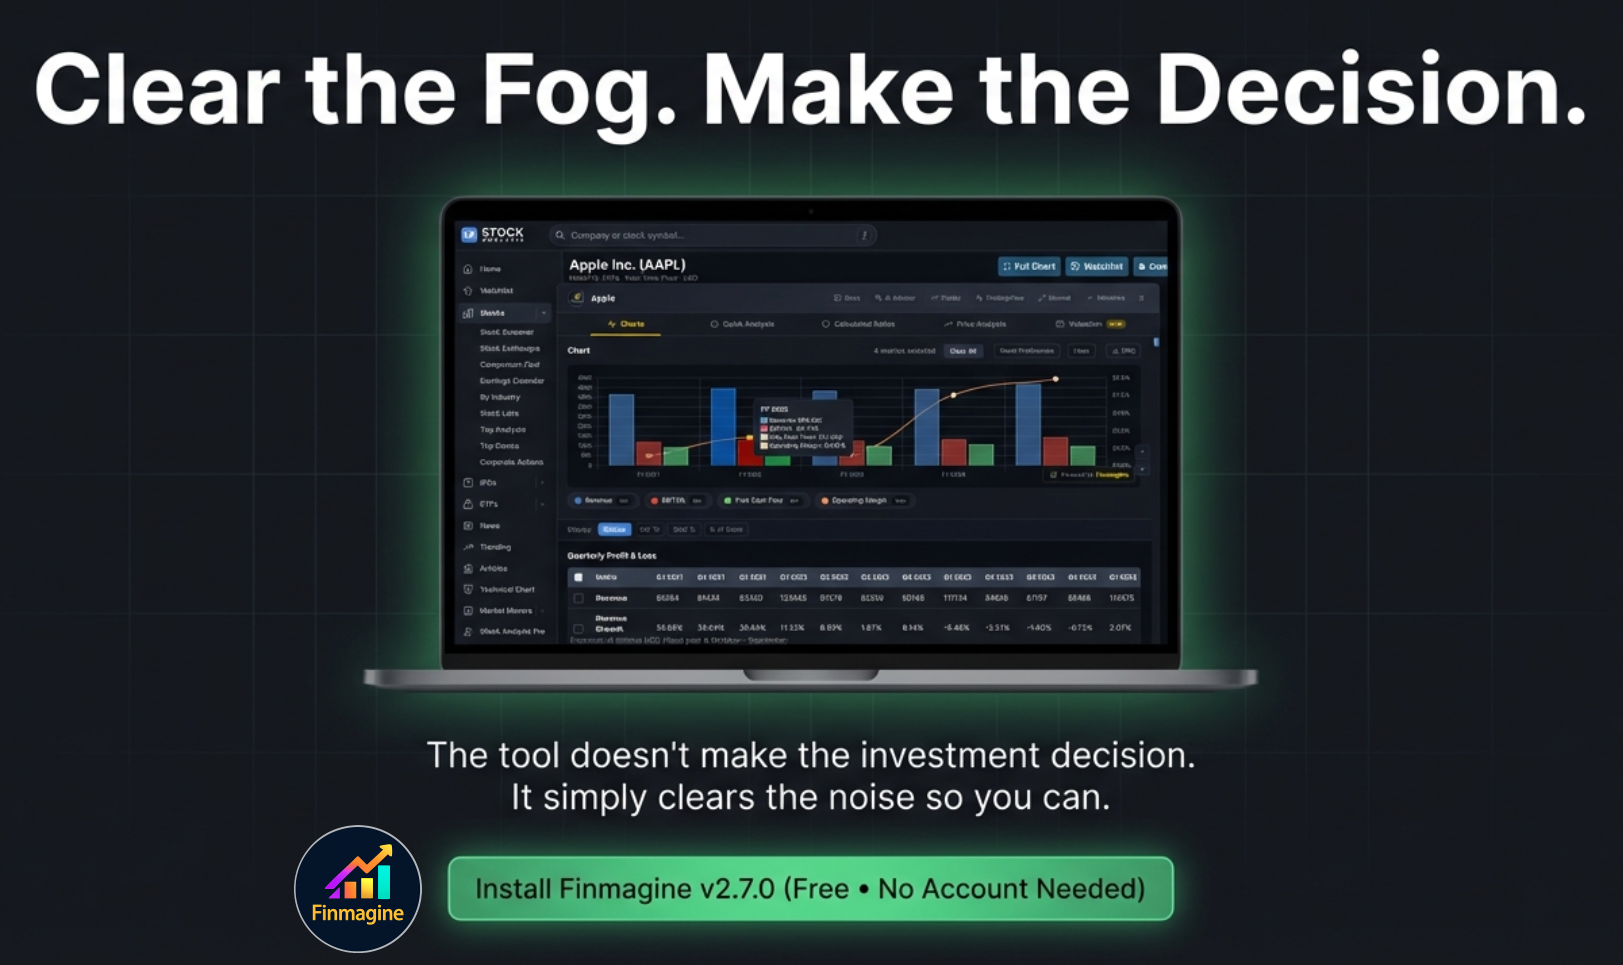
Free Chrome Extension
Ready to try this yourself?
Install the Finmagine Financial Chart Builder and transform any Screener.in, Google Finance, or stockanalysis.com page into interactive charts in one click.
Install from Chrome Web Store →No account required • Works on Chrome, Edge, Brave, Opera
Continue Learning: Related Guides
Charts, Quick Analysis, Calculated Ratios, Price Analysis, and Valuation — sector benchmarks, 74 flashcards, and the full analytical framework.
CAGR comparison, Indian Investor Returns, Cyclical Analysis, Risk Metrics — with real AMZN, NVDA, META, MSFT examples and 90 flashcards.
All 11 ratios (Interest Coverage, D/E, DuPont, Altman Z-Score, Piotroski F-Score) with exact thresholds and real company examples.
Altman Z-Score, Piotroski F-Score, ROIC-WACC, Analyst Outlook, Ownership data — all US-exclusive features explained.