Following along? Install the extension first
Finmagine AI Advisor — free • no account needed • Chrome, Edge, Brave
Multimedia Learning Hub
Master the Finmagine AI Advisor through video, audio deep dive, comprehensive overview, and interactive knowledge testing
Complete Learning Path
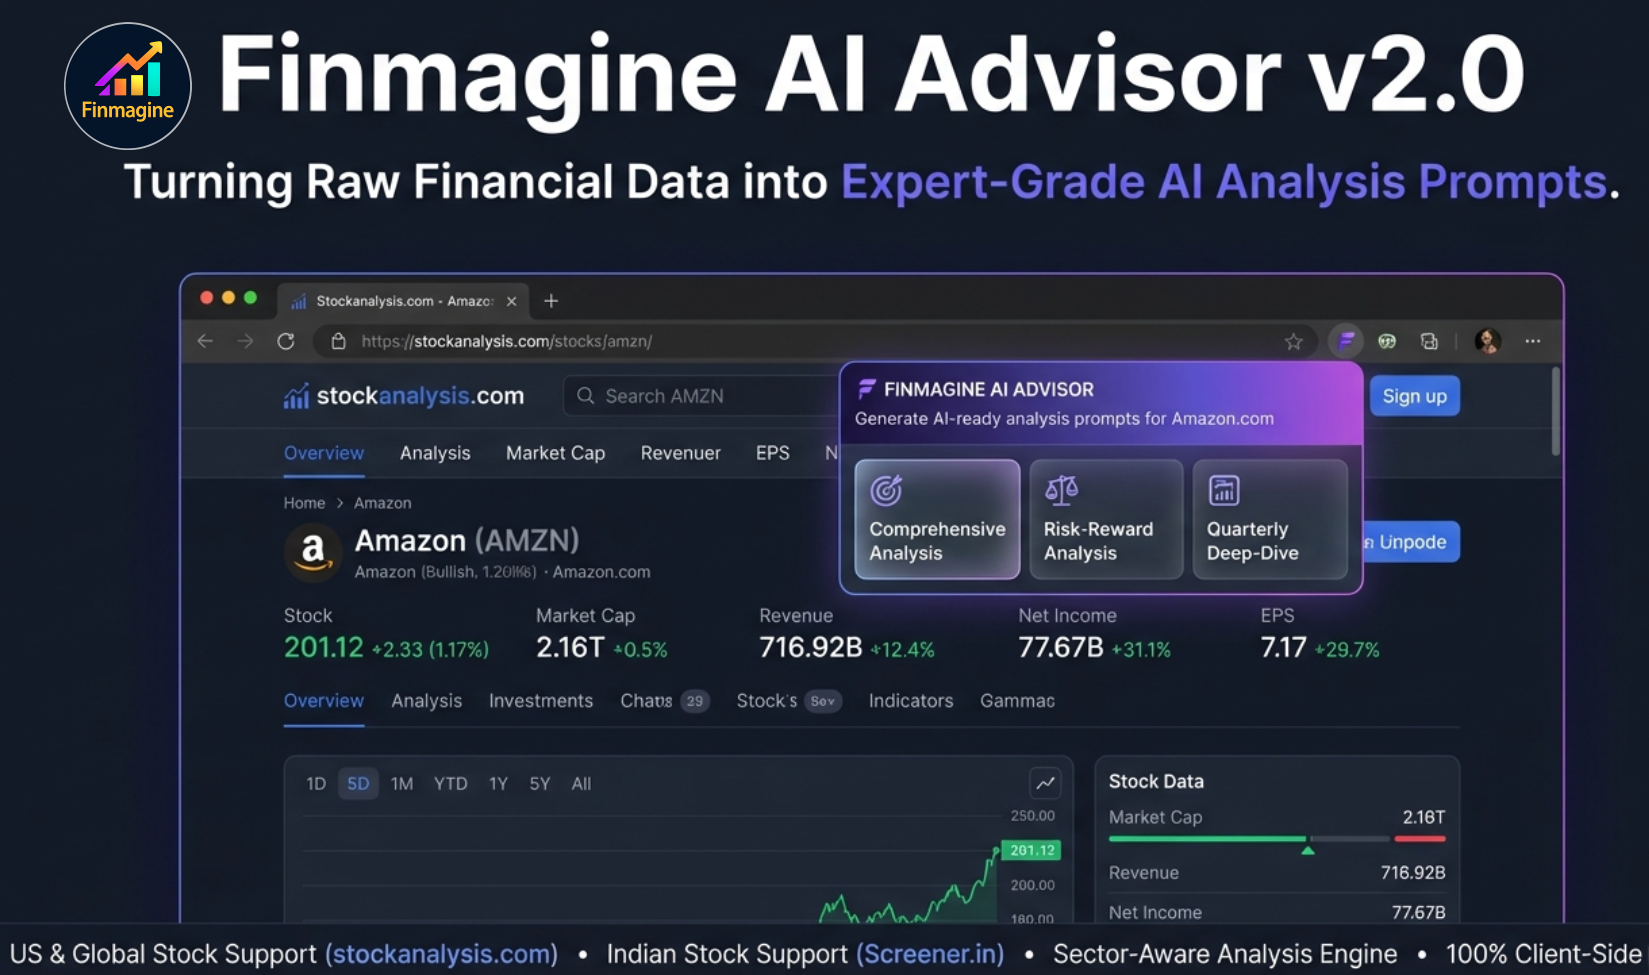
This deep-dive tutorial covers everything you need to know about the Finmagine AI Advisor Chrome Extension v2.0.0 — the tool that transforms any stock page on stockanalysis.com into an expert-grade AI analysis prompt in seconds. No manual data copying, no generic prompts — every prompt is built from actual company financials.
What You'll Learn:
- Origin Story: Why the AI Advisor exists and how it fits in the Finmagine ecosystem
- Architecture: How 10-page parallel fetching, staggered batching, and SPA polling work
- US-Exclusive Metrics: Altman Z-Score, Piotroski F-Score, ROIC-WACC spread, analyst consensus, ownership data
- Three Templates: Comprehensive Analysis, Risk-Reward Analysis, and Quarterly Deep-Dive
- Case Studies: Real GPT output for Amazon (AMZN), Berkshire Hathaway (BRK.A), and PDD Holdings (PDD)
- India vs US: How the two platforms differ in data, templates, and analytical depth
- Finmagine Framework: The Five-Parameter Scoring methodology and investment classifications
- Power User Tips: Template selection, prompt editing, combining with Chart Builder
Key Skills You'll Master:
- Generate institutional-grade analysis prompts for any US-listed stock in 5 seconds
- Interpret Altman Z-Score, F-Score, and ROIC-WACC spread like a professional analyst
- Choose the right template for your investment question
- Understand how 145 GICS industry classifications map to sector-aware analysis
- Avoid common pitfalls when interpreting AI-generated investment research
Watch: Finmagine AI Advisor for US Stocks
See the AI Advisor in action — from installation to institutional-grade analysis in one click.
Video Title: Finmagine AI Advisor for US Stocks | Institutional Analysis in One Click
Complete video demonstration with real US stock examples and live prompt generation
Listen: The Deep Dive Audio Guide
A comprehensive audio exploration of how the AI Advisor automates institutional stock analysis — covering architecture, metrics, and real case studies.
Duration: Full deep dive | Format: Conversational analysis
Deep dive audio exploring how the AI Advisor bridges the gap between data availability and actual insight
Test Your Knowledge
Click any flashcard to reveal the answer. Use the search box to find specific topics.
Introduction & Origin Story
If you've ever tried to get meaningful stock analysis from an AI chatbot, you know the frustration. You type "Is Amazon a good buy?" and you get a generic, hedged response that sounds like it was written by a compliance lawyer in 2021. The reason is simple: AI models are reasoning engines, but they're amnesiac. They only know what you tell them in that specific conversation, plus their training data — which is often months or years out of date.
The real bottleneck isn't intelligence. It's context. If you want institutional-grade analysis, you need to feed the AI current numbers: five years of balance sheets, cash flow trends, analyst consensus, valuation multiples, ownership data — all of it. And that leads to what we call copy-paste hell.
The Copy-Paste Problem
Picture the manual workflow: You open a tab for the stock price. Another for the income statement. A third for the balance sheet. Fourth for cash flow. Fifth for analyst ratings. You're jumping between tabs, highlighting rows, copying, pasting — and the formatting breaks every time. Columns don't align, tabs are wrong, the AI thinks the revenue number is actually a date because of some random spacing error. After 20 minutes of cleanup, you haven't even asked your first question.
Because this process is so painful, investors cut corners. They rely on gut feelings, headlines, or surface-level metrics. That's a dangerous way to invest.
Why a Separate Extension?
Finmagine already had a successful Chrome extension — the Finmagine Chart Builder — with 180+ users and a perfect 5.0 rating. The Chart Builder transforms financial tables into professional charts. So why build a completely separate extension for AI analysis?
The answer is risk isolation. The AI Advisor interacts with financial data platforms in a fundamentally different way than the Chart Builder. By keeping them as separate extensions, any issue with one product cannot affect the other. The Chart Builder's reputation and user base remain protected while the AI Advisor innovates independently.
The Finmagine Ecosystem
The AI Advisor doesn't exist in a vacuum. It's part of a broader Finmagine investment research ecosystem:
- Finmagine Chart Builder: Transforms financial tables into professional dual-axis charts (Screener.in, Google Finance, stockanalysis.com)
- Finmagine AI Advisor: Generates structured AI analysis prompts from real financial data (this extension)
- Finmagine Extension Analyst: A Custom GPT (powered by GPT-5.2) specifically trained with the Finmagine analysis methodology
- finmagine.com: The full platform with 71 company reports, 22+ interactive tools, rankings, and education
Together, these tools form a complete research workflow: visualize the data (Chart Builder), generate the analysis prompt (AI Advisor), and get expert-grade output (Custom GPT).
How It Works — The Technical Magic
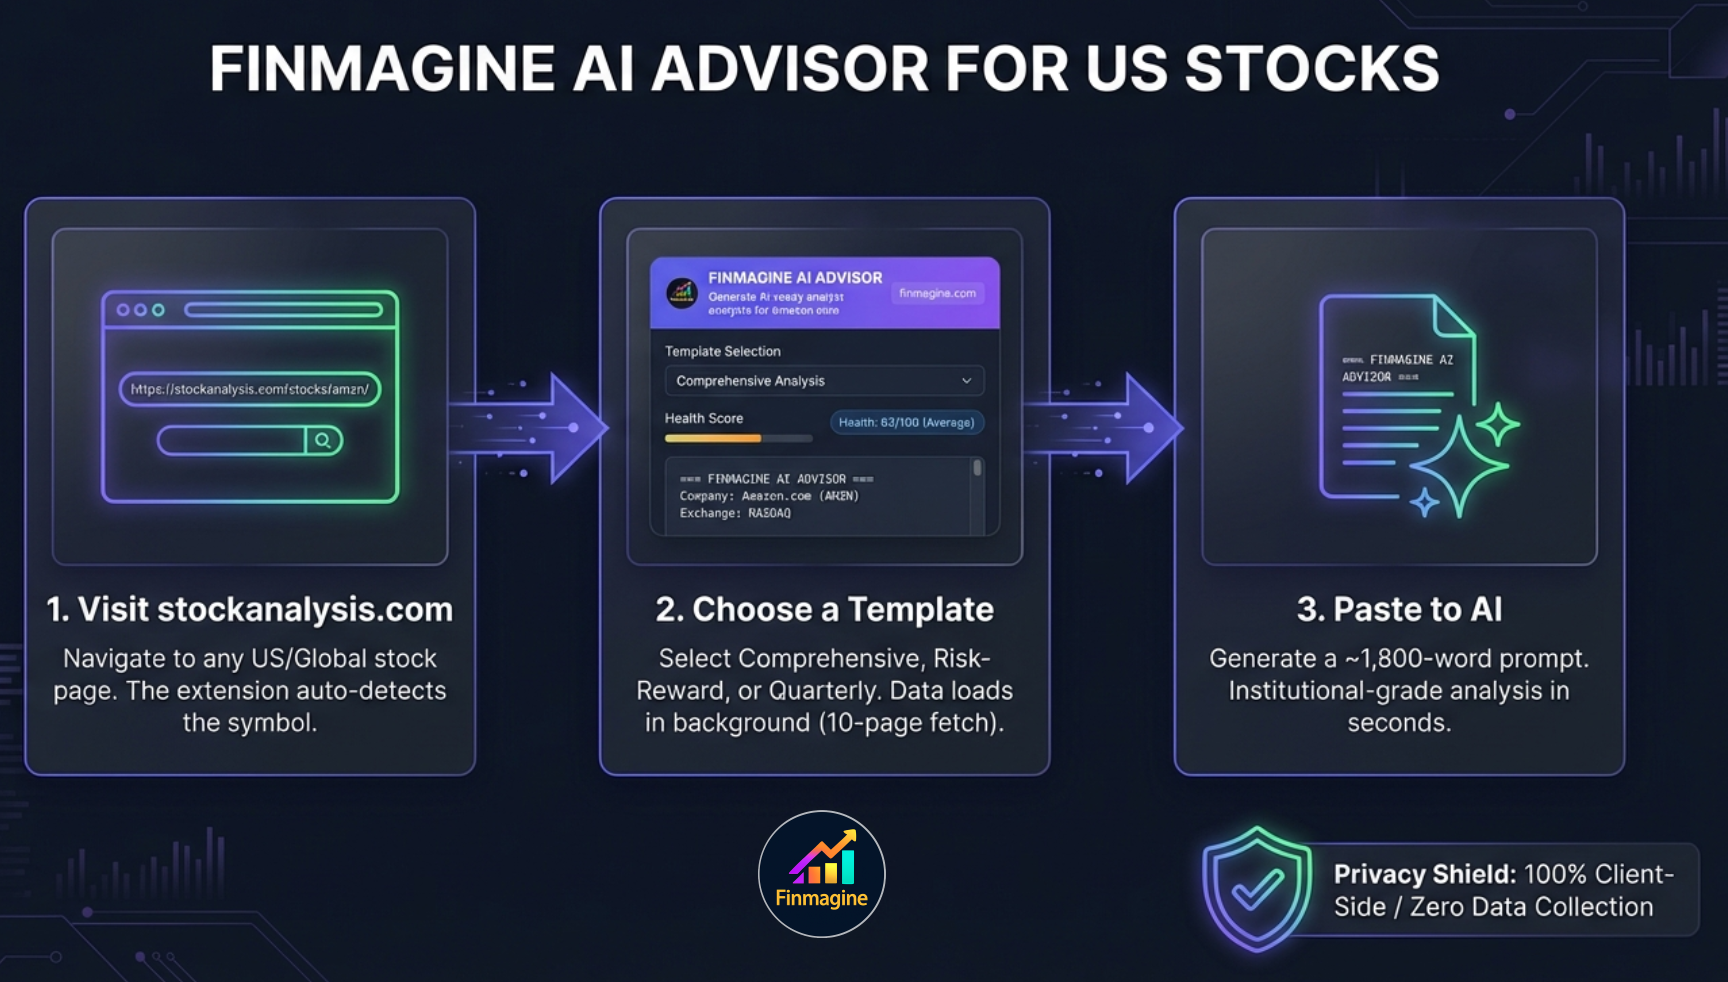
The Finmagine AI Advisor follows a three-step workflow that turns a 20-minute manual process into a 5-second click:
The User Flow
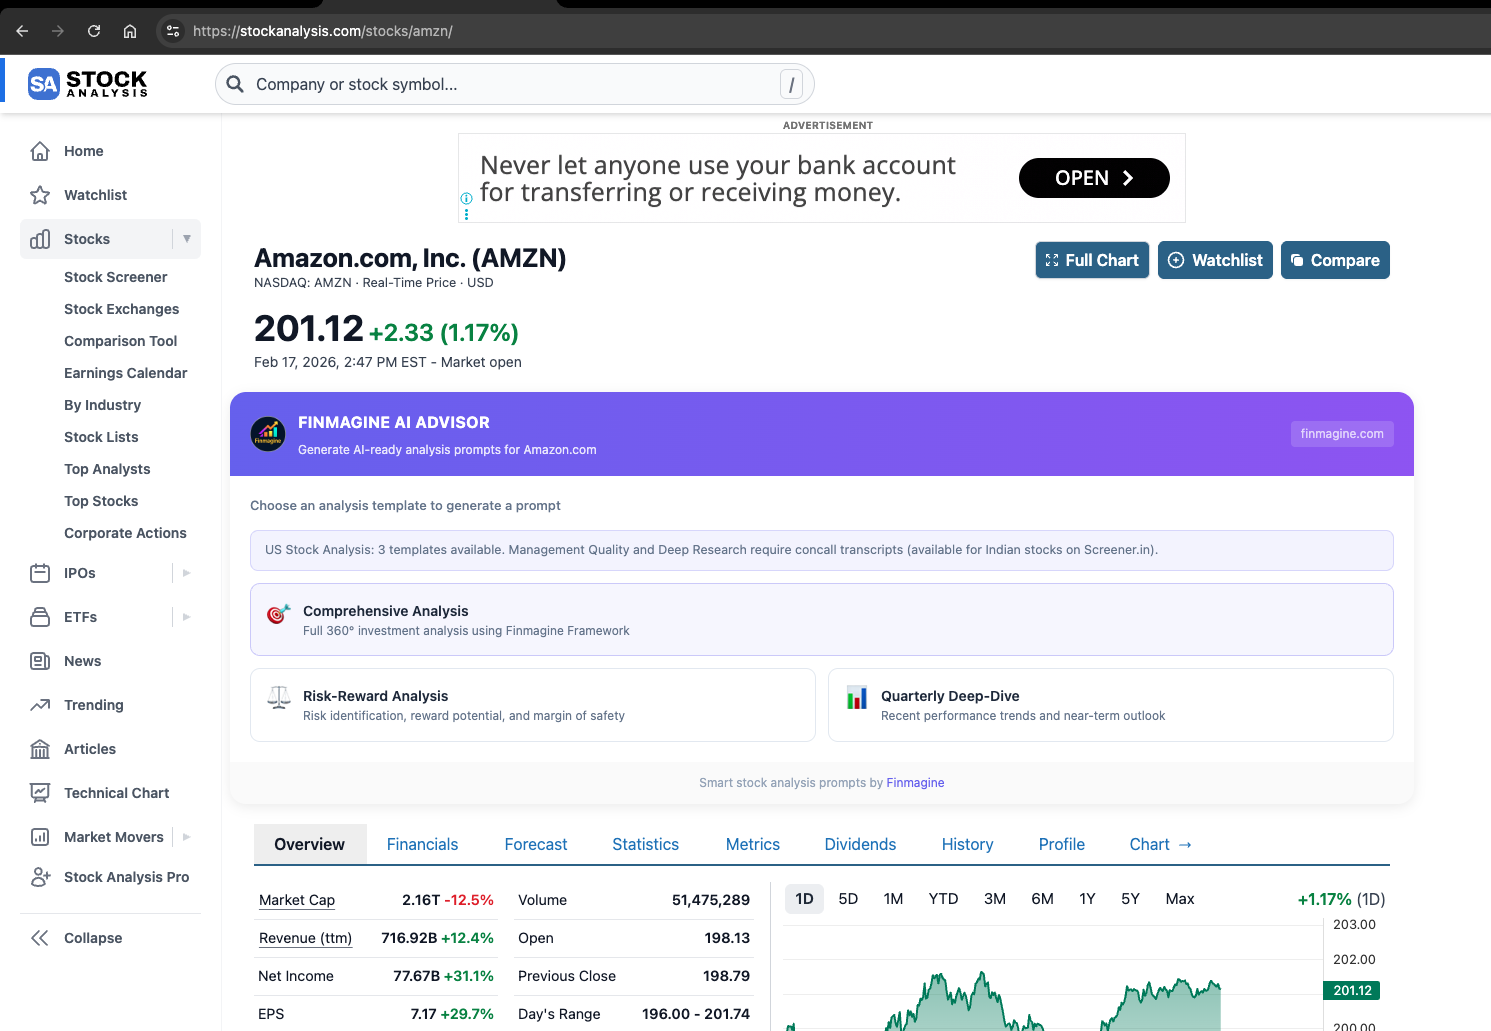
- Visit any stock page on stockanalysis.com (e.g., stockanalysis.com/stocks/meta/)
- The AI Advisor panel appears inline — embedded directly into the page, not a floating popup
- Choose an analysis template — Comprehensive, Risk-Reward, or Quarterly Deep-Dive
- A ~1,800-word structured prompt is generated with real financial data, computed metrics, and analysis instructions
- Copy the prompt and paste it into ChatGPT, the Finmagine Extension Analyst GPT, or any AI assistant
- Receive institutional-grade investment research
Data Extraction: Two Worlds
The extension supports two platforms with fundamentally different data architectures:
| Aspect | Screener.in (India) | stockanalysis.com (US) |
|---|---|---|
| Extraction Method | Synchronous DOM scraping | Async 10-page parallel fetch |
| Network Requests | Zero — all data on page | 10 fetches in staggered batches |
| Extraction Time | <100ms (instant) | ~5–6 seconds |
| Rate Limiting | None | 800ms batch gaps to avoid HTTP 429 |
The Analysis Engine
Before the prompt is even assembled, a local analysis engine (running entirely in your browser) computes several derived metrics:
- Health Score (0–100): A composite score reflecting overall financial health, calibrated to sector-specific thresholds
- CAGR Calculations: Revenue, profit, EPS, and free cash flow compound annual growth rates
- DuPont ROE Breakdown: Decomposing Return on Equity into margin, turnover, and leverage components
- Valuation Verdicts: Comparing current PE, P/B, and EV/EBITDA against historical medians
- Strengths & Concerns: Automatically identified based on data patterns
Prompt Assembly
The prompt builder merges raw financial data, computed analysis, and template-specific instructions into a structured ~1,800-word prompt. This isn't a simple "analyze this stock" request — it's a complete dossier with explicit scoring instructions, sector context, and data quality constraints that force the AI into a professional analytical persona.
US/Global Stocks Deep Dive — stockanalysis.com
The Engineering Challenge
stockanalysis.com is built with Next.js — a modern single-page application framework. This creates two major engineering challenges that the extension must overcome:
Challenge 1: Fragmented Data. Unlike Screener.in (where all financial data lives on one page), stockanalysis.com splits data across 10 separate URLs. Each financial statement, each time period, each data category has its own page.
Challenge 2: SPA Navigation. When you click from one stock to another, the page doesn't reload. The website uses client-side routing to swap content without a full page refresh. A traditional Chrome extension (which runs once on page load) wouldn't even notice the change.
10-Page Parallel Fetch Architecture
The extension fetches data in two phases, with pages batched in pairs and 800ms gaps between batches to avoid rate limiting:
Phase 1 — Core Annual Data (5 pages):
| Page | Data Extracted |
|---|---|
| Annual Income Statement | Revenue, Net Income, EPS, Margins, EBITDA |
| Annual Balance Sheet | Assets, Liabilities, Equity, Debt |
| Annual Cash Flow | Operating CF, CapEx, Free Cash Flow |
| Annual Ratios | PE, P/B, EV/EBITDA, ROE, ROA |
| Company Profile | Sector, Industry (GICS), Description |
Phase 2 — Quarterly & Enrichment Data (5 pages):
| Page | Data Extracted |
|---|---|
| Quarterly Income Statement | Quarterly Revenue, Net Income, EPS |
| Quarterly Balance Sheet | Quarterly Assets, Debt |
| Quarterly Cash Flow | Quarterly OCF, FCF |
| Statistics | 50+ metrics: Z-Score, F-Score, ROIC, WACC, analyst data, ownership |
| Price History | Daily OHLCV data |
Instant UI Shell Pattern
Six seconds of blank screen is an eternity in UX terms. The extension solves this with an instant UI shell: the moment you load a stock page, the panel renders immediately with the three template cards visible. While you're reading the template descriptions and deciding which analysis you want, the 10 pages are fetching in the background. By the time you click a card, the data has usually arrived.
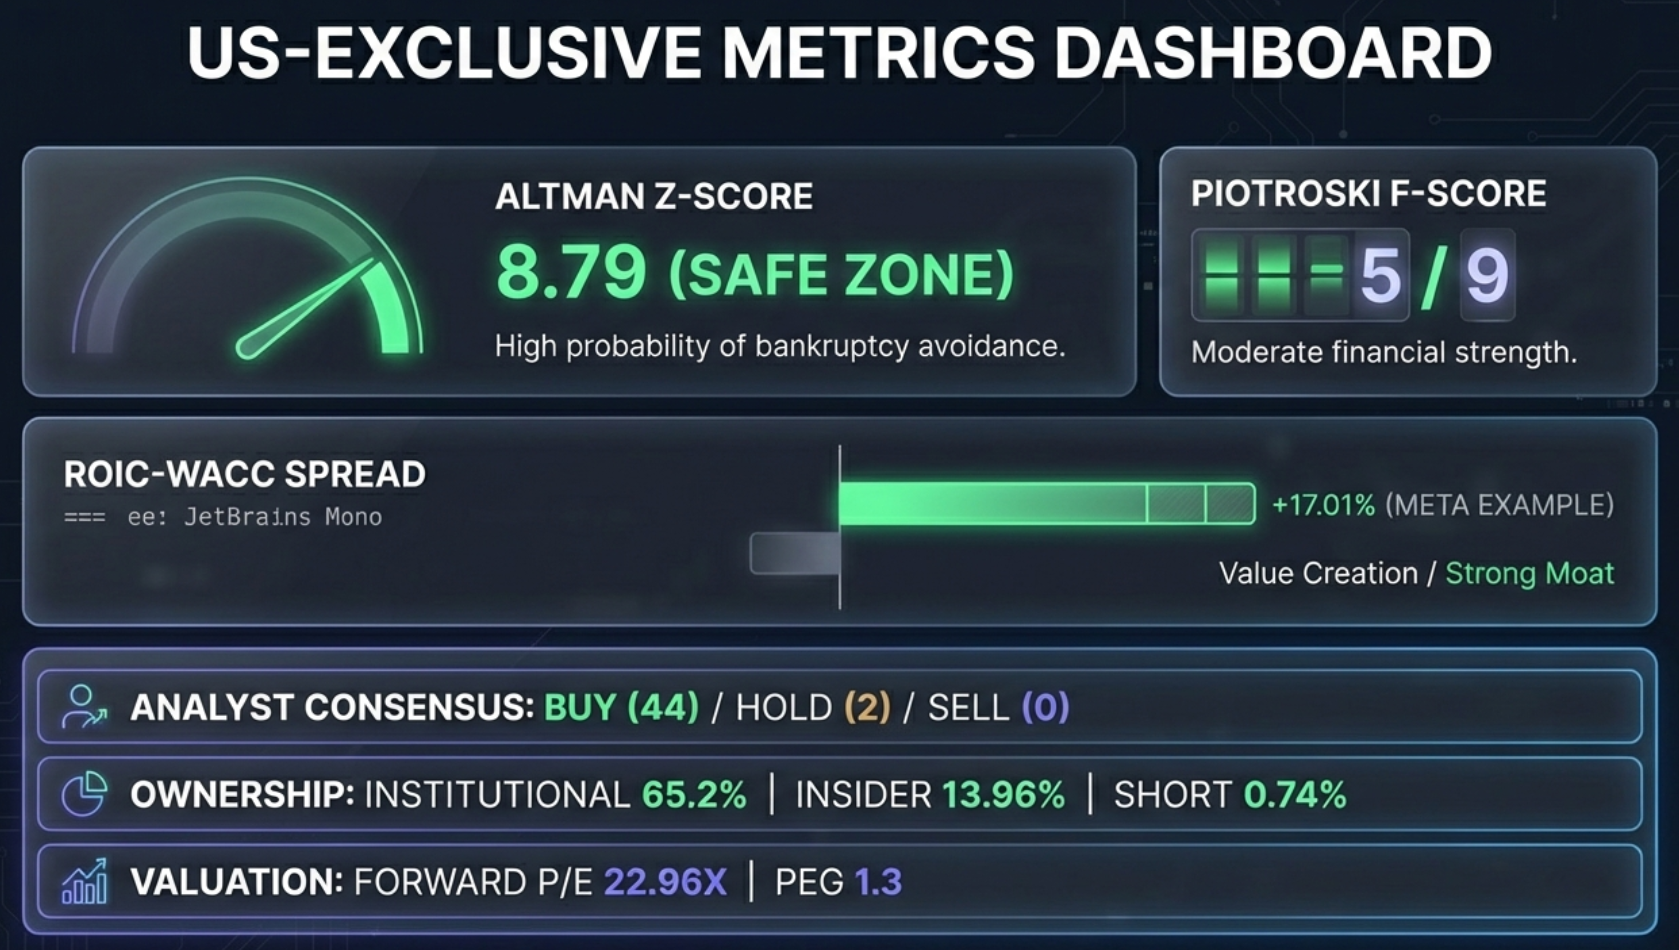
Advanced US-Exclusive Metrics
Altman Z-Score — Bankruptcy Risk Assessment
Developed by Professor Edward Altman in 1968, the Z-Score combines five financial ratios to predict bankruptcy probability within two years. The extension extracts the pre-computed value from the Statistics page.
| Zone | Z-Score | Meaning |
|---|---|---|
| Safe | > 2.99 | Low bankruptcy risk |
| Grey | 1.81 – 2.99 | Uncertain territory |
| Distress | < 1.81 | High bankruptcy risk |
Piotroski F-Score — Financial Strength (0–9)
A 9-point binary scoring system evaluating profitability (4 criteria), leverage (3 criteria), and efficiency (2 criteria). Each criterion the company passes earns one point. Scores of 7–9 indicate strong financial health; 0–3 indicate weakness.
ROIC-WACC Spread — The North Star Metric
The difference between Return on Invested Capital (what the company earns) and Weighted Average Cost of Capital (what it costs to fund investments). This is the purest measure of value creation:
| Spread | Meaning | Signal |
|---|---|---|
| > +15% | Exceptional value creation | Strong moat — Core Compounder |
| +5% to +15% | Solid value creation | Healthy capital allocation |
| 0% to +5% | Marginal value creation | Adequate but not exceptional |
| Negative | Value destruction | Investigate if temporary or structural |
Analyst Consensus & Price Targets
The extension pulls Buy/Hold/Sell distribution, mean/high/low price targets, and forward estimates. The AI uses a "confirm vs. contradict" logic: when strong fundamentals align with a Buy consensus, conviction increases. When they diverge, the AI flags the discrepancy and investigates.
Institutional & Insider Ownership + Short Interest
Three ownership signals provide context on who owns the stock and who's betting against it. High insider ownership signals management alignment; high short interest signals bearish conviction that warrants investigation.
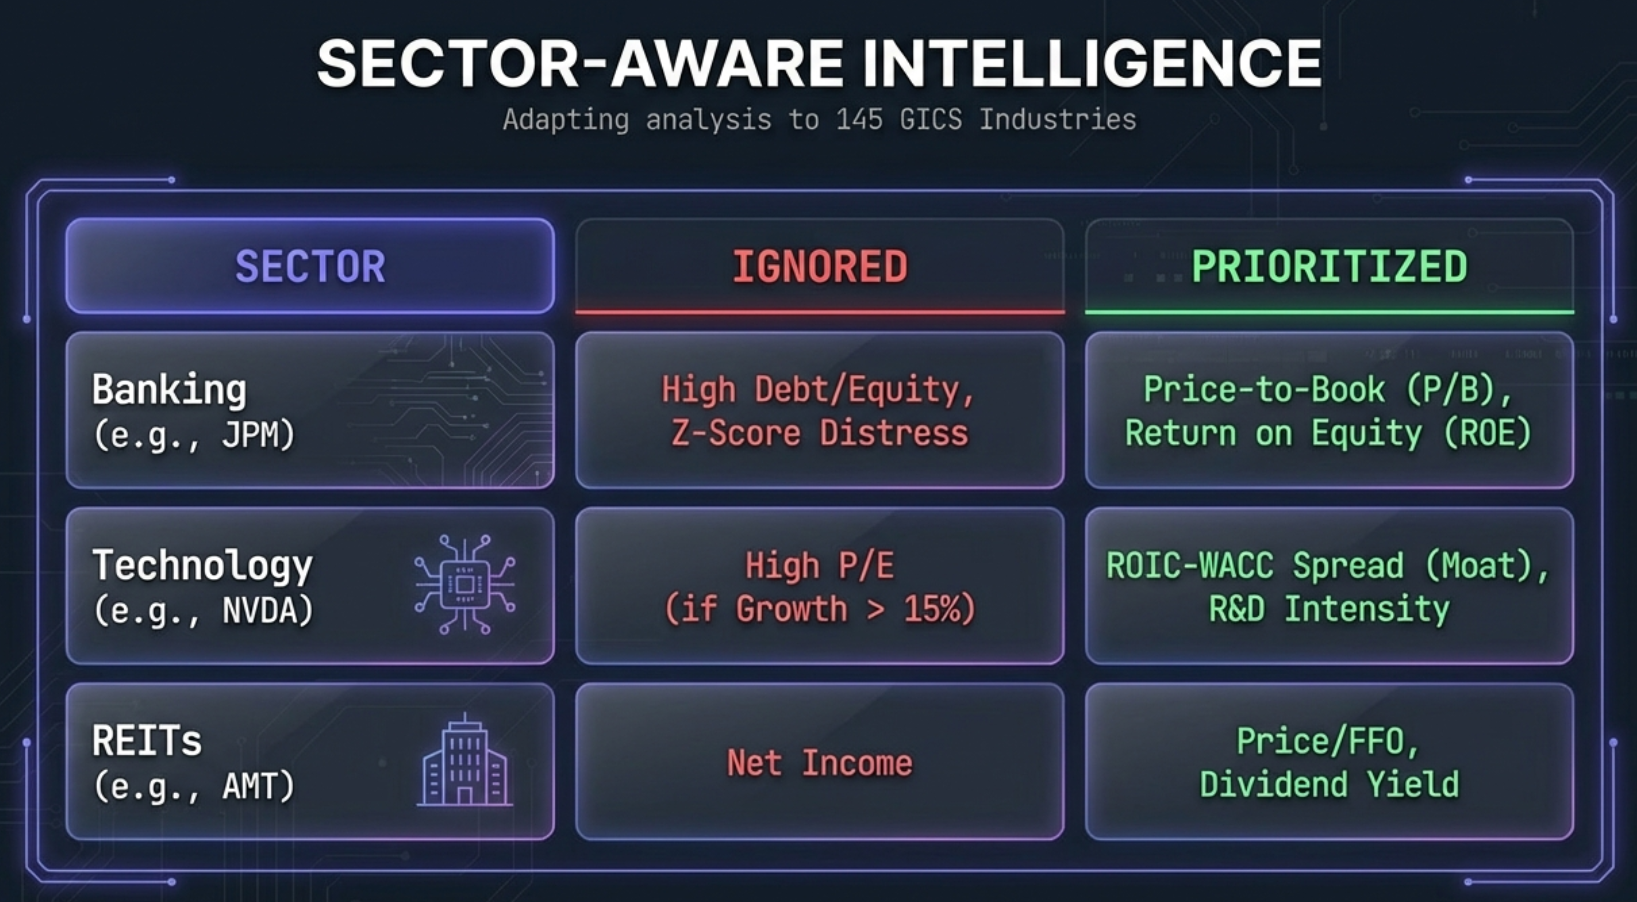
145 GICS Industry Classifications
US stocks use the Global Industry Classification Standard (GICS) with 11 sectors, 24 industry groups, and 145 distinct industries. The extension contains a mapping layer that translates all 145 GICS industries to its 18 core analysis profiles. This ensures sector-appropriate thresholds are applied: a bank isn't penalized for high leverage, and a tech company isn't penalized for a high PE ratio.
The Three US Templates
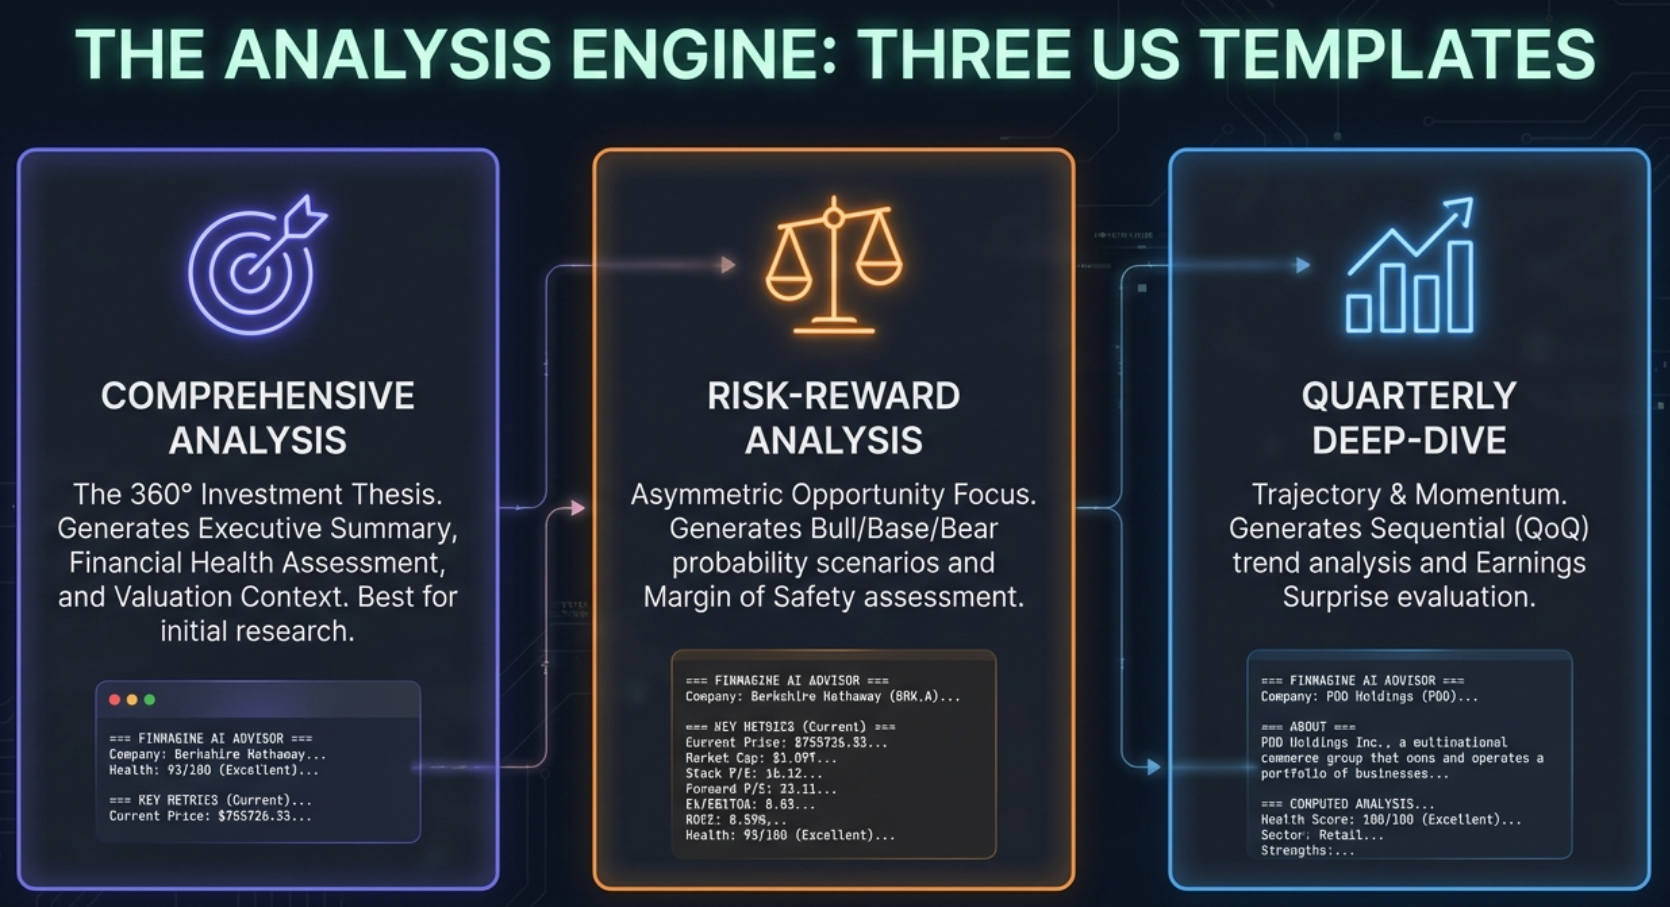
Comprehensive Analysis — The 360-Degree View
Best for first-time analysis or annual portfolio reviews. Produces a complete investment thesis covering financial health, growth, competitive positioning, management quality, and valuation. Use this when you need the full picture.
Risk-Reward Analysis — The Decision Maker
Best for buy/sell decisions and position sizing. Explicitly models bull/base/bear scenarios with probability weights and calculates asymmetry ratios. Use this when you're hovering over the buy or sell button.
Quarterly Deep-Dive — The Monitor
Best for post-earnings analysis and trend monitoring. Focuses on sequential quarter-over-quarter changes rather than multi-year averages. Use this when you own a stock and want to know if the thesis is still intact.
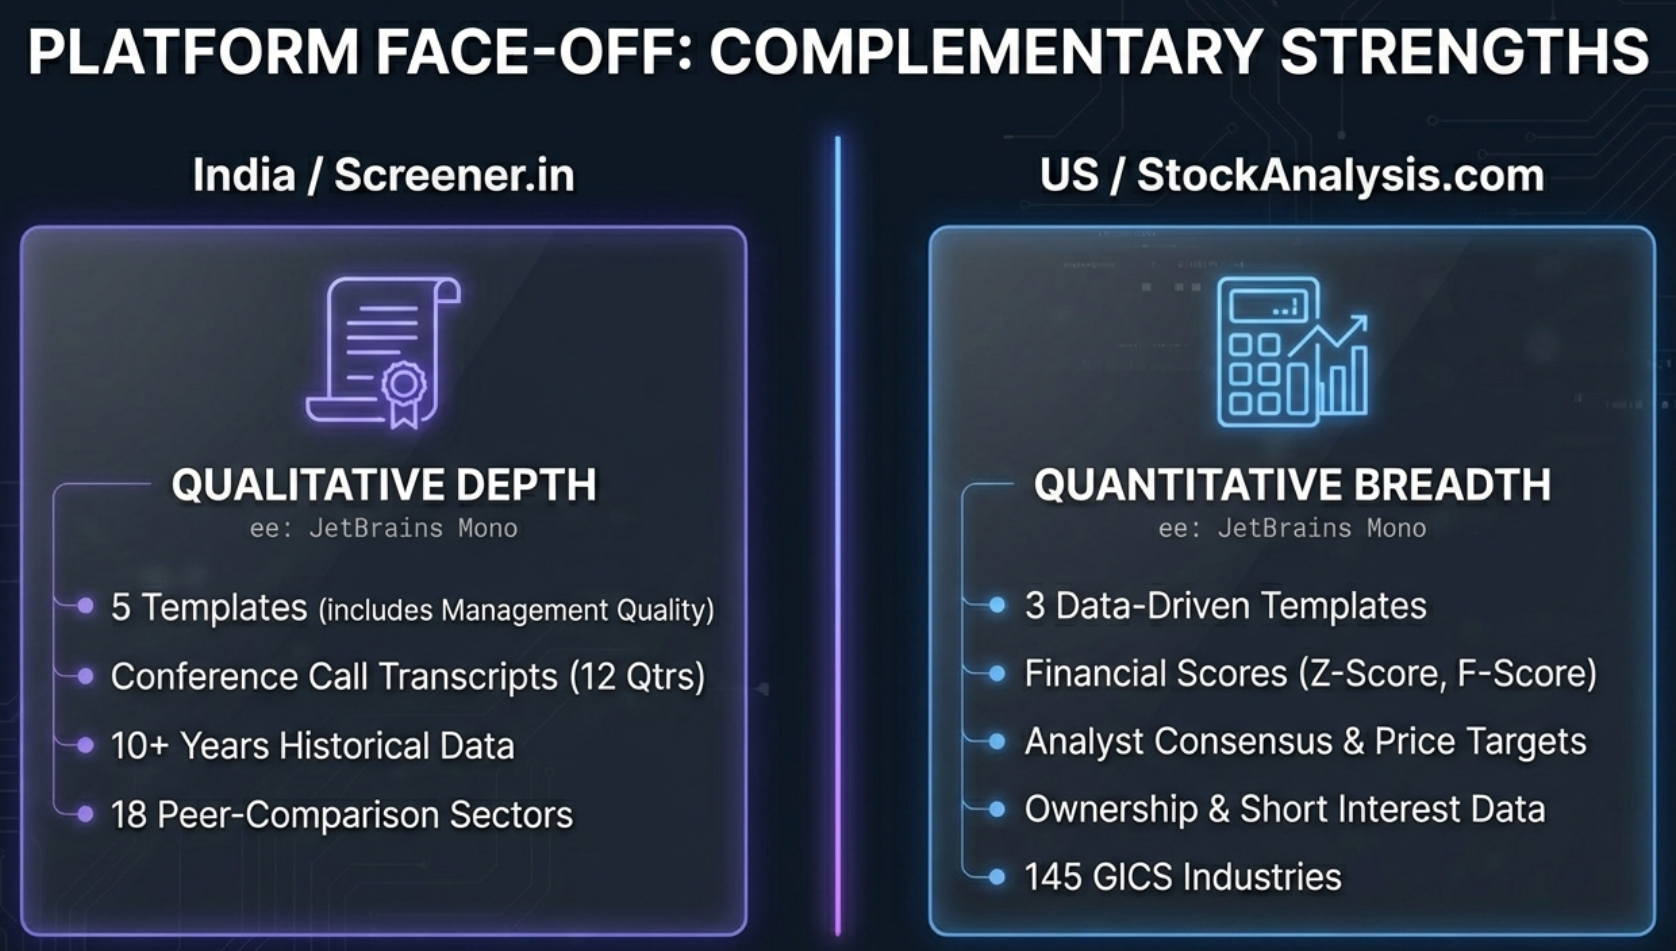
India vs US — Platform Comparison
The AI Advisor works on both Screener.in (Indian stocks) and stockanalysis.com (US/Global stocks), but the analysis depth differs significantly. It's a trade-off between qualitative depth (India) and quantitative breadth (US).
| Aspect | India (Screener.in) | US (stockanalysis.com) |
|---|---|---|
| Templates | 5 (Comprehensive, Risk-Reward, Management Quality, Quarterly, Deep Research) | 3 (Comprehensive, Risk-Reward, Quarterly) |
| Extraction | Synchronous DOM scraping (instant) | Async 10-page parallel fetch (~5–6s) |
| Financial History | 10+ years | 5 years (free tier) |
| Quarterly Data | P&L only | P&L + Balance Sheet + Cash Flow |
| Financial Scores | Not available | Z-Score, F-Score, ROIC-WACC |
| Analyst Data | Not available | Consensus, price targets, forecasts |
| Ownership | Promoter/FII/DII | Institutional + Insider + Short Interest |
| Conference Calls | 12 quarters (BSE PDF links) | Not available |
| Annual Reports | All available (BSE links) | Not available |
| Credit Ratings | All available | Not available |
| Sector Profiles | 18 sectors | 145 GICS industries → 18 profiles |
Why India Has 5 Templates but US Has 3
The Management Quality template analyzes concall transcripts, management guidance vs. actual delivery, and governance signals. The Deep Research template instructs the AI to browse BSE PDF links (concalls, presentations, annual reports) for a 15–30 minute forensic analysis. Both require document URLs that stockanalysis.com doesn't provide.
The Finmagine Framework — Scoring Methodology
Every analysis the AI Advisor generates follows a standardized scoring methodology. This isn't a black box — the framework is explicit, weighted, and consistent across companies, enabling apples-to-oranges comparison between a tech giant and an energy major.
The Five-Parameter Weighted Score
| Parameter | Weight | What the AI Evaluates |
|---|---|---|
| Financial Health | 25% | Z-Score, F-Score, D/E ratio, current ratio, interest coverage, cash flow quality |
| Growth Prospects | 25% | Revenue CAGR, profit CAGR, FCF CAGR, margin trajectory, reinvestment rate |
| Competitive Position | 20% | ROIC-WACC spread, margin sustainability, market share indicators |
| Management Quality | 15% | Capital allocation (ROIC trend), insider ownership, share dilution/buybacks |
| Valuation | 15% | PE vs history, P/FCF, EV/EBITDA, PEG, price target vs current |
Composite Score = (Financial Health × 0.25) + (Growth × 0.25) + (Competitive Position × 0.20) + (Management × 0.15) + (Valuation × 0.15)
Score Interpretation
| Composite | Rating | Typical Action |
|---|---|---|
| 8.5 – 10.0 | Exceptional | Strong conviction buy candidate |
| 7.0 – 8.4 | Strong | Solid investment candidate |
| 5.5 – 6.9 | Average | Requires catalyst or deep value thesis |
| 4.0 – 5.4 | Below Average | Significant concerns |
| < 4.0 | Weak | Avoid unless contrarian thesis is very strong |
Investment Classifications
Based on the Five-Parameter profile, the AI assigns one of five classifications:
- Core Compounder: High across all parameters. Dominant market position, strong ROIC-WACC, consistent growth, reasonable valuation. (Example: AMZN 8.2/10)
- Growth Compounder: Growth Prospects dominant. Accelerating revenue, expanding margins, may trade at premium. (Example: UBER 7.6/10)
- Cyclical Compounder: Strong Financial Health + Competitive Position; Growth varies with industry cycles. (Example: LRCX)
- Capital Preservation Compounder: Financial Health + Valuation strong. Fortress balance sheet, modest growth, downside protection. (Example: BRK.A 8.0/10)
- Value-Growth Hybrid: Attractive valuation + re-accelerating growth. Transitional phase. (Example: PDD 8.8/10)
Sector-Aware Thresholds
A 15% ROE means very different things in different industries. For an IT company, it's mediocre. For a bank, it's excellent. For a utility, it's exceptional. The framework applies sector-specific thresholds so that a banking stock isn't unfairly penalized for high leverage, and a tech stock isn't unfairly penalized for a high PE ratio.
Real-World Case Studies
Let's walk through three complete examples showing the full journey from stock page to GPT output. Each company represents a fundamentally different business model, demonstrating how the same framework adapts to wildly different situations.
Case Study 1: Amazon (AMZN) — Comprehensive Analysis
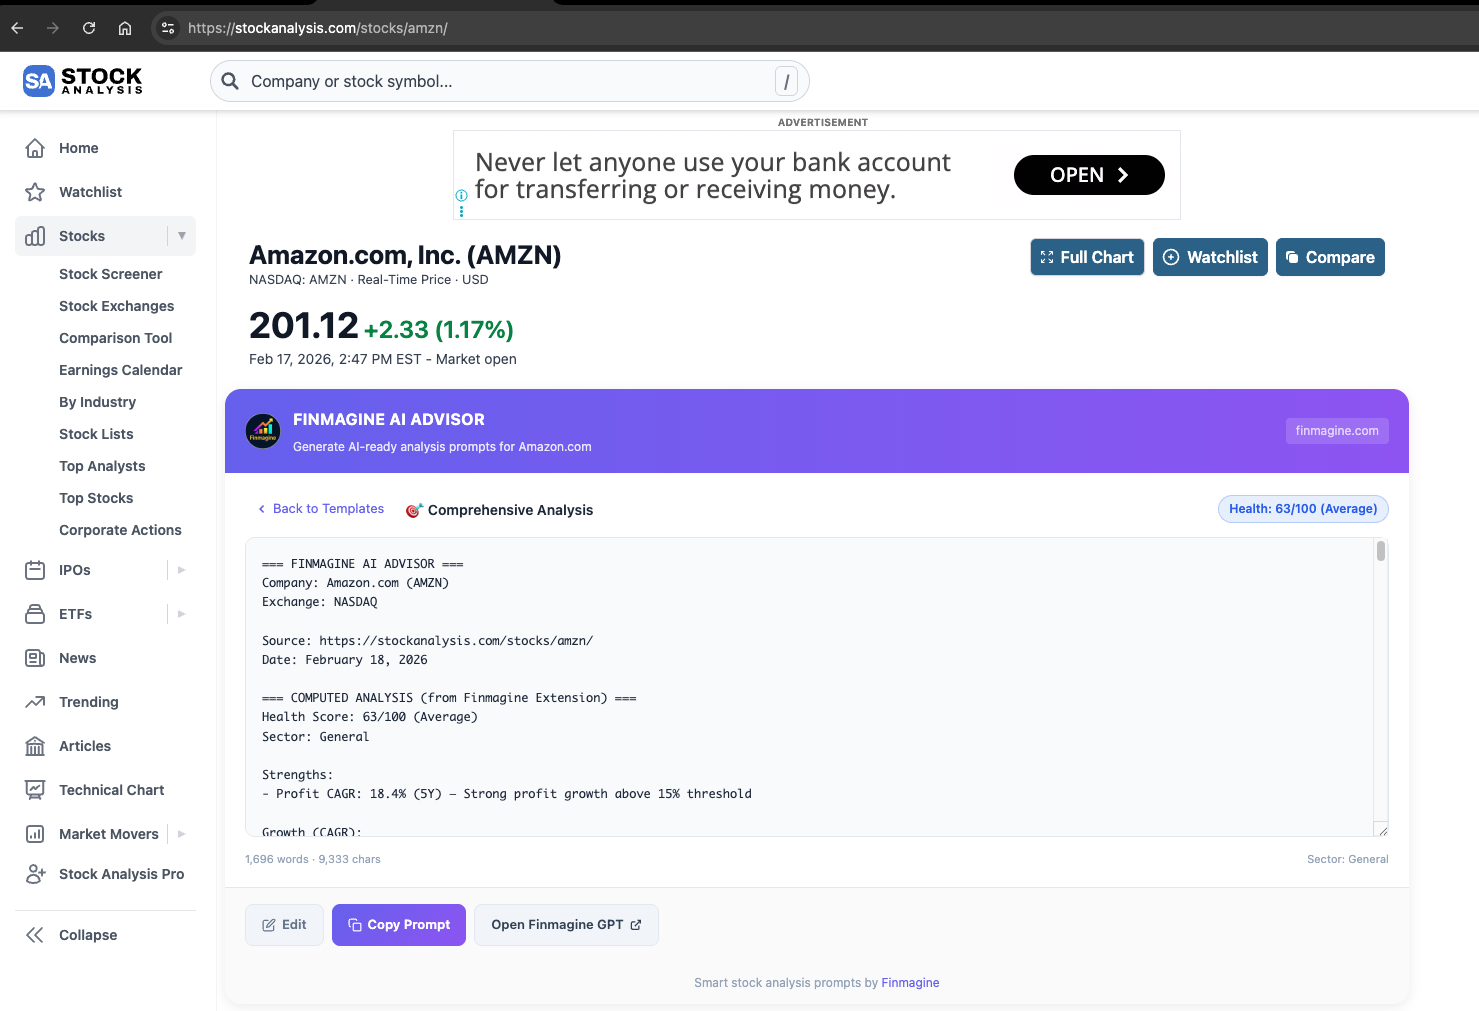
Health Score: 93/100 (Excellent)
Amazon was classified as a Core Compounder with a weighted score of 8.2/10. Here's how the five parameters scored:
| Parameter | Score | Key Driver |
|---|---|---|
| Financial Health | 9/10 | Z-Score 5.06 (Safe), massive OCF ($139.5B), rapid deleveraging |
| Growth Prospects | 8/10 | Revenue CAGR 8.8% (5Y), profit CAGR 18.4%, EPS forecast 19.3% |
| Competitive Position | 9/10 | ROIC-WACC spread +3.2%, wide moat (network effects + switching costs) |
| Management Quality | 8/10 | 9.01% insider ownership, disciplined restructuring post-2022 |
| Valuation | 7/10 | PE 27.69, Forward PE 25.78, PEG 1.49 — not cheap but reasonable |
The AI correctly identified that while ROIC-WACC spread of +3.2% is lower than a pure software company, it's highly acceptable for Amazon's capital-intensive infrastructure model. Every dollar Amazon invests in AWS data centers and fulfillment centers generates returns above its cost of capital.
Case Study 2: Berkshire Hathaway (BRK.A) — Risk-Reward Analysis
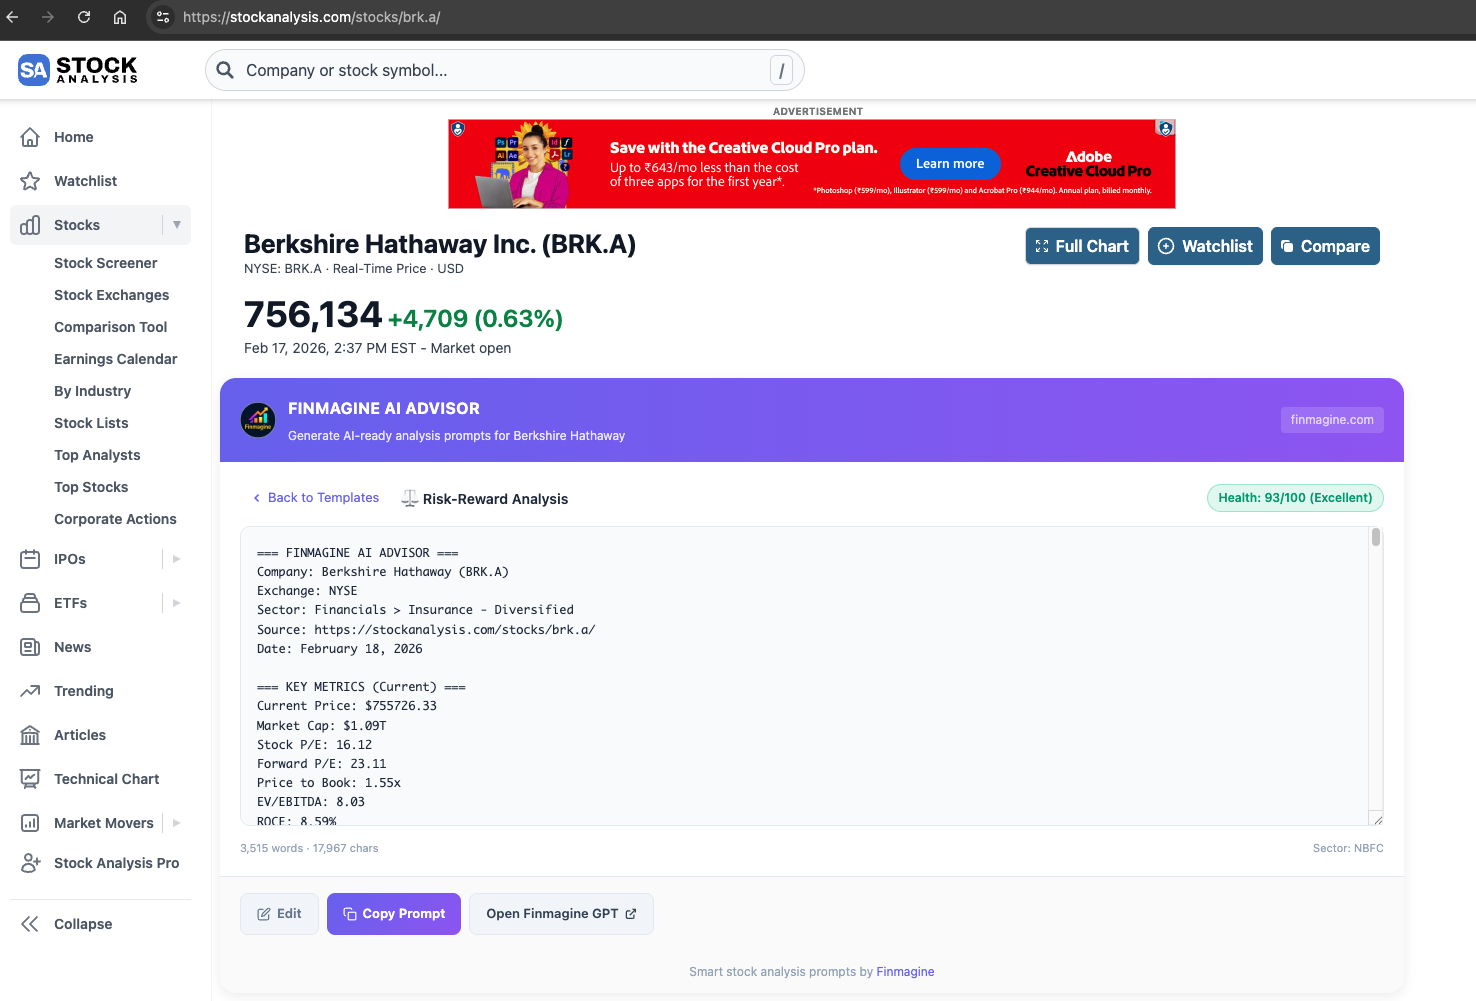
Health Score: 100/100 (Exceptional)
Berkshire was classified as a Capital Preservation Compounder with a weighted score of 8.0/10.
| Scenario | Probability | Drivers | 12–18M Return |
|---|---|---|---|
| Bull | 25% | Investment gains rebound, insurance pricing strong, buybacks accelerate | +15% to +25% |
| Base | 50% | Stable underwriting, moderate investment returns | 0% to +8% |
| Bear | 25% | Market drawdown, insurance losses, earnings compression | -15% to -25% |
The most fascinating aspect of the Berkshire analysis was the Z-Score handling. Berkshire's Z-Score was 2.88 — technically in the "Grey Zone" that borders financial distress. A naive system would have flagged this as a major red flag for a company sitting on $334 billion in cash.
But the extension's sector-aware engine recognized Berkshire as an insurance/financial holding company. Insurance companies carry massive float liabilities by design — it's their business model. The AI explicitly stated: "The Altman Z-Score Grey Zone classification reflects large insurance liabilities and mark-to-market accounting volatility. Given the net cash position of +$203.4 billion, distress risk appears low despite the Grey classification."
ROIC-WACC Spread: +9.03% — Exceptional capital efficiency. Even with Berkshire's conservative posture, every dollar invested generates returns far above the cost of capital. The AI used this as the primary input for the Capital Preservation classification.
Case Study 3: PDD Holdings (PDD) — Quarterly Deep-Dive
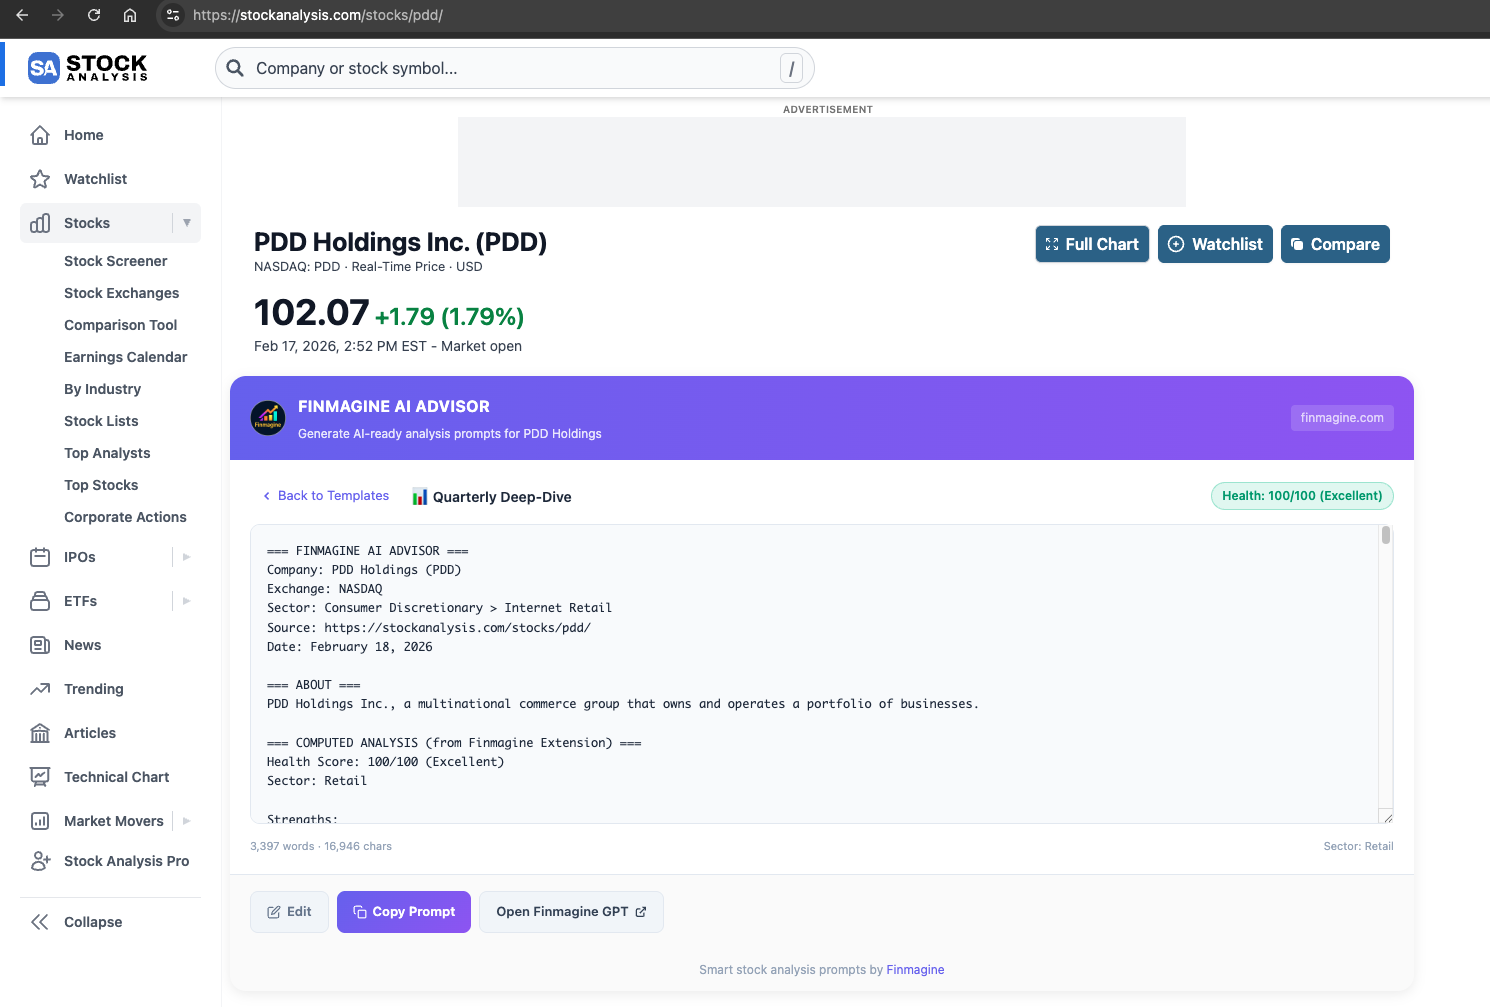
Health Score: 100/100 (Exceptional)
PDD was classified as a Value-Growth Hybrid with a weighted score of 8.8/10 — the highest of our three case studies. But the story underneath was far more nuanced than the headline score suggests.
The Quarterly Deep-Dive template captured a dramatic growth deceleration trajectory:
| Quarter | YoY Revenue Growth | Operating Margin |
|---|---|---|
| Q1 2024 | 130.66% | 25.22% |
| Q2 2024 | 85.65% | 33.55% |
| Q3 2024 | 44.33% | 24.36% |
| Q4 2024 | 24.45% | 24.83% |
| Q1 2025 | 10.21% | 16.81% |
| Q2 2025 | 7.13% | 24.80% |
| Q3 2025 | 8.98% | 23.11% |
From triple-digit growth to single digits in 18 months. Margin compression from 33.55% peak to 23.11%. This is the classic trap for growth stock investors: the PE ratio (10.48x) looks incredibly cheap, but only if growth re-accelerates. If growth is permanently stuck at 8–9%, then 10.48x is just fair value — possibly expensive given geopolitical risks.
The AI correctly identified this tension: "PDD's quarterly momentum shows growth normalization but sustained profitability strength. If growth stabilizes near 8–12% while maintaining >20% operating margins, current valuation appears attractive. The stock remains a high-quality value-growth hybrid, but hypergrowth days appear behind it."
Comparing the Three Case Studies
| Company | Template | Classification | Composite | Key Metric |
|---|---|---|---|---|
| AMZN | Comprehensive | Core Compounder | 8.2/10 | ROIC-WACC +3.2% (infra-adjusted) |
| BRK.A | Risk-Reward | Capital Preservation | 8.0/10 | Net cash +$203B, Z-Score contextualized |
| PDD | Quarterly | Value-Growth Hybrid | 8.8/10 | Growth deceleration 131% → 9% |
Three very different companies, three different templates, three different investment stories — all analyzed through the same consistent Five-Parameter Framework. This is the power of standardized methodology: you can compare a tech infrastructure giant, a financial conglomerate, and a Chinese e-commerce company on the same analytical plane.
Privacy, Security & Trust
When a browser extension reads financial data, privacy concerns are legitimate. Here's why the Finmagine AI Advisor is architecturally different from most extensions:
Local-First Processing
Extraction, analysis, and prompt generation all happen in your browser. Your research flow is:
stockanalysis.com → Your Browser (extraction + analysis) → Your Clipboard → Your AI Chat
Your research habits, prompts, and AI conversations are entirely your own — never sent to Finmagine. Stock fundamentals (ROCE, sector, etc.) extracted from pages you visit are passively contributed to Finmagine's shared cache to improve load speed for all users.
Privacy by Design
- No analytics: No Google Analytics, no Mixpanel, no event tracking
- No personal tracking: The extension doesn't track which stocks you research or build a profile
- No account: No login, no registration, no email collection
- Fundamentals cache: Stock metrics from pages you visit are contributed anonymously to Finmagine's shared cache — no personal data involved
Chrome Manifest V3 Security Model
The extension uses Chrome's latest Manifest V3 security model with minimal permissions. Host permissions cover screener.in, stockanalysis.com, and finmagine.com (for the shared fundamentals cache). No access to browsing history, bookmarks, or other tabs.
Tips, Tricks & Power User Guide
Edit Prompts Before Copying
Click the Edit button to toggle the prompt textarea between readonly and editable mode. You can add specific questions, remove sections you don't need, or adjust the analysis focus before copying. Your edits persist until you regenerate or switch templates.
Use Any AI Assistant
While the prompts are optimized for the Finmagine Extension Analyst GPT, they work with any AI model. The structured format and explicit instructions ensure high-quality output regardless of which assistant you use. Try ChatGPT, Gemini, or any other conversational AI.
Combine with Finmagine Chart Builder
For the ultimate research workflow: use the Chart Builder to visualize the financial trends, then use the AI Advisor to generate the analysis prompt. Visual pattern recognition (charts) combined with structured analytical reasoning (AI) gives you both the intuitive and the rigorous perspectives.
Template Selection Guide
| Your Question | Best Template | Why |
|---|---|---|
| "Should I buy this stock?" | Risk-Reward | Explicitly models upside/downside scenarios |
| "Tell me everything about this company" | Comprehensive | Full 360-degree view |
| "How was the latest quarter?" | Quarterly | Sequential trends and recent momentum |
| "Annual review of my holdings" | Comprehensive | Complete reassessment |
| "Is this turnaround real?" | Risk-Reward | Quantifies asymmetry between recovery and decline |
Understanding AI Confidence Levels
The AI's confidence is highest when multiple signals align: strong health score + positive ROIC-WACC spread + Buy consensus + high F-Score. When signals diverge (e.g., strong fundamentals but analyst downgrades), the AI will explicitly flag the disagreement. Pay special attention to these divergence moments — they're often where the best investment insights hide.
The Data Quality Constraints Block
Every prompt includes a constraints section that instructs the AI to: flag any data gaps or inconsistencies, avoid hallucinating numbers not present in the data, apply sector-specific context, and distinguish between reported facts and forward-looking estimates. This acts as a guardrail against the most common AI failure modes.
The Future — What's Next

Planned for Future Versions
- Google Finance Support: Bringing the AI Advisor to Google's stock pages for broader accessibility
- Additional AI Platforms: Direct integration with Perplexity, Gemini, and other AI assistants beyond ChatGPT
- More Prompt Templates: ESG analysis, competitive positioning, detailed DuPont decomposition, and dividend sustainability templates
- Peer Comparison Prompts: Generate prompts that compare 2–3 companies side-by-side for relative valuation
- Earnings Preview Mode: Pre-earnings analysis with consensus expectations and historical beat/miss patterns
- Chart Builder Integration: Deep linking between the AI Advisor and Chart Builder extensions for a unified research workflow
- Additional Exchanges: Support for LSE, TSX, ASX, and other international stock markets
The Finmagine AI Advisor is evolving from a single-purpose prompt generator into a comprehensive research companion that covers the full investment analysis lifecycle. Every update is driven by the same core principle: real data in, expert analysis out.
Your Turn — Start Analyzing
The barrier to performing institutional-quality stock analysis has fundamentally collapsed. What used to require a Bloomberg terminal, a team of analysts, and 30 minutes of manual data gathering now happens with a single click in your browser.
What You've Learned:
- How the AI Advisor extracts data from 10 pages in staggered batches
- What Altman Z-Score, Piotroski F-Score, and ROIC-WACC spread reveal about a company
- How 145 GICS industries map to sector-aware analysis profiles
- The Five-Parameter Scoring methodology and investment classifications
- Real case studies: AMZN (Core Compounder), BRK.A (Capital Preservation), PDD (Value-Growth Hybrid)
- Why privacy-first architecture matters for financial research
Install the extension: Search for "Finmagine AI Advisor" on the Chrome Web Store or visit finmagine.com for more tools and resources.
Explore the Complete AI Advisor Hub
Discover all AI Advisor resources — analysis templates, sector-aware intelligence, health scoring, the Five-Parameter methodology, and everything you need to transform any stock page into institutional-grade research.
Visit AI Advisor Hub →Free Chrome Extension
Ready to try this yourself?
Install the Finmagine AI Advisor and generate institutional-grade research prompts from any Screener.in or stockanalysis.com company page in seconds.
Install from Chrome Web Store →No account required • Works on Chrome, Edge, Brave, Opera