Following along? Open the live page
Finmagine — free to explore • premium for full access • no app needed
After reading this guide you will be able to:
- Understand what the Ask AI tab is — and what it is not
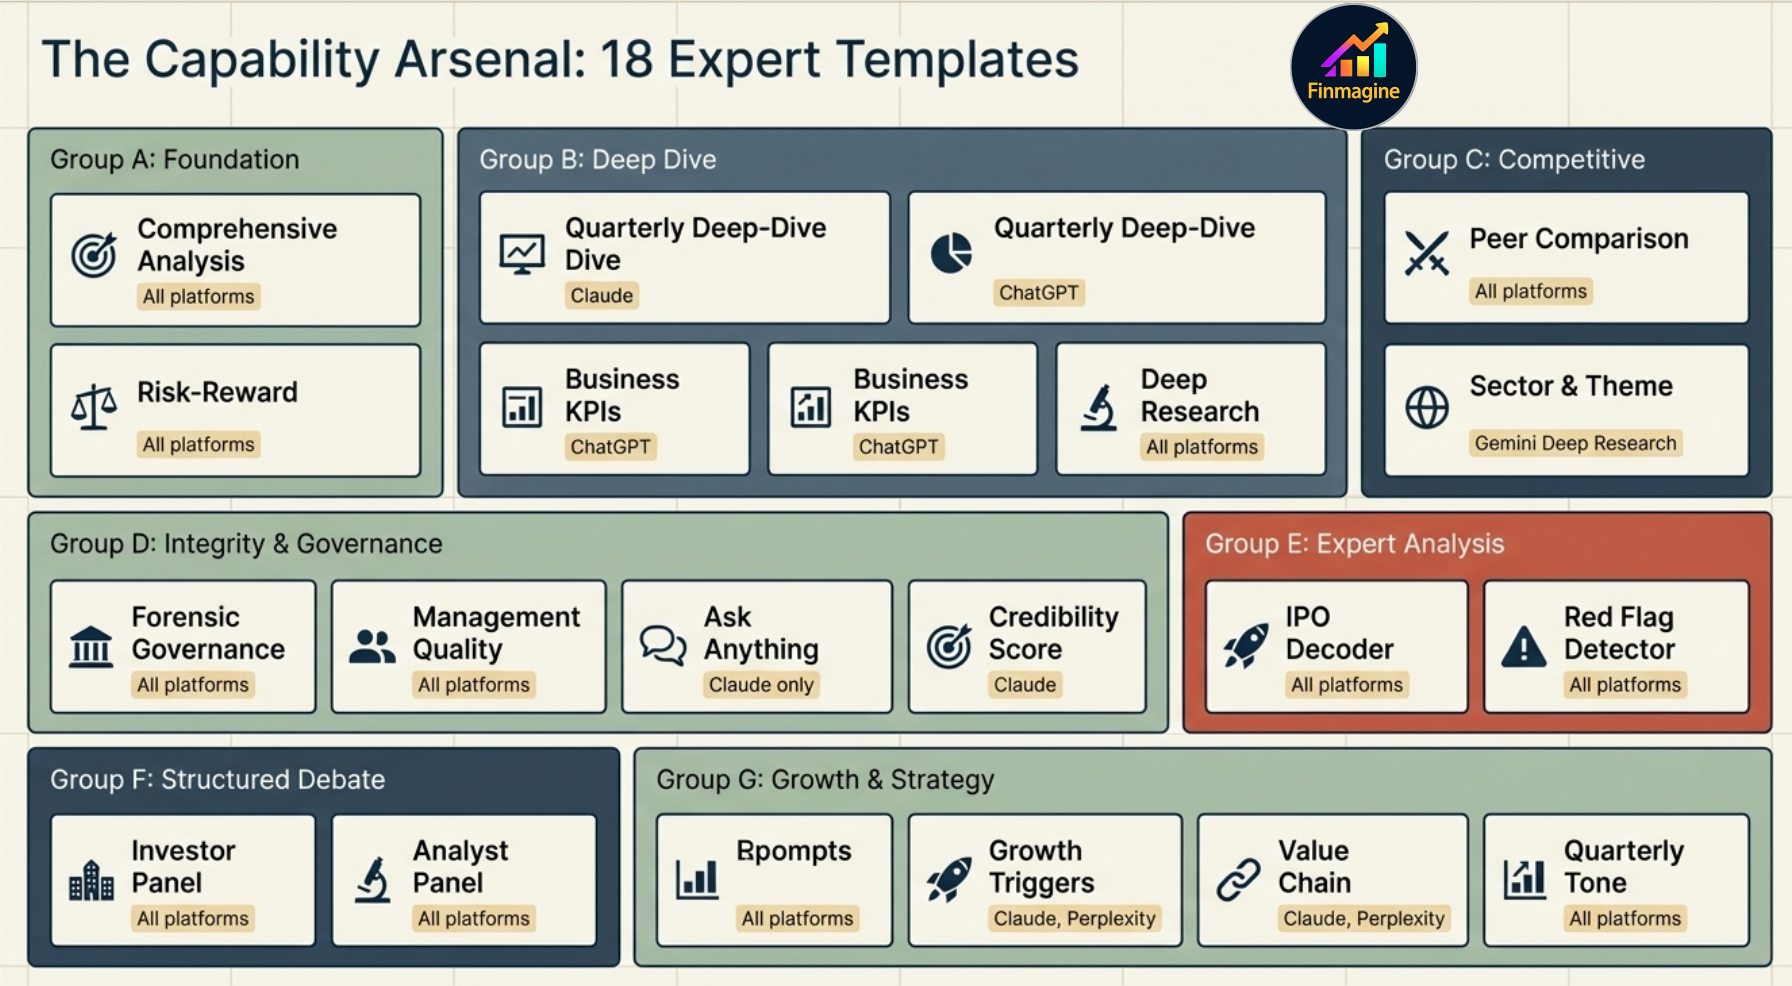
- Know all 18 templates, what each does, and which AI platform to use for each
- Understand the Intelligence Block and why it makes Web App prompts sharper than the Chrome extension
- Use the Stage 2 → Growth Triggers cross-product flow
- Know when to use Claude, Gemini, Perplexity, or ChatGPT for each template
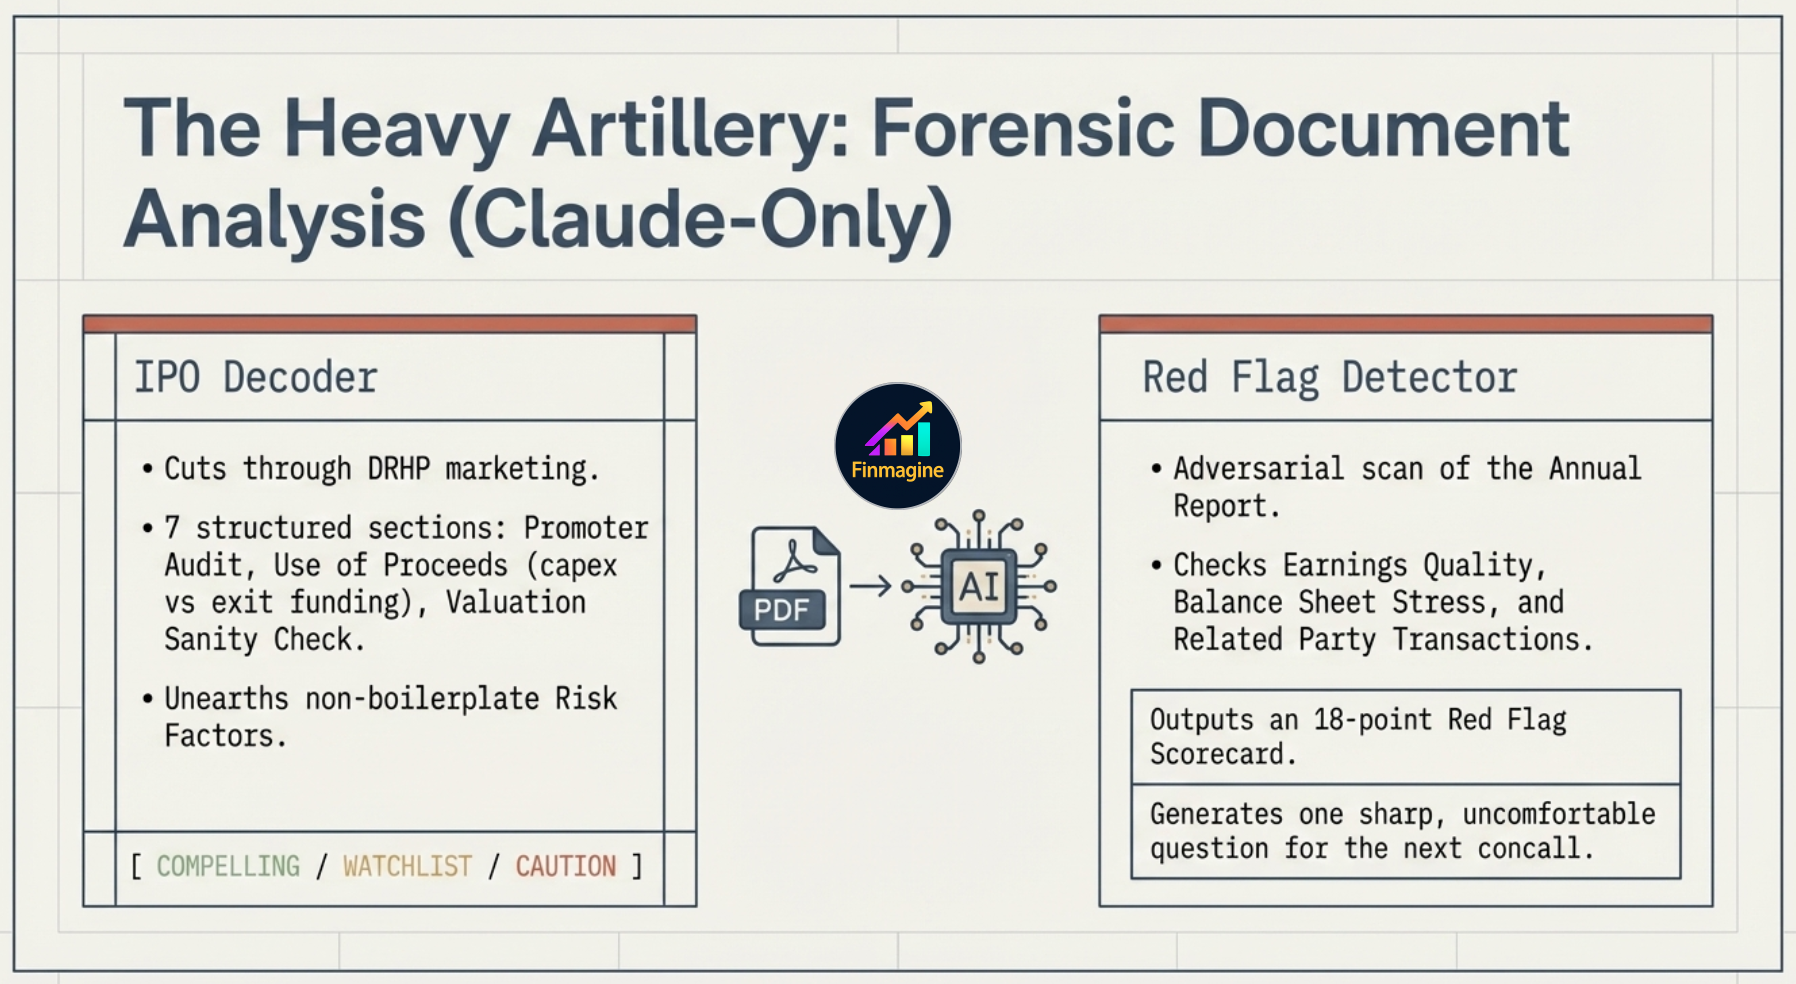
- Understand the new Expert Analysis templates — IPO Decoder and Red Flag Detector
Why AI Stock Analysis Fails (And How to Fix It Like a Pro)
Why most investors get generic, useless output from AI — and exactly how the structured prompt library, Intelligence Block, and platform routing solve it at a fundamental level.
🎧 The AI Advisor Deep Dive
A deep-dive conversation on the Finmagine Ask AI — covering the Intelligence Block, template selection by use case, platform recommendations, the Stage 2 cross-product flow, and forensic document analysis with IPO Decoder and Red Flag Detector.
Approx. 15–20 minutes · Financial education podcast · No investment advice
What Is the Ask AI Tab?
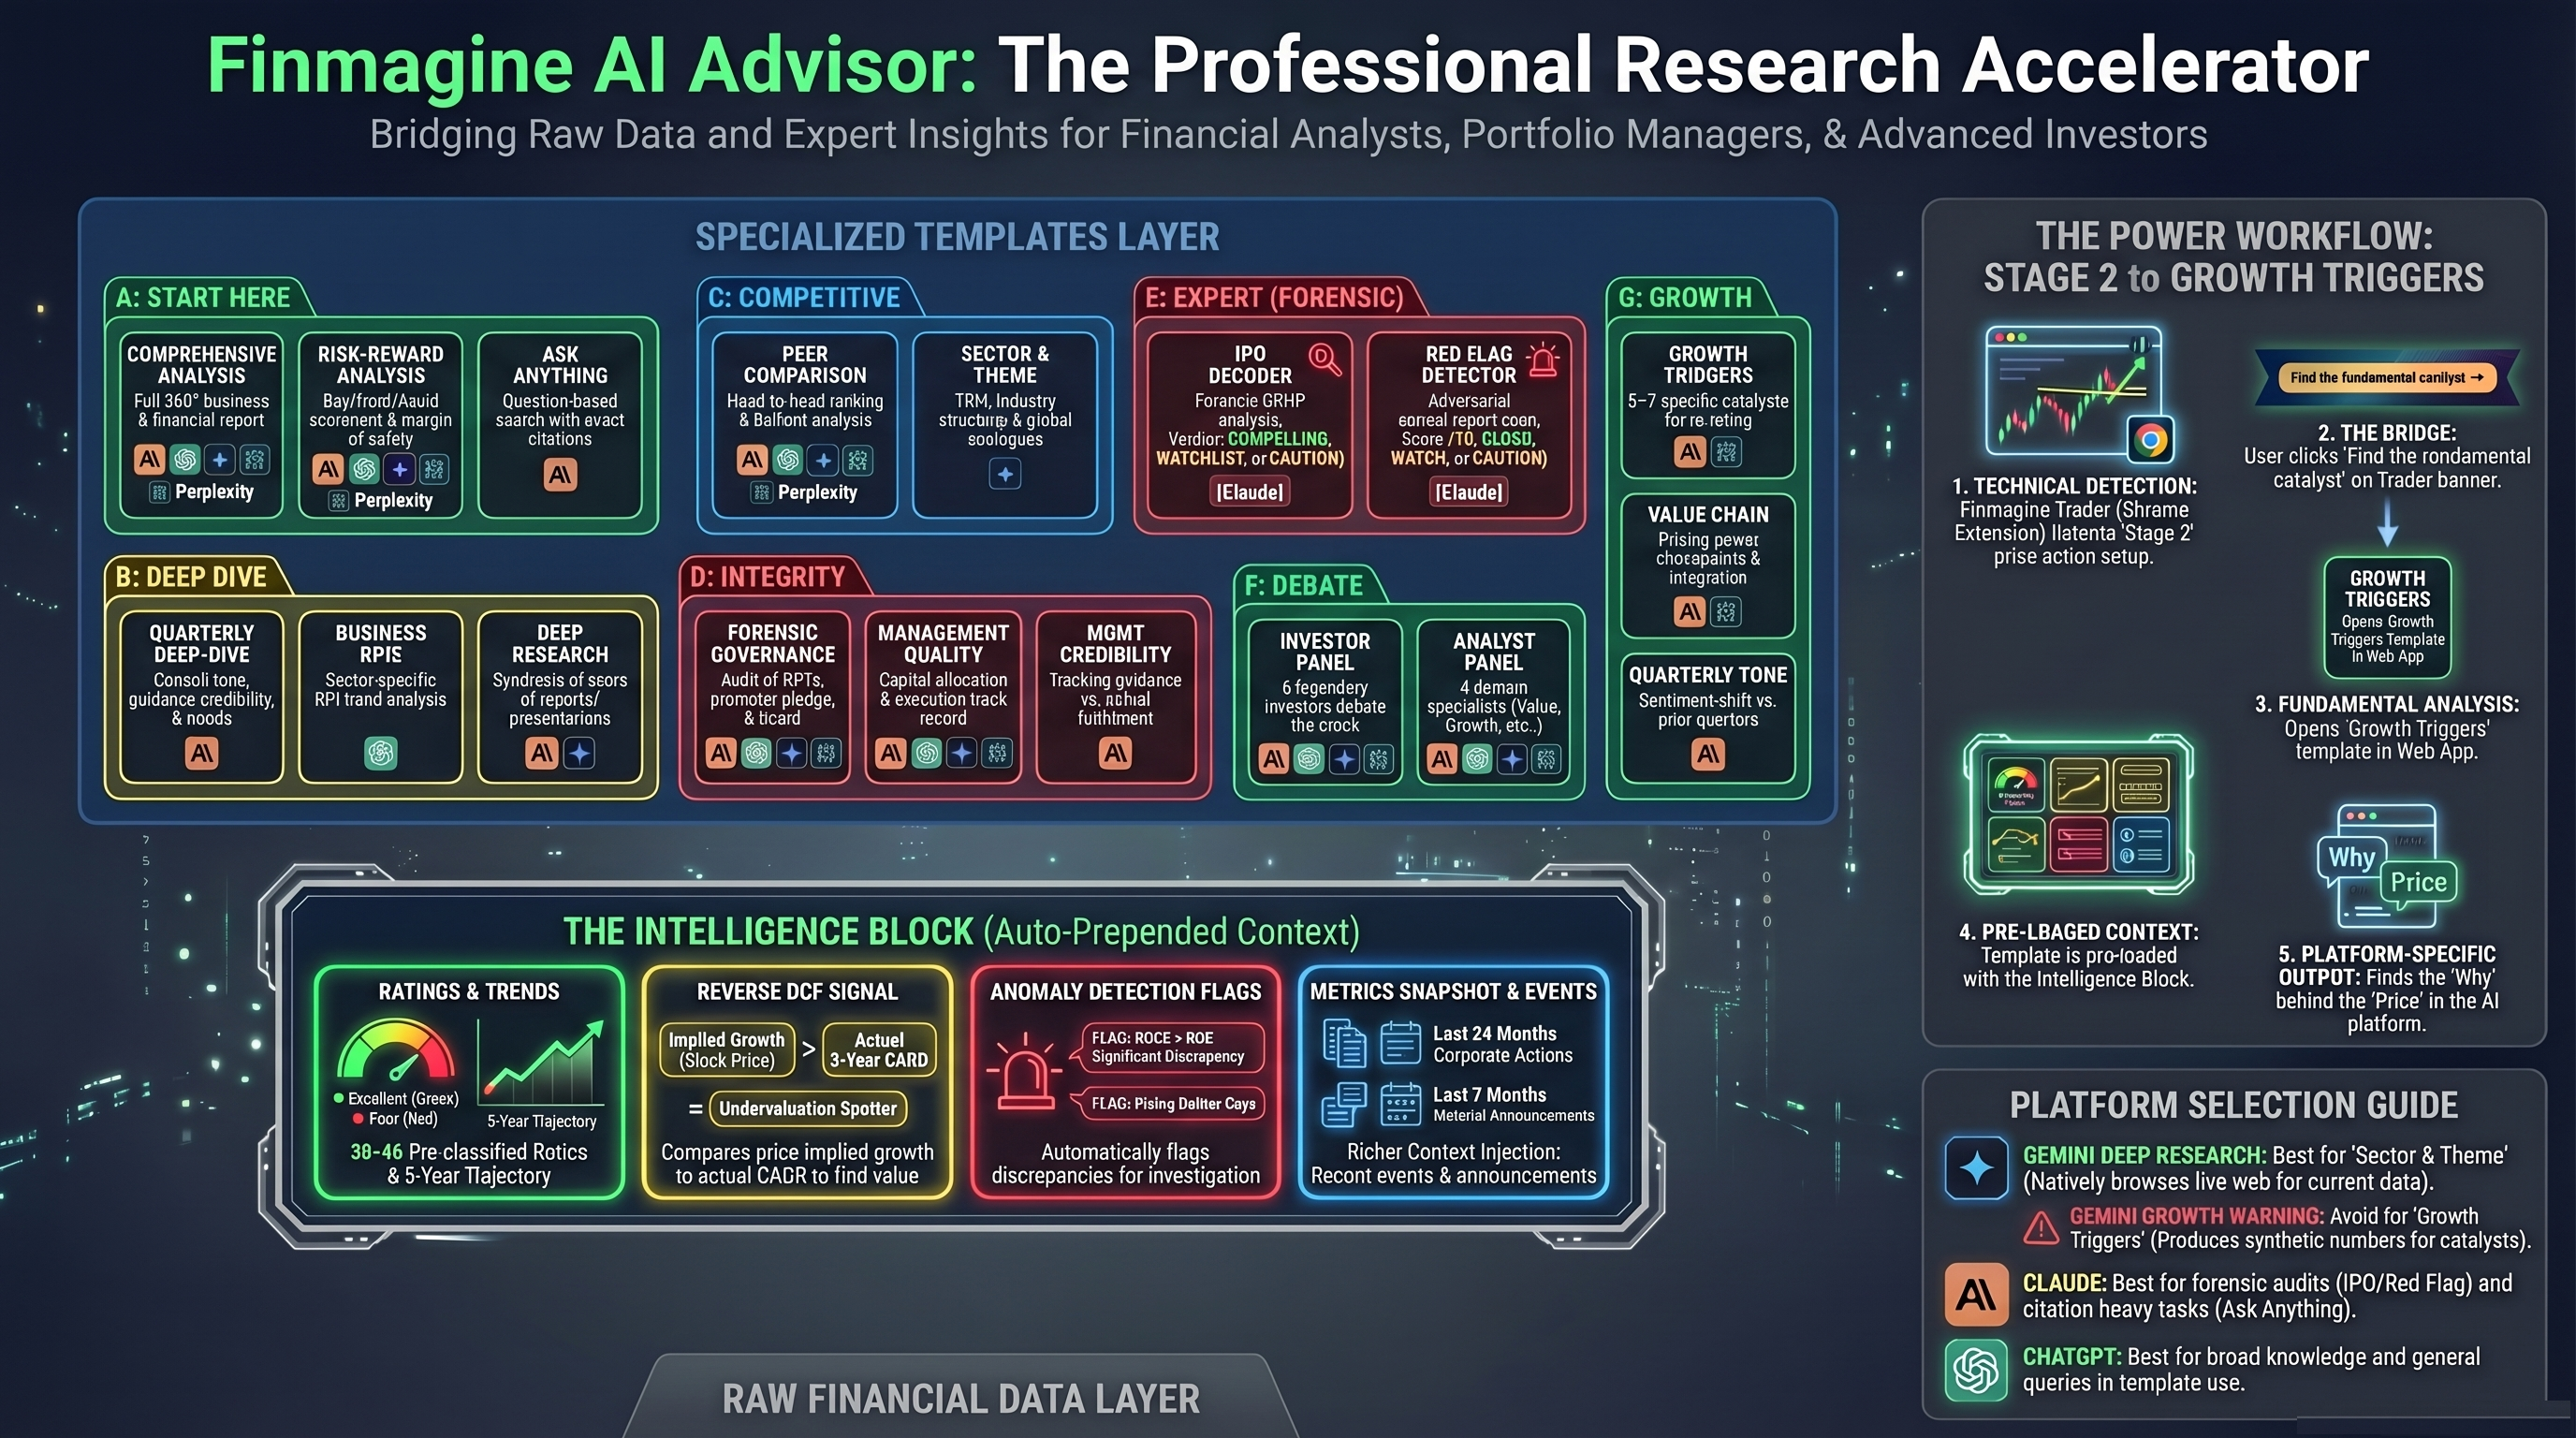
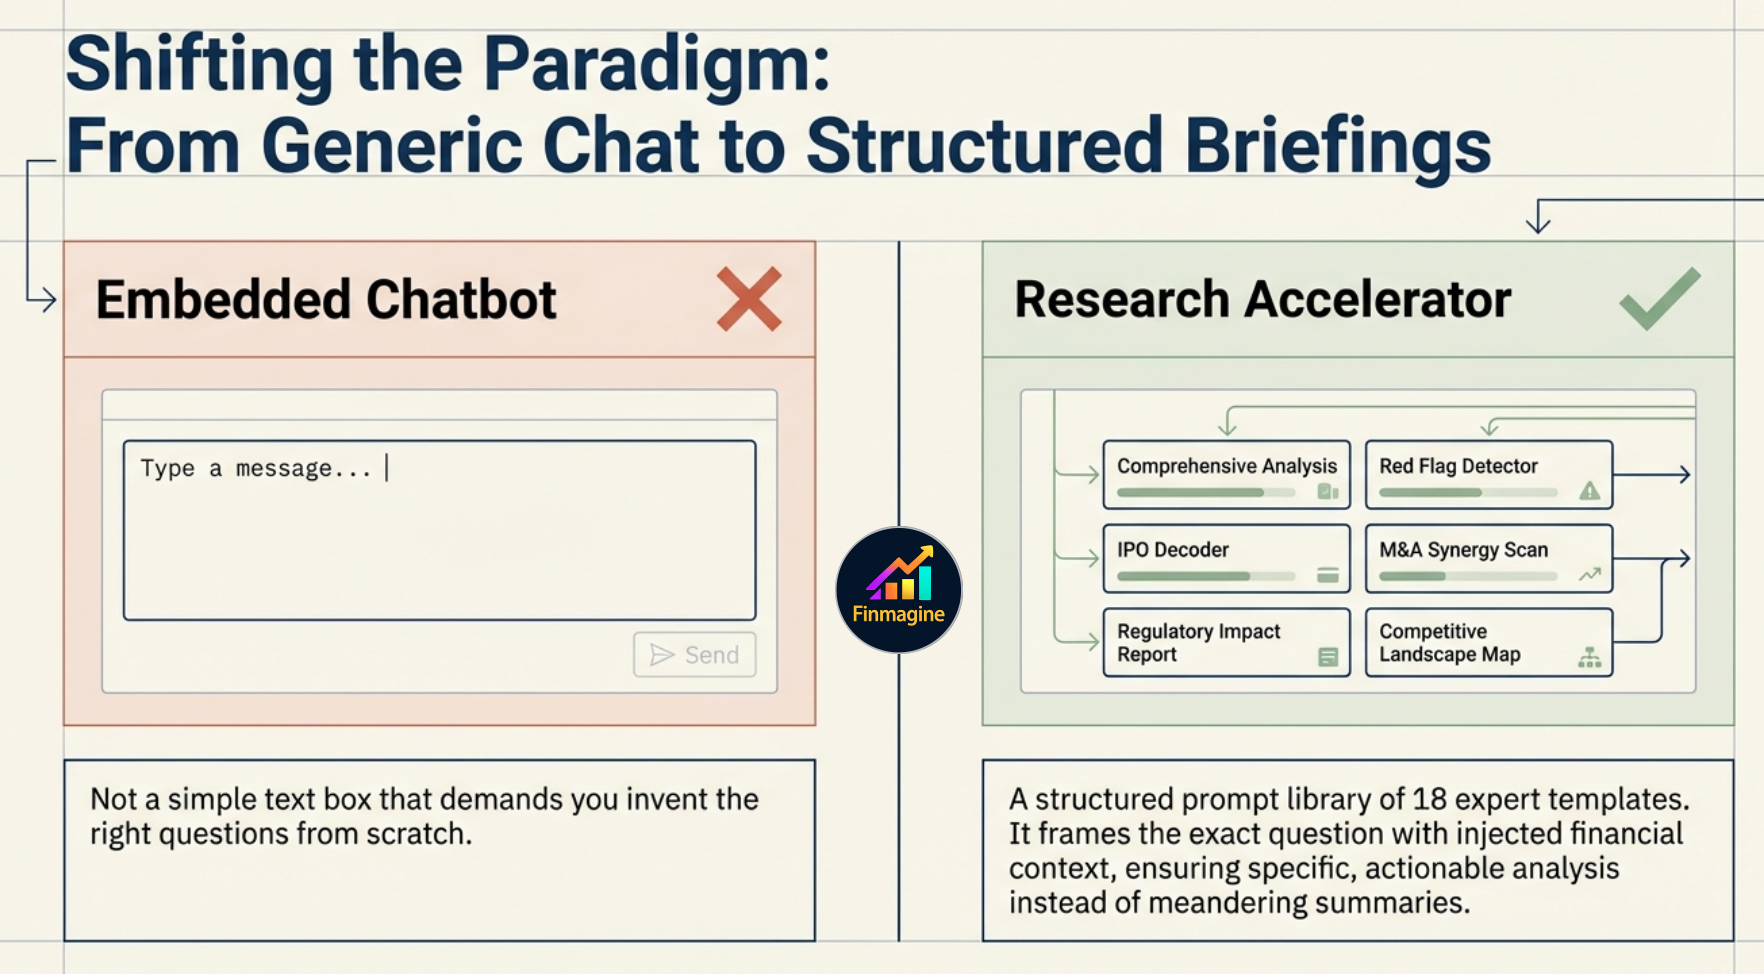
The Ask AI tab is a structured prompt library — 18 expert templates that turn the company data on your screen into a precise, context-rich brief ready to paste into Claude, ChatGPT, Gemini, or Perplexity. It is not a chatbot embedded in the page. It is a research accelerator: it does the hard work of framing the right question with the right context, so the AI you use delivers analysis that is specific, structured, and actionable rather than generic and meandering.
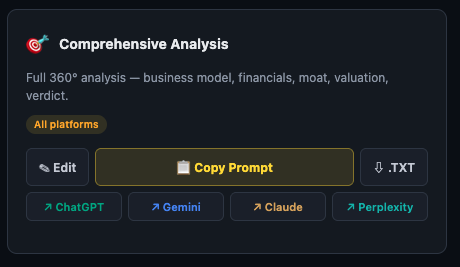
Each template card shows:
- Name and purpose — what question this template answers
- Best platform badge — which AI produces the best output for this template (Claude / Gemini / ChatGPT / Perplexity / All platforms)
- Copy Prompt — one click copies the full prompt to your clipboard
- .TXT — download the prompt as a text file
- Direct platform links — open ChatGPT, Gemini, Claude, or Perplexity directly
- Edit — customise the template before copying
The Intelligence Block — What Happens Before Your Prompt
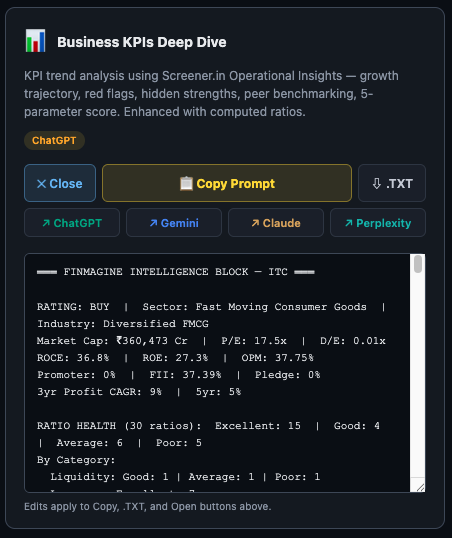
This is the most important thing to understand about the Premium Web App Ask AI. Before any template reaches the AI, Finmagine prepends an Intelligence Block — a structured context layer computed from the company's financial data. You do not write this. You do not copy it. It is automatically attached to every prompt.
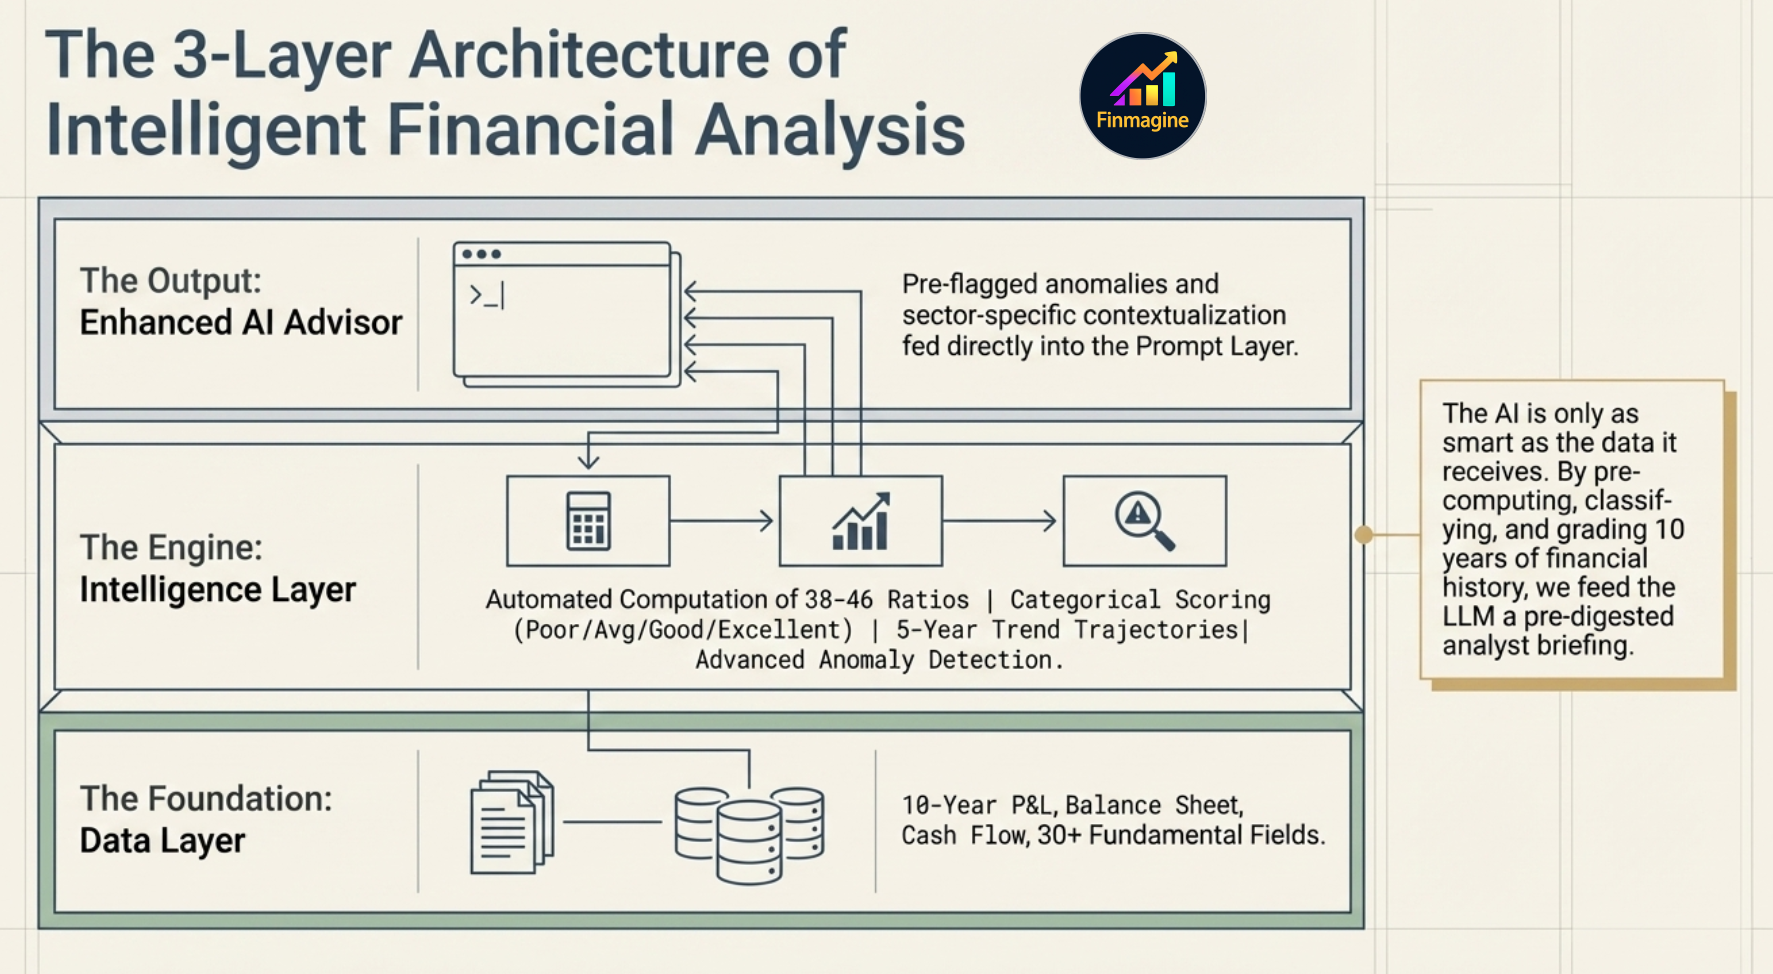
The Intelligence Block contains four components:
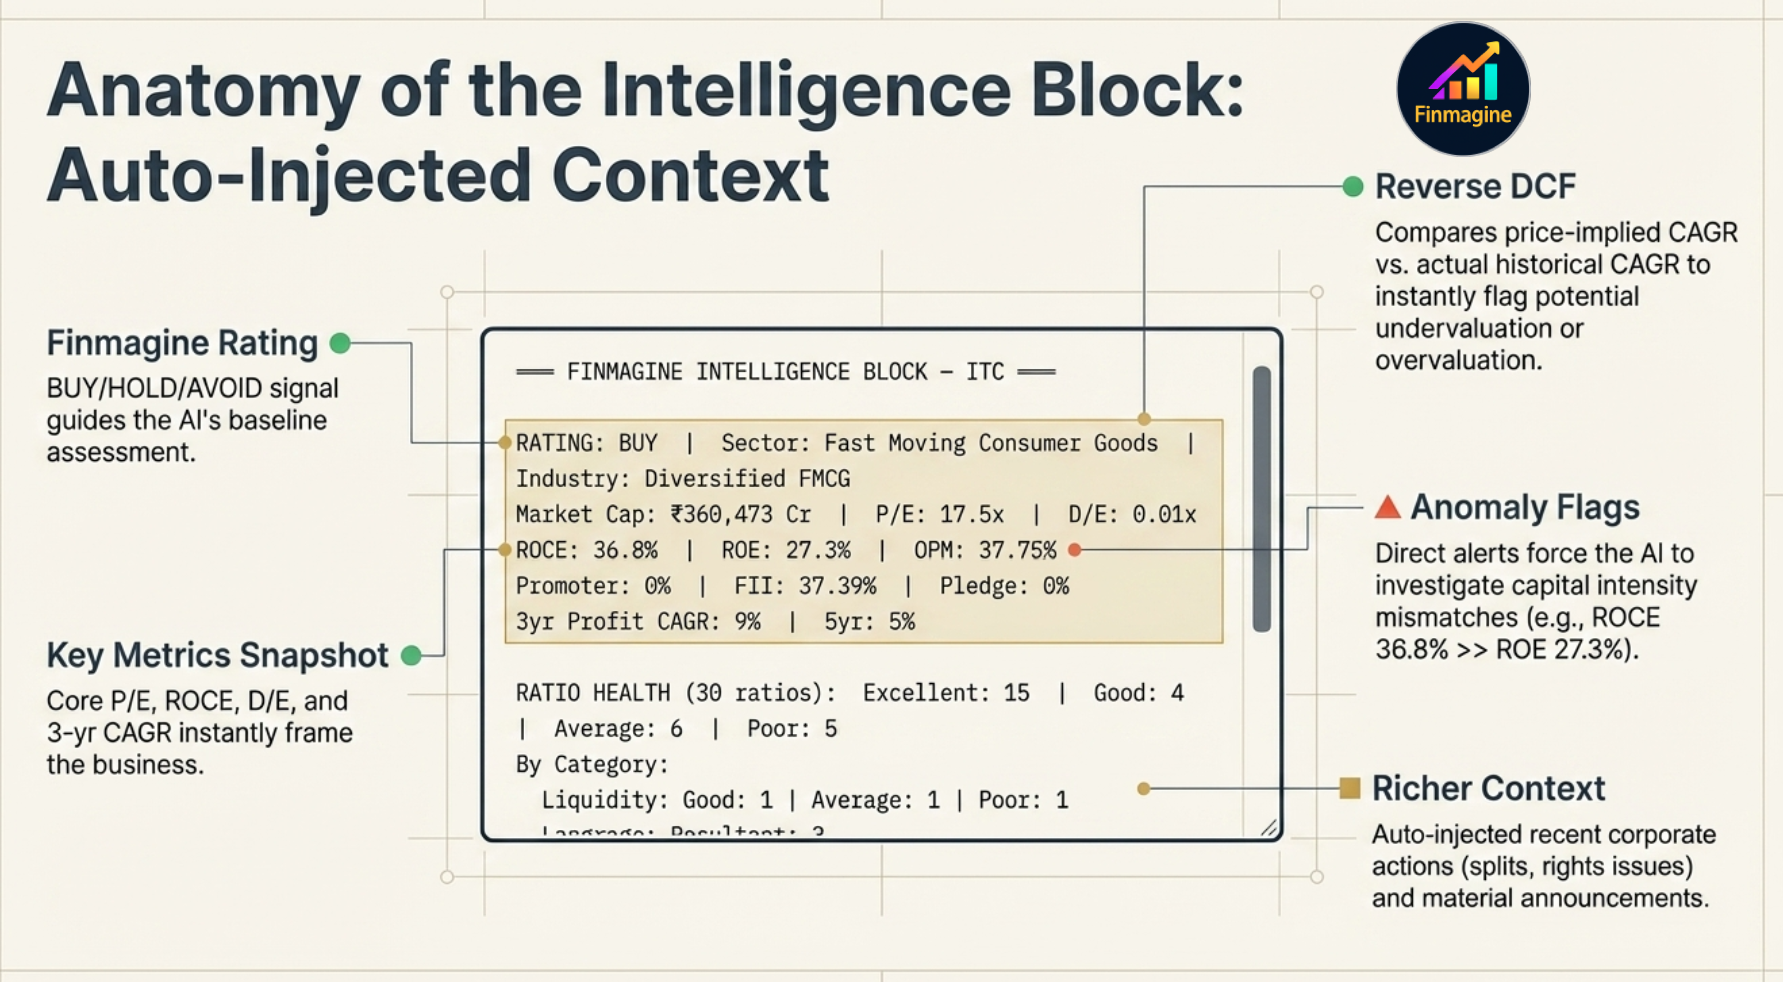
1. Finmagine Rating
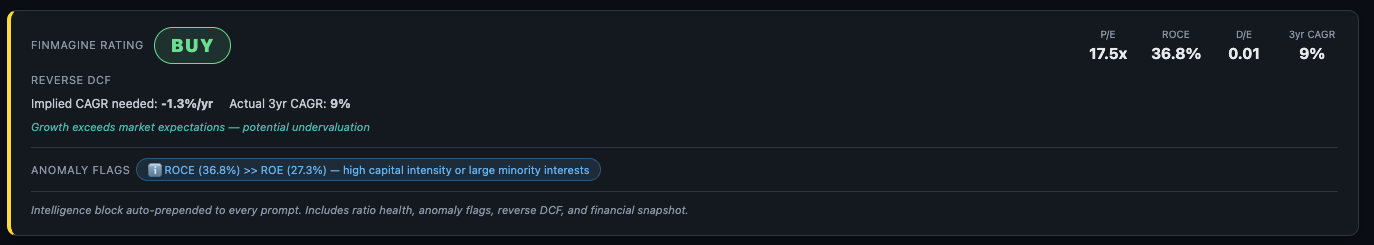
A BUY / HOLD / AVOID signal derived from the Scorecard and valuation metrics. This is not a recommendation — it is a structured signal that tells the AI the current overall assessment so it can weight its analysis accordingly.
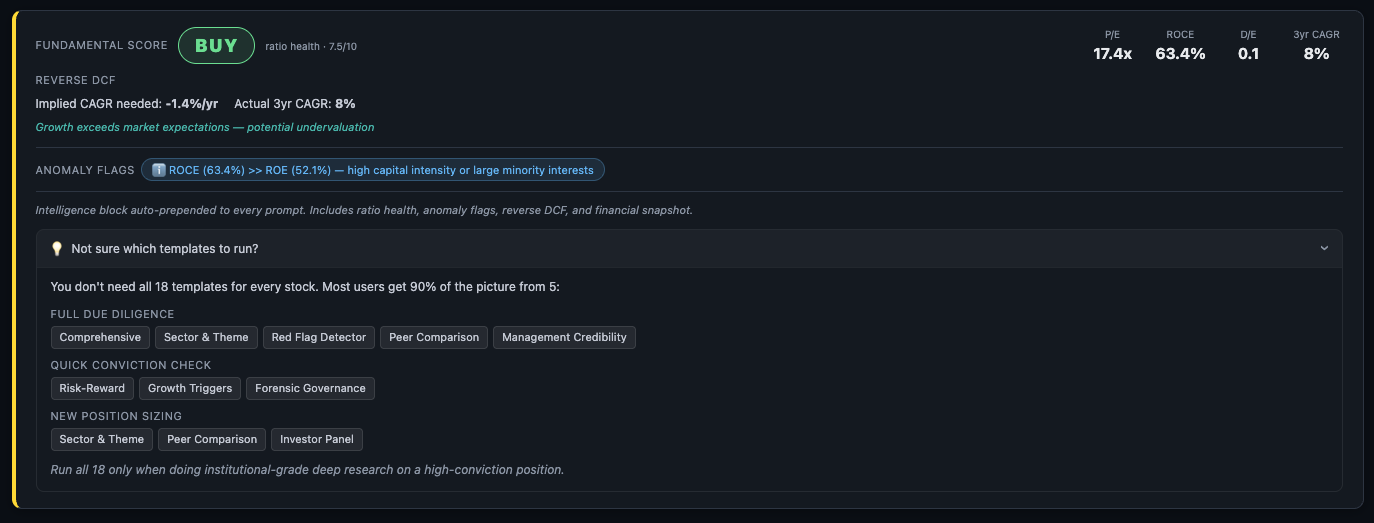
2. Reverse DCF
A Discounted Cash Flow model worked backwards from the current stock price. It calculates the growth rate the market is implying — and compares it to the company's actual historical growth rate. The gap between the two is the signal:
- Implied CAGR significantly below actual CAGR → market is pricing in deterioration that hasn't materialised → potential undervaluation
- Implied CAGR significantly above actual CAGR → market expects acceleration → priced for perfection
3. Anomaly Flags
Pre-computed alerts from the ratio analysis. Examples: "ROCE (36.8%) significantly exceeds ROE (27.3%) — high capital intensity or large minority interests", or "Debtor days rising 3 consecutive years — receivables quality deteriorating." These flags are passed directly to the AI so it investigates them rather than missing them.
4. Key Metrics Snapshot
A compact header showing P/E, ROCE, D/E, and 3-year revenue CAGR — the four numbers that most quickly characterise a business. The AI has these in context before reading a word of the template.
5. Richer Context — Auto-Injected Corporate Activity
Two additional data layers are now automatically injected into every prompt, giving the AI corporate activity context without any extra effort from you:
- Corporate Actions — last 24 months: QIB allotments, warrants, rights issues, bonus shares, stock splits, and dividends are extracted from the Screener page and included in the prompt. The AI can now flag dilution patterns, understand capital structure changes, and contextualise management's capital allocation signals.
- Significant Announcements — last 6–7 months: Instead of the most recent 10 filings (which often include routine updates), the system now filters for genuinely material events: board results, fundraising, acquisitions, CEO/MD changes, SEBI orders, buybacks, and major capacity announcements. The AI receives a curated feed of what actually matters, not a firehose of noise.
Why Premium Web App Ask AI Beats the Chrome Extension
The Finmagine Chrome extension (AI Advisor for Screener.in) uses the same prompt templates. So why bother with the Premium Web App? The answer is entirely in what gets sent alongside the template — the data layer underneath it.
| What the AI receives | Chrome Extension (CWS) | Premium Web App |
|---|---|---|
| Financial data source | Scraped from Screener.in — raw numbers | Finmagine's own 10-year DB — P&L, Balance Sheet, Cash Flow, Ratios |
| Ratio classification | None — AI classifies from raw numbers | 38–46 ratios pre-classified: Poor / Average / Good / Excellent |
| Trend analysis | None — AI infers trends from tables | 5-year trend computed per ratio: Improving / Stable / Declining |
| Anomaly detection | None — AI must spot anomalies itself | Pre-flagged: ROCE/ROE splits, liquidity vs profit mismatches, etc. |
| Reverse DCF | Not available | Computed from price vs DB financials — implied vs actual CAGR |
| Finmagine Rating | Not available | BUY / HOLD / AVOID signal included in context |
| Company documents | Links from Screener.in | Finmagine DB: concall URLs, annual reports, credit ratings |
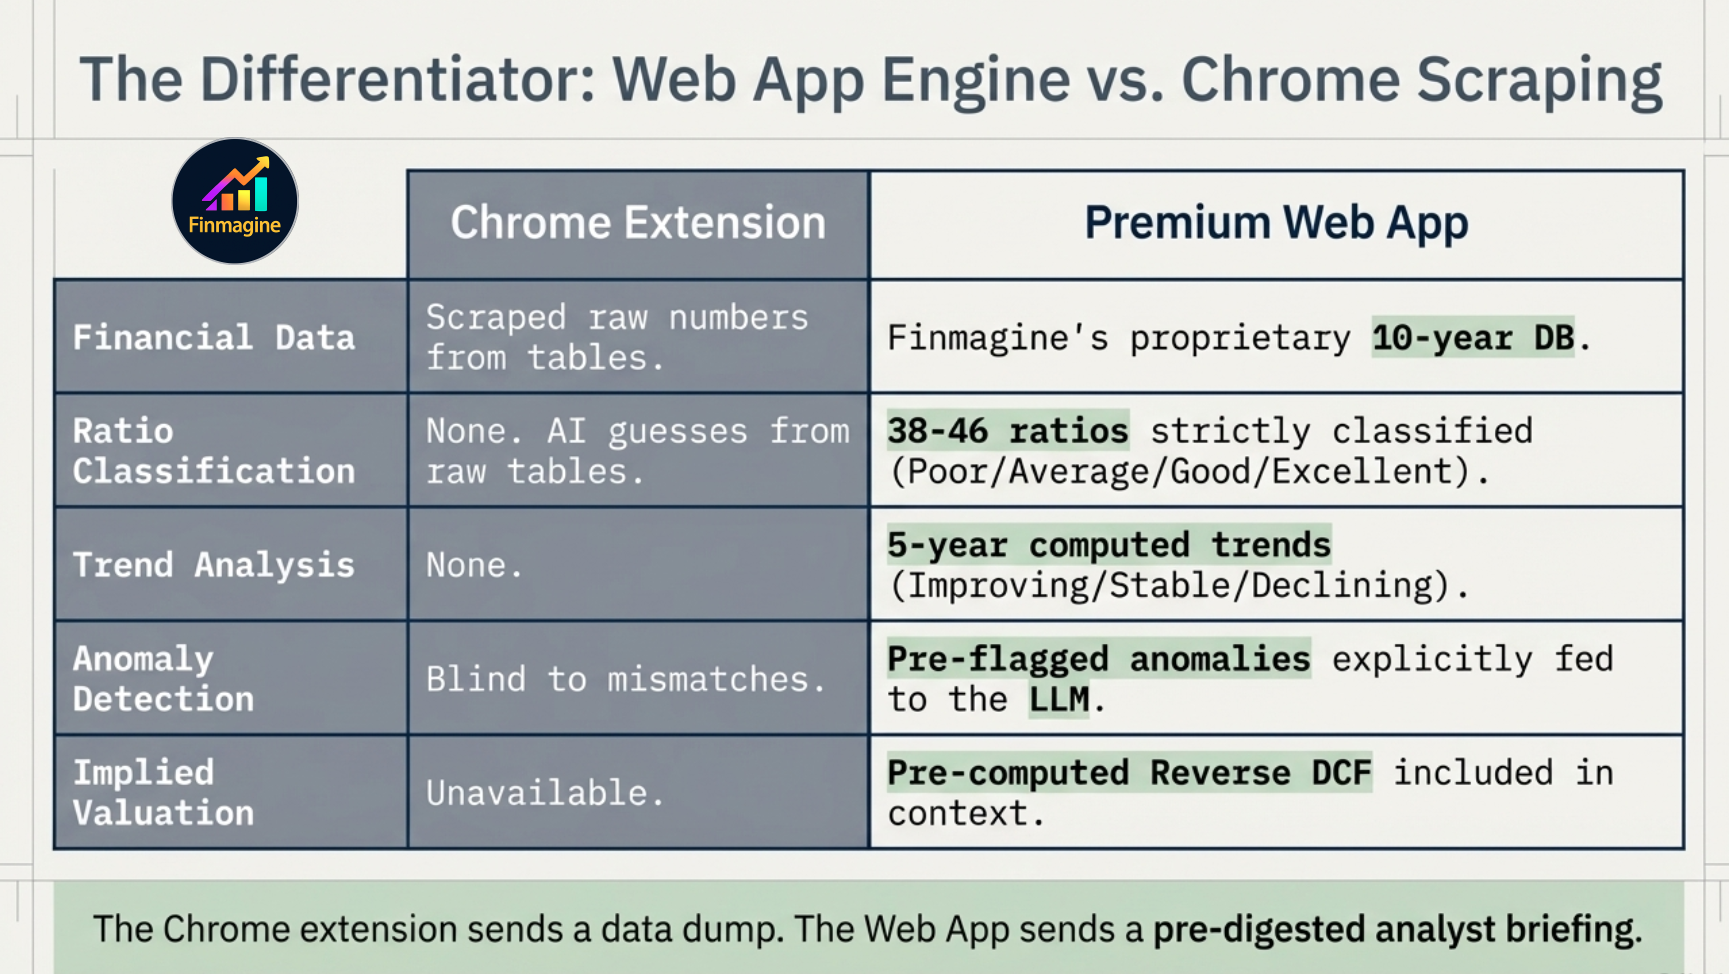
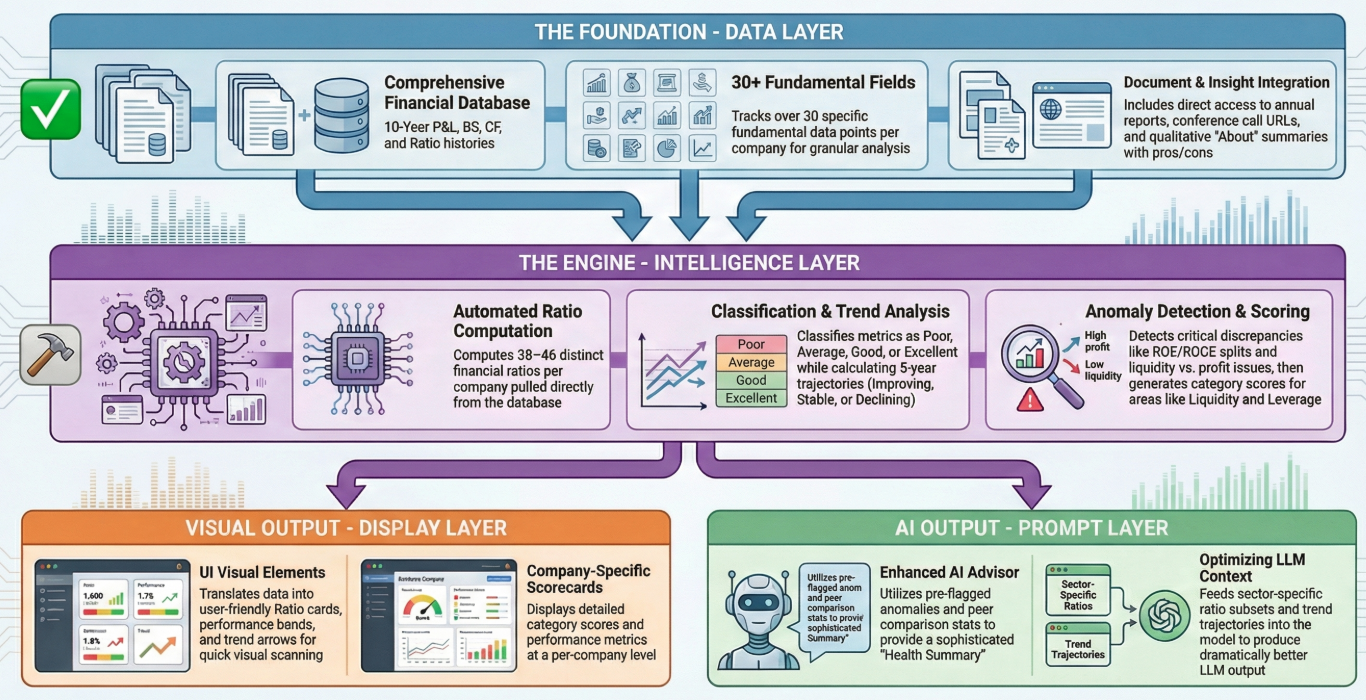
The practical consequence: the AI receives a pre-digested analyst briefing instead of a spreadsheet dump. It does not have to classify ratios — they are classified. It does not have to spot anomalies — they are flagged. It does not have to calculate valuation implied growth — it is computed. Every cycle of reasoning the AI would have spent on data processing is now spent on insight.
- Classification-level Screener — filter by ratio classification, not just raw numbers. "ROCE Excellent + D/E Good + OPM Improving" — no free tool does this at the classification level.
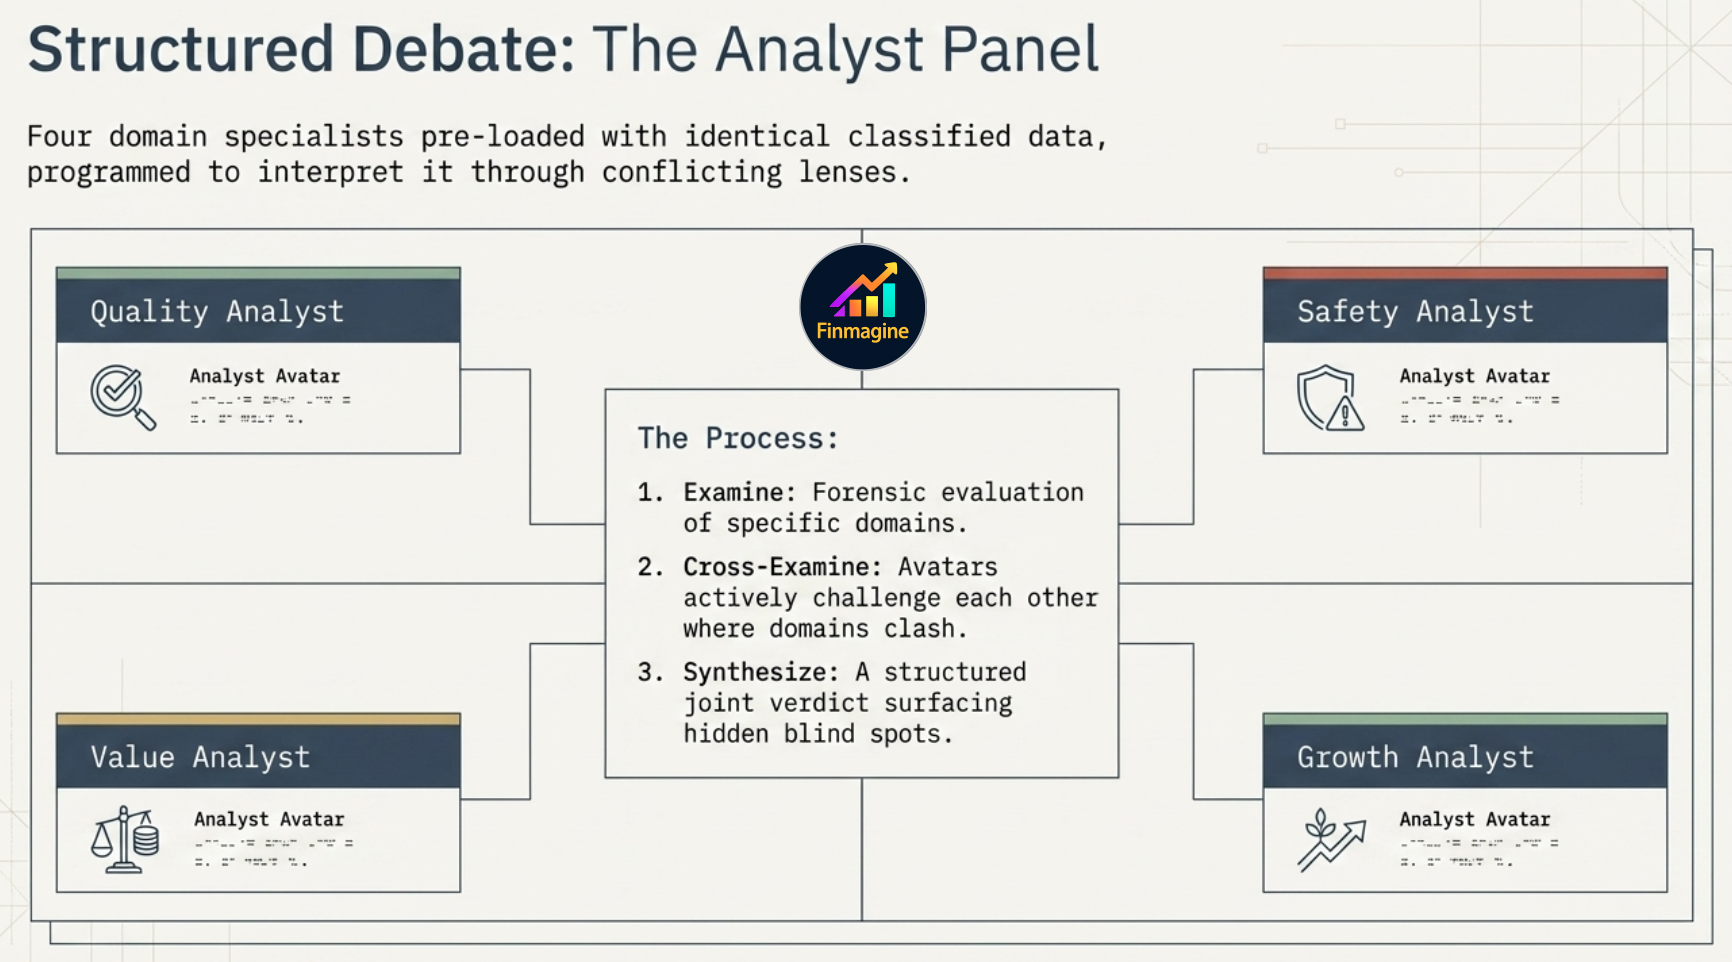
- Analyst Panel (4 personas) — Quality Analyst, Safety Analyst, Value Analyst, and Growth Analyst each pre-loaded with the same classified ratio data but weighted differently. Four lenses on every stock, rendered on demand. A retail Bloomberg Terminal — the same company viewed through four distinct investment philosophies simultaneously.
- Multi-period intelligence — not just the latest quarter, but ratio classification across 10 years. See whether "Excellent" ROCE is structural or a recent anomaly.
These features use the same Intelligence Layer already built for the Ask AI — the classified ratio data, trend detection, and anomaly flags. The Premium Web App is the only place they land.
The Stage 2 → Growth Triggers Flow
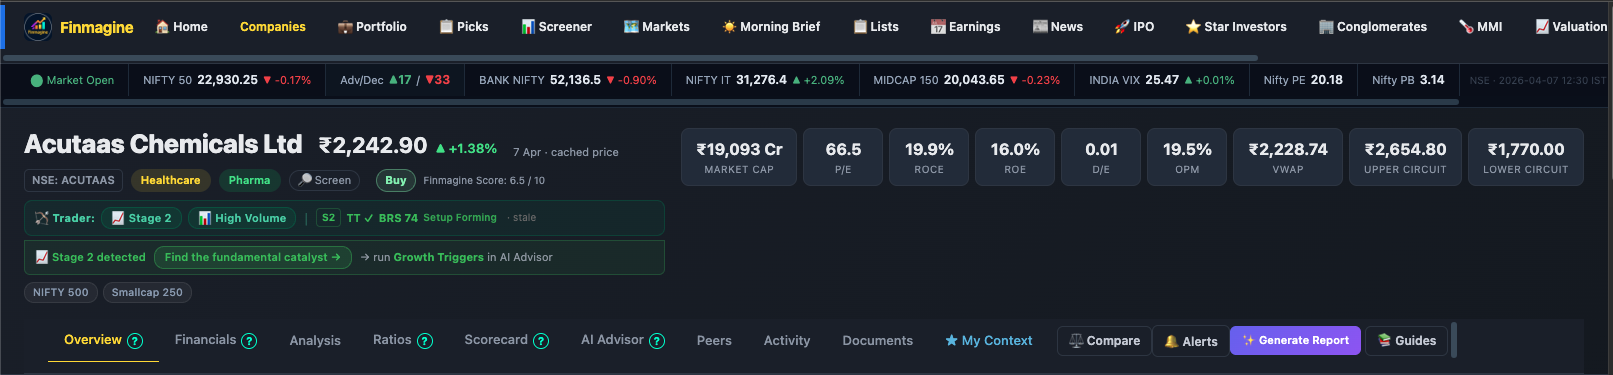
One of the most powerful cross-product integrations in Finmagine connects the Trader Chrome extension with the AI Advisor Web App. It bridges a technical signal (price action stage detection) with a fundamental research question (what is driving this setup?).
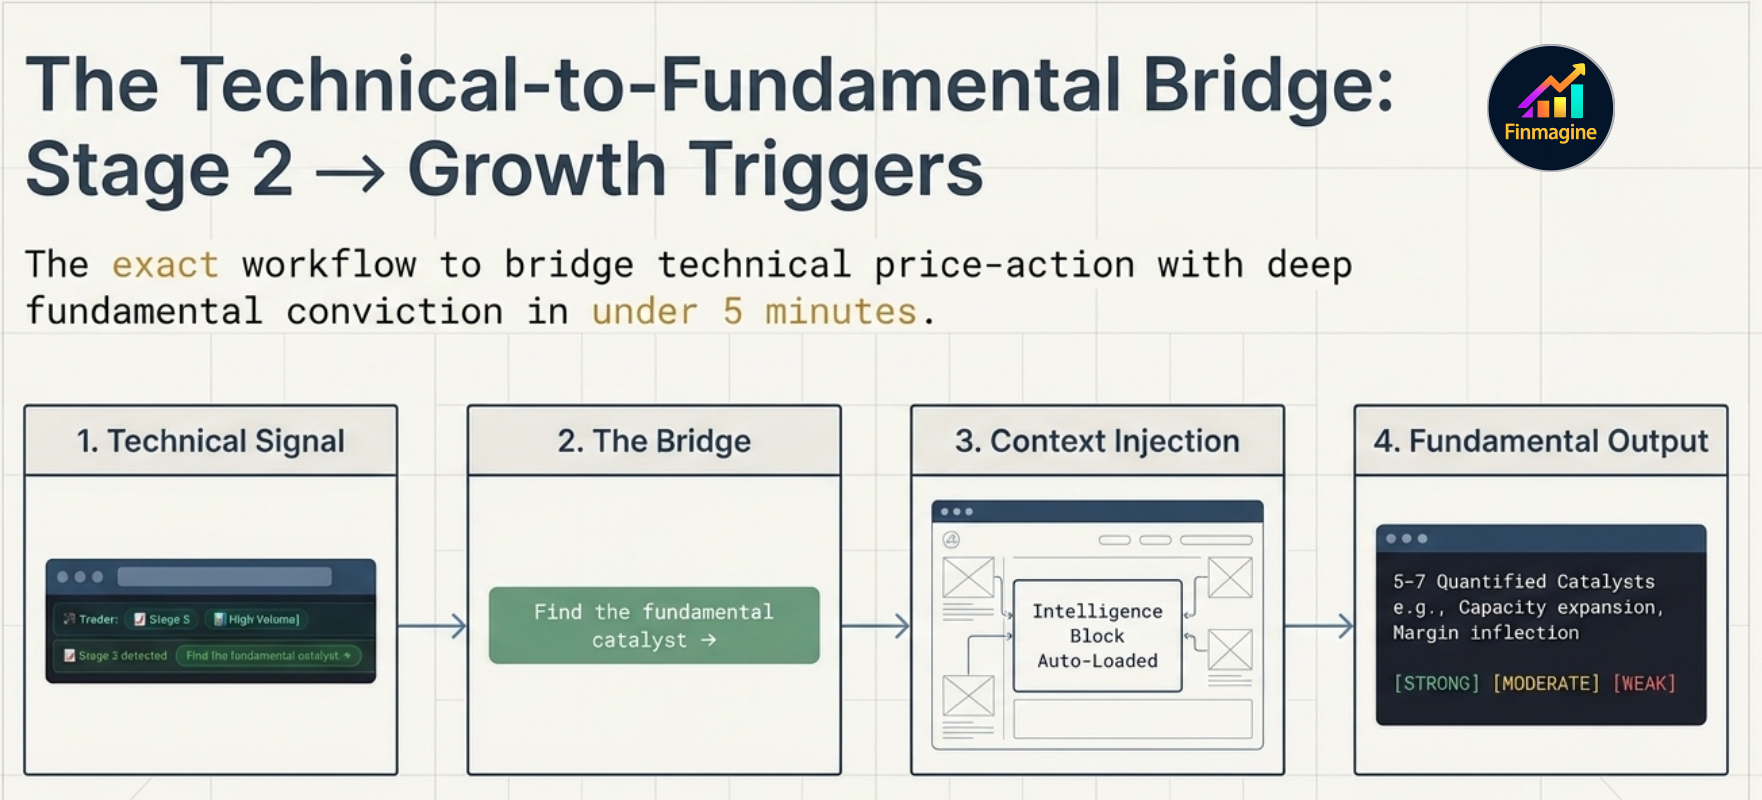
This is a complete research workflow in under 5 minutes: Trader surfaces the technical setup → Ask AI explains the fundamental catalyst → you decide whether the thesis justifies the position. Neither product alone delivers this — it requires the integration.
The 18 Templates — Complete Reference
Templates are organised below by purpose. Each entry shows what the template does, which AI platform delivers the best output, and — where a dedicated deep-dive tutorial exists — a link to the full guide.
The Chrome extension copies raw tables from Screener.in and sends them to the AI. The Finmagine Premium Web App does something fundamentally different before the prompt even opens:
- Scrapes raw numbers from Screener.in
- No ratio classification (no Poor / Good / Excellent)
- No trend detection (improving vs declining)
- No anomaly flags
- LLM receives a data dump — interprets everything itself
- 38–46 ratios computed from Finmagine's own 10-year DB
- Every ratio classified: Poor / Average / Good / Excellent
- 5-year trend per ratio: Improving / Stable / Declining
- Anomalies auto-detected (e.g. ROCE >> ROE)
- LLM receives a pre-digested analyst briefing — output is sharper
This Intelligence Block is auto-prepended to every template in the Premium Web App — the AI sees ratio health, trend trajectories, anomaly flags, and a Reverse DCF before it reads a single word of your prompt. Same template, dramatically better output.
Platform Selection Guide
Not every AI platform handles every template equally. The best platform badge on each card is based on tested output — here's the full reasoning:
| Platform | Strengths | Best templates | Limitations |
|---|---|---|---|
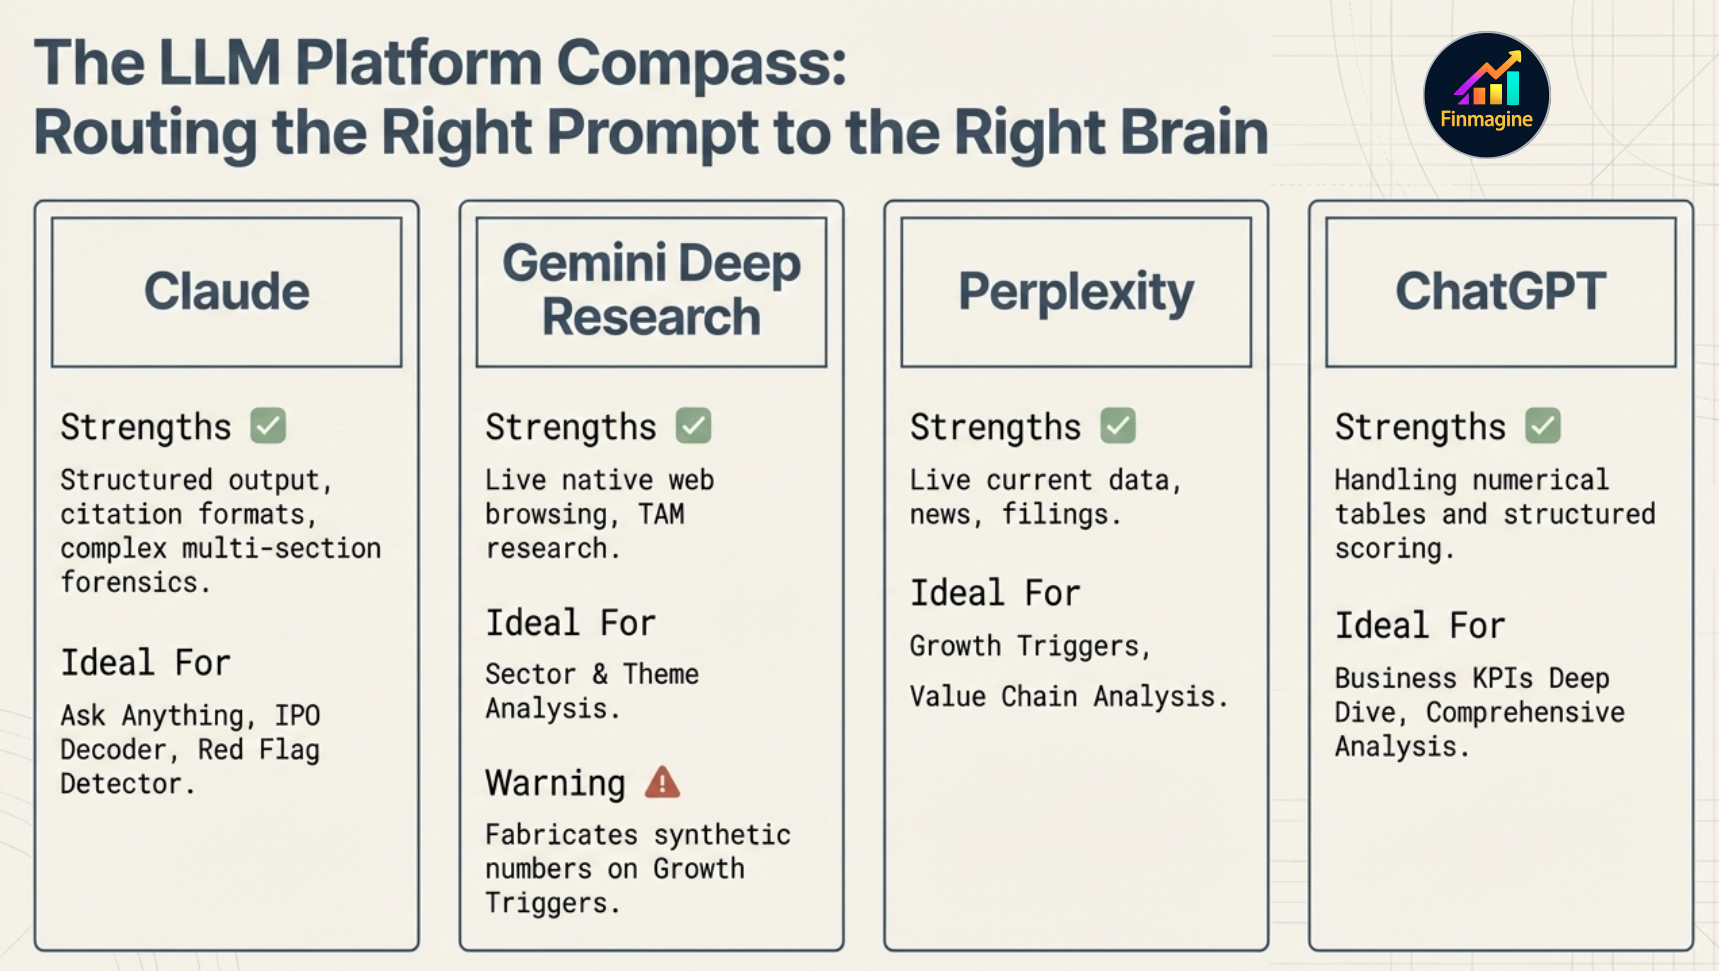
| Claude | Structured output, long document reading, citation formats, complex multi-section templates, forensic PDF analysis | Ask Anything, Quarterly Deep-Dive, Management Credibility Score, Growth Triggers, Analyst Panel, IPO Decoder ★, Red Flag Detector ★ | No live web access — knowledge cutoff applies for current sector data. IPO Decoder and Red Flag Detector require PDF upload. |
| Gemini Deep Research | Live web browsing, large-scale synthesis, TAM research, policy data | Sector & Theme Analysis (best platform), Deep Research | Less structured output format; may not follow template sections as rigidly |
| Perplexity | Current data (news, filings, recent events), good at catalyst research | Growth Triggers, Value Chain Analysis, Sector & Theme Analysis | Shorter context window; less suited to long structured templates |
| ChatGPT | Strong at numerical tables, structured scoring, KPI analysis | Business KPIs Deep Dive, Comprehensive Analysis, Risk-Reward | Gemini fails on Growth Triggers (produces synthetic numbers) — avoid for templates needing verifiable data |
Customising Templates with Edit Prompt
Every template has an Edit button that opens the full prompt text in an editable view. You can modify it before copying. Common uses:
- Add a specific question you want answered within the structured output
- Focus on a specific period — e.g. restrict the Quarterly Deep-Dive to Q3FY26 only
- Add sector context the AI might not have — recent regulatory change, a competitor announcement
- Remove sections you don't need to keep the output concise
- Add a comparison company to templates that normally cover a single stock
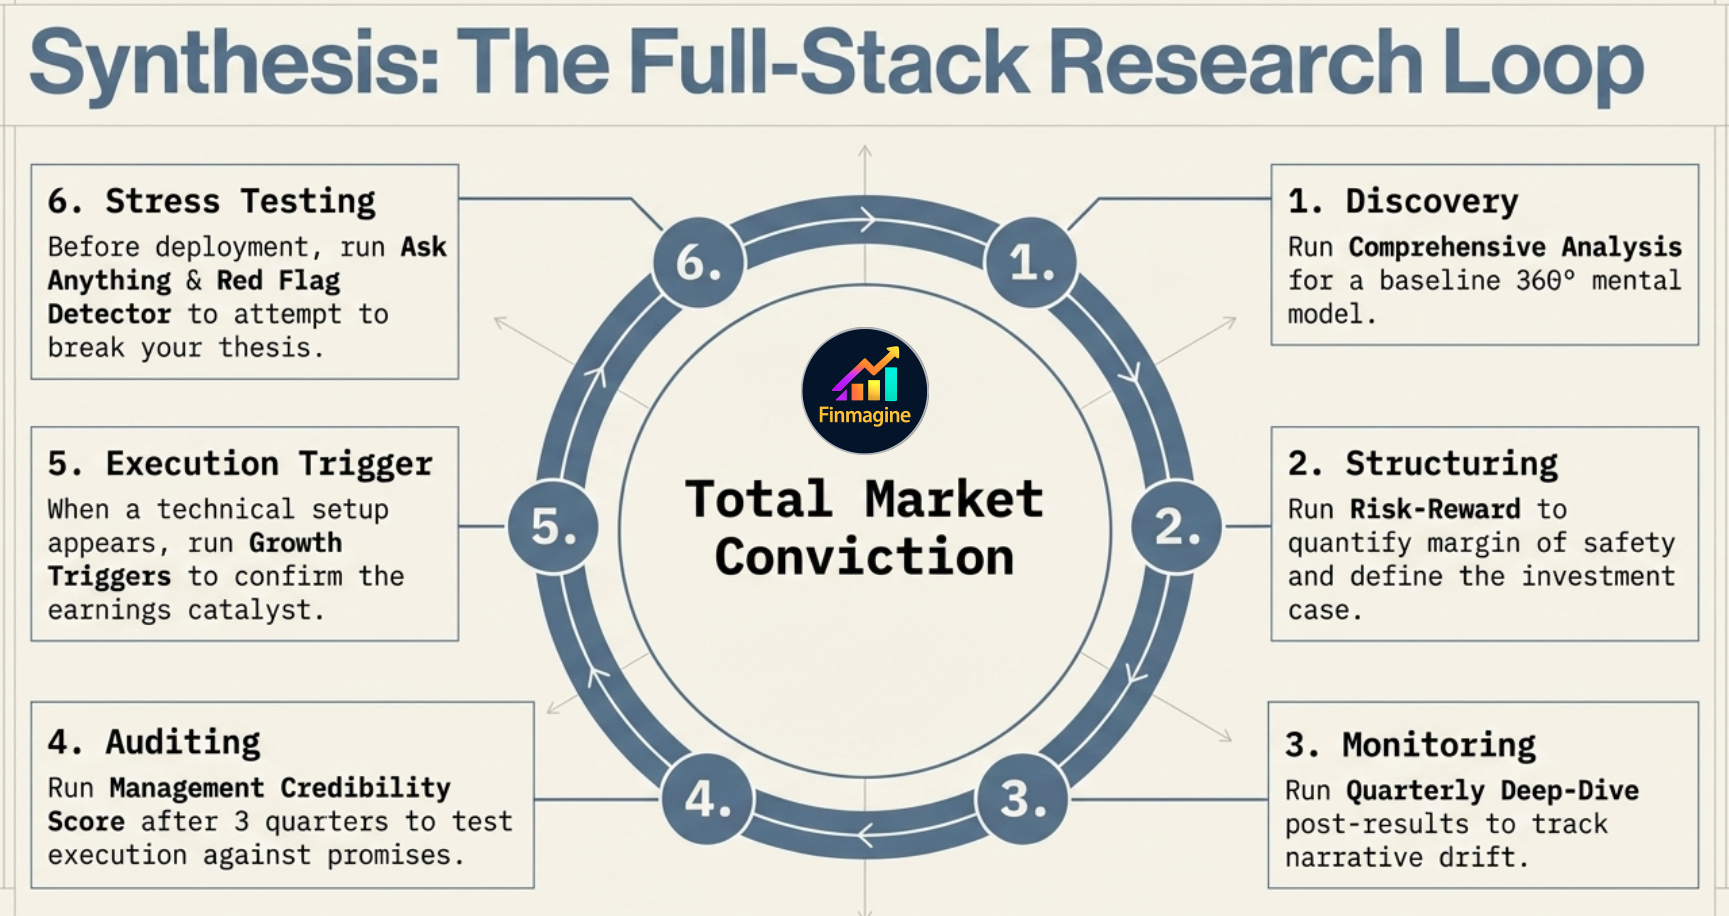
Recommended Workflow
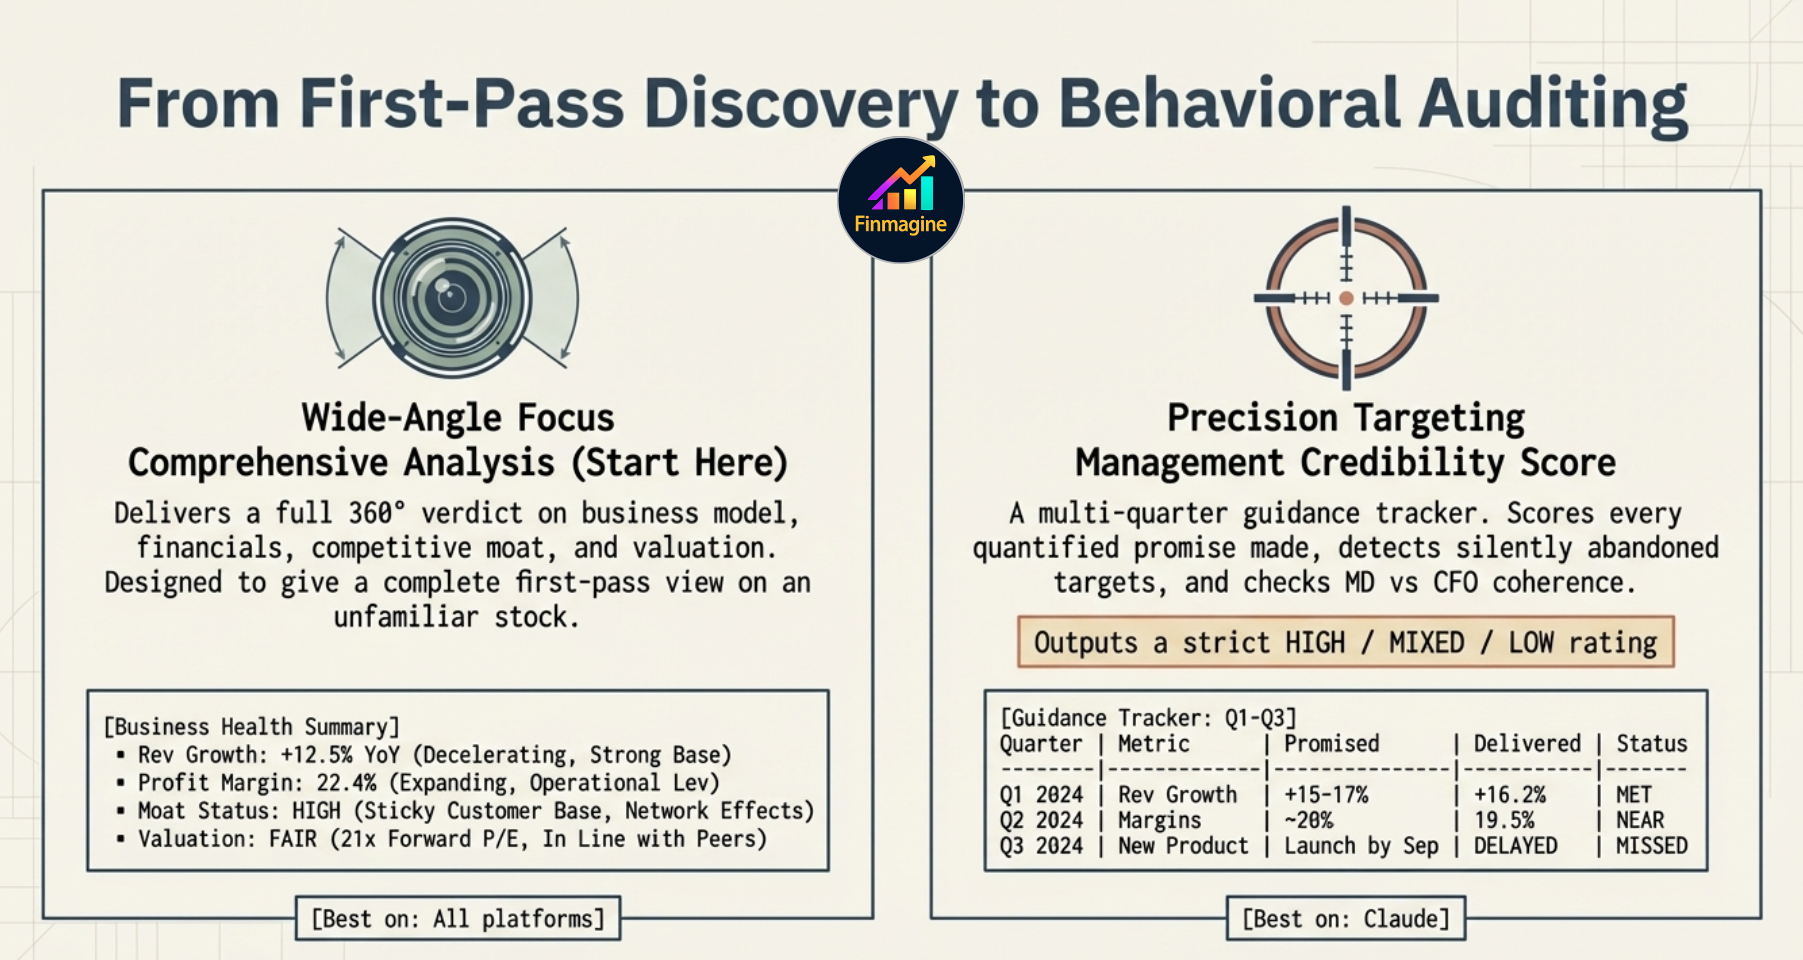
Step 1 Start with Comprehensive Analysis if you're new to a company. Read the output to build your mental model. Flag the two or three things the AI identifies as the most important risks or opportunities.
Step 2 Run Risk-Reward once you understand the business. This gives you the structured investment case — what needs to go right, what could go wrong, what margin of safety the current price implies.
Step 3 Use Quarterly Deep-Dive post-results — every quarter, after the concall, this is the fastest way to assess whether the management narrative is coherent, improving, or deteriorating.
Step 4 Run Management Credibility Score after 2–3 quarters of tracking. This is where the multi-quarter pattern becomes visible — not whether last quarter's guidance was met, but whether the organisation consistently delivers on what it promises.
Step 5 Use Growth Triggers before adding to a position — if the Scorecard and ratios look good, this template answers the last question: what specific event or inflection will cause the market to re-rate this stock? Without a trigger, a great business can stay sideways for years.
Step 6 Use Ask Anything for surgical questions — once you've built your thesis, use this to verify specific claims. "Did management mention the new plant capacity timeline in the last 3 concalls?" Claude will find the exact quote and quarter.
Ready to Analyse Indian Stocks Like a Pro?
Finmagine gives you 30+ computed financial ratios, sector benchmarks, FII/DII flows, the Finmagine Score, and AI-powered analysis — all in one place.