Following along? Install the extension first
Finmagine AI Advisor — free • no account needed • Chrome, Edge, Brave
Multimedia Learning Hub
Explore the Finmagine AI Advisor through video, audio deep dive, comprehensive overview, and interactive knowledge testing
Complete Learning Path
This deep dive explores how the Finmagine AI Advisor Chrome Extension transforms raw Screener.in data into institutional-grade investment research. You'll understand the architecture, the intelligence layer, and the methodology that makes this possible — all running privately in your browser.
What You'll Learn:
- The Problem: Why retail investors have data but lack the analytical edge that institutions enjoy
- The Workflow: Complete journey from visiting Screener.in to receiving institutional-grade analysis from GPT
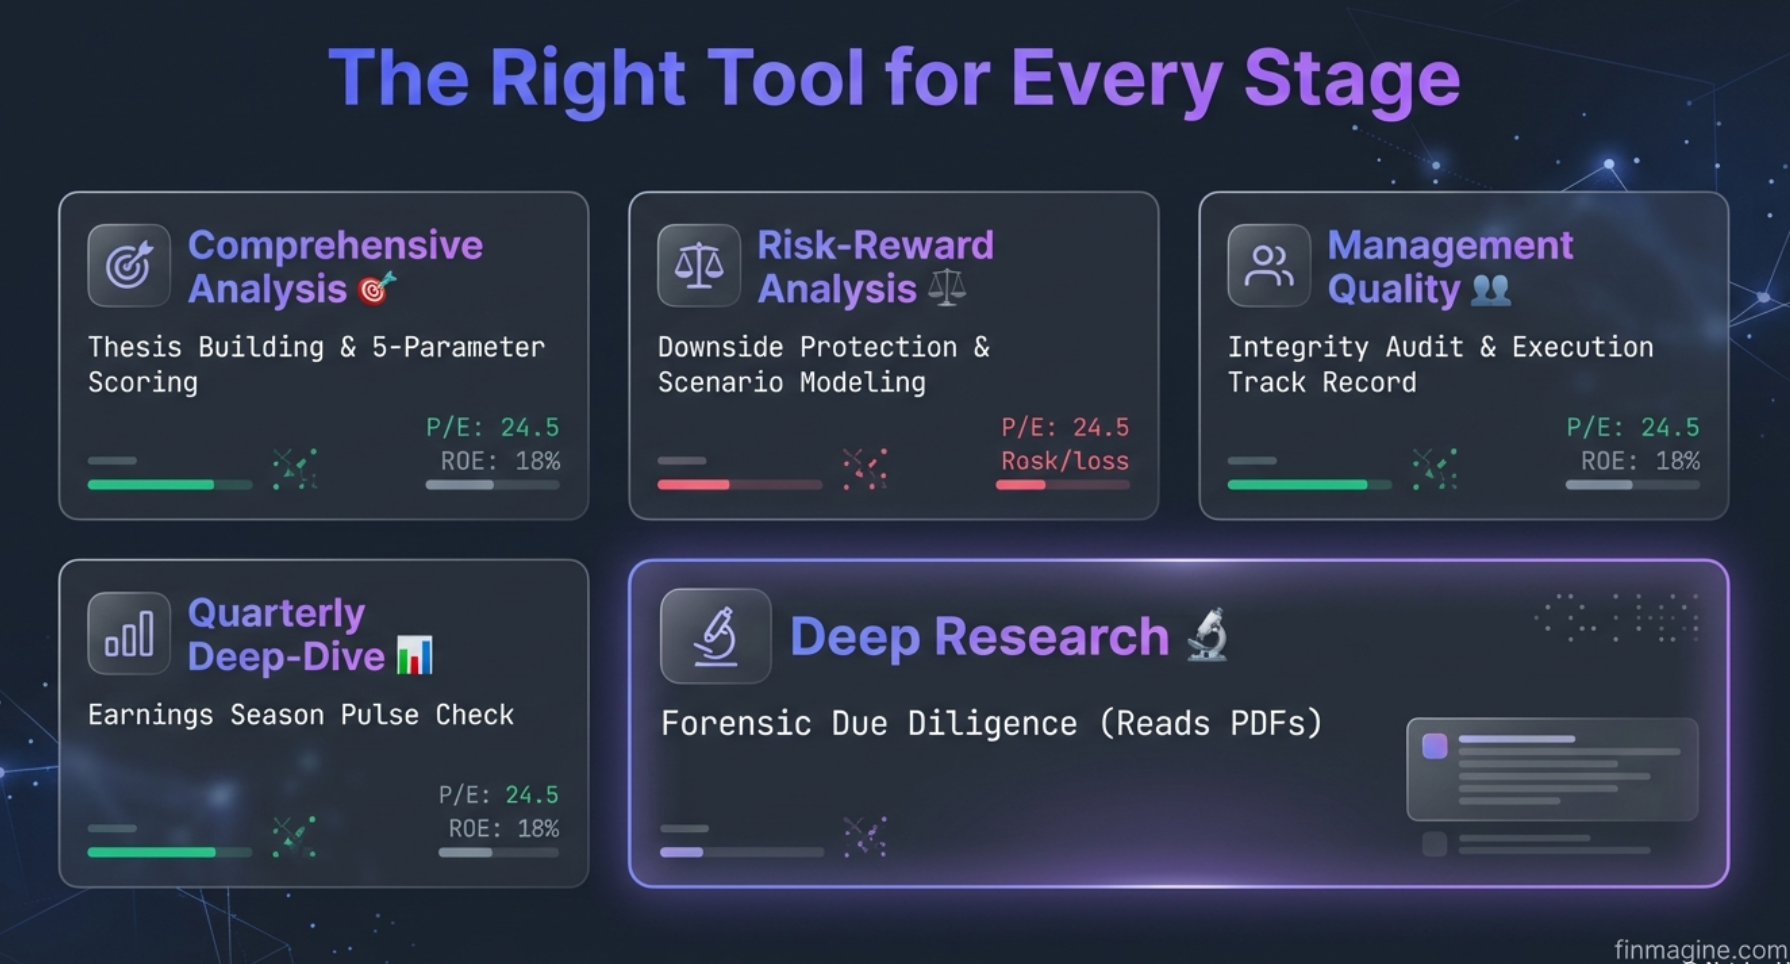
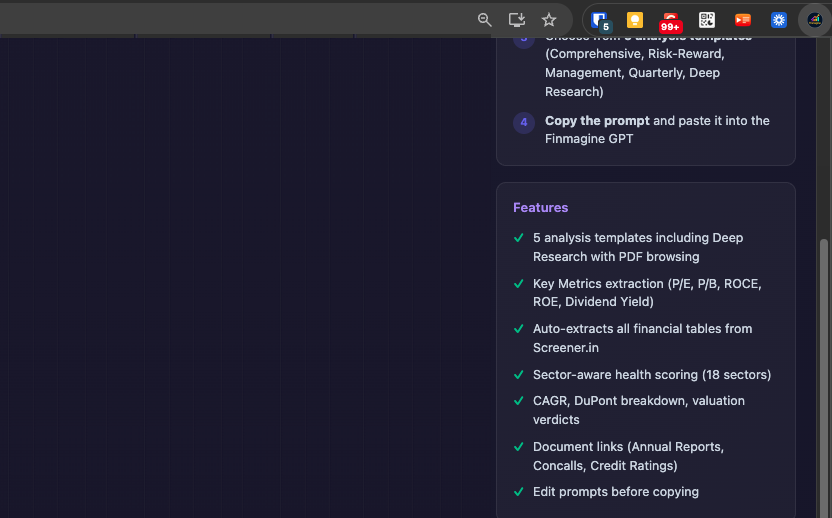
- 5 Analysis Templates: Comprehensive, Risk-Reward, Management Quality, Quarterly Deep-Dive, Deep Research
- Sector-Aware Intelligence: How 18 sector profiles change everything — banks, pharma, IT, metals, and more
- Health Scoring: The 0-100 composite score with CAGR calculations and DuPont ROE decomposition
- The Methodology: Finmagine's 21-parameter scoring framework and risk-first philosophy
- Deep Research: How the GPT reads actual BSE PDFs — concall transcripts, annual reports, investor presentations
Key Capabilities:
- Extract 12 key metrics, 6 financial tables, and document links from any Screener.in company page
- Automatic sector detection from Peer Comparison breadcrumb across 18 industries
- Health Score (0-100) computed locally with sector-specific adjustments
- Five-Parameter Weighted Scoring: Financial Health (25%) + Growth (25%) + Competitive Position (20%) + Management Quality (15%) + Valuation (15%)
- Management Integrity Scorecard tracking 12 quarters of promise vs. delivery
- Local-first privacy — your research habits, prompts, and AI conversations stay private; stock fundamentals passively contributed to Finmagine's shared cache
Article Structure:
- The Problem: The investor's research gap and why data alone isn't enough
- The Workflow: From raw page data to AI-ready research prompt in seconds
- The 5 Templates: Which lens to use for which investment question
- The Intelligence Layer: Sector-aware analysis, health scoring, and DuPont decomposition
- The Finmagine Methodology: 21-parameter framework and risk-first scoring
- The Bigger Picture: Democratizing institutional research for every investor
Watch the Deep Dive
This video walks through every aspect of the Finmagine AI Advisor — from the data-insight gap to the complete forensic analysis workflow.
Video Title: Turn Screener.in Into an Institutional-Grade AI Analyst | Finmagine AI Advisor Deep Dive
Complete walkthrough covering sector-aware analysis, 5 templates, health scoring, and the Finmagine methodology
Listen to the Audio Deep Dive
Prefer to listen? This in-depth audio exploration covers the extension's forensic capabilities, banking sector handling, management integrity auditing, and why this changes retail investing.
Duration: Full deep dive | Format: Conversational narration
In-depth audio covering forensic financial analysis, sector-aware intelligence, and the future of retail research
Test Your Knowledge
Click any flashcard to reveal the answer. Use the search box to find specific topics. 72 flashcards covering every aspect of the AI Advisor including v2.4.0 templates.
The Investor's Research Gap: Data Without Intelligence
Here's a question for every Indian retail investor who has ever opened Screener.in at midnight, coffee in hand, trying to evaluate a stock before making a decision: Are you making investment decisions with only half the picture?
That nagging feeling — the one that whispers you might be missing something critical — comes from a very real structural problem. We can call it the Investor's Research Gap.
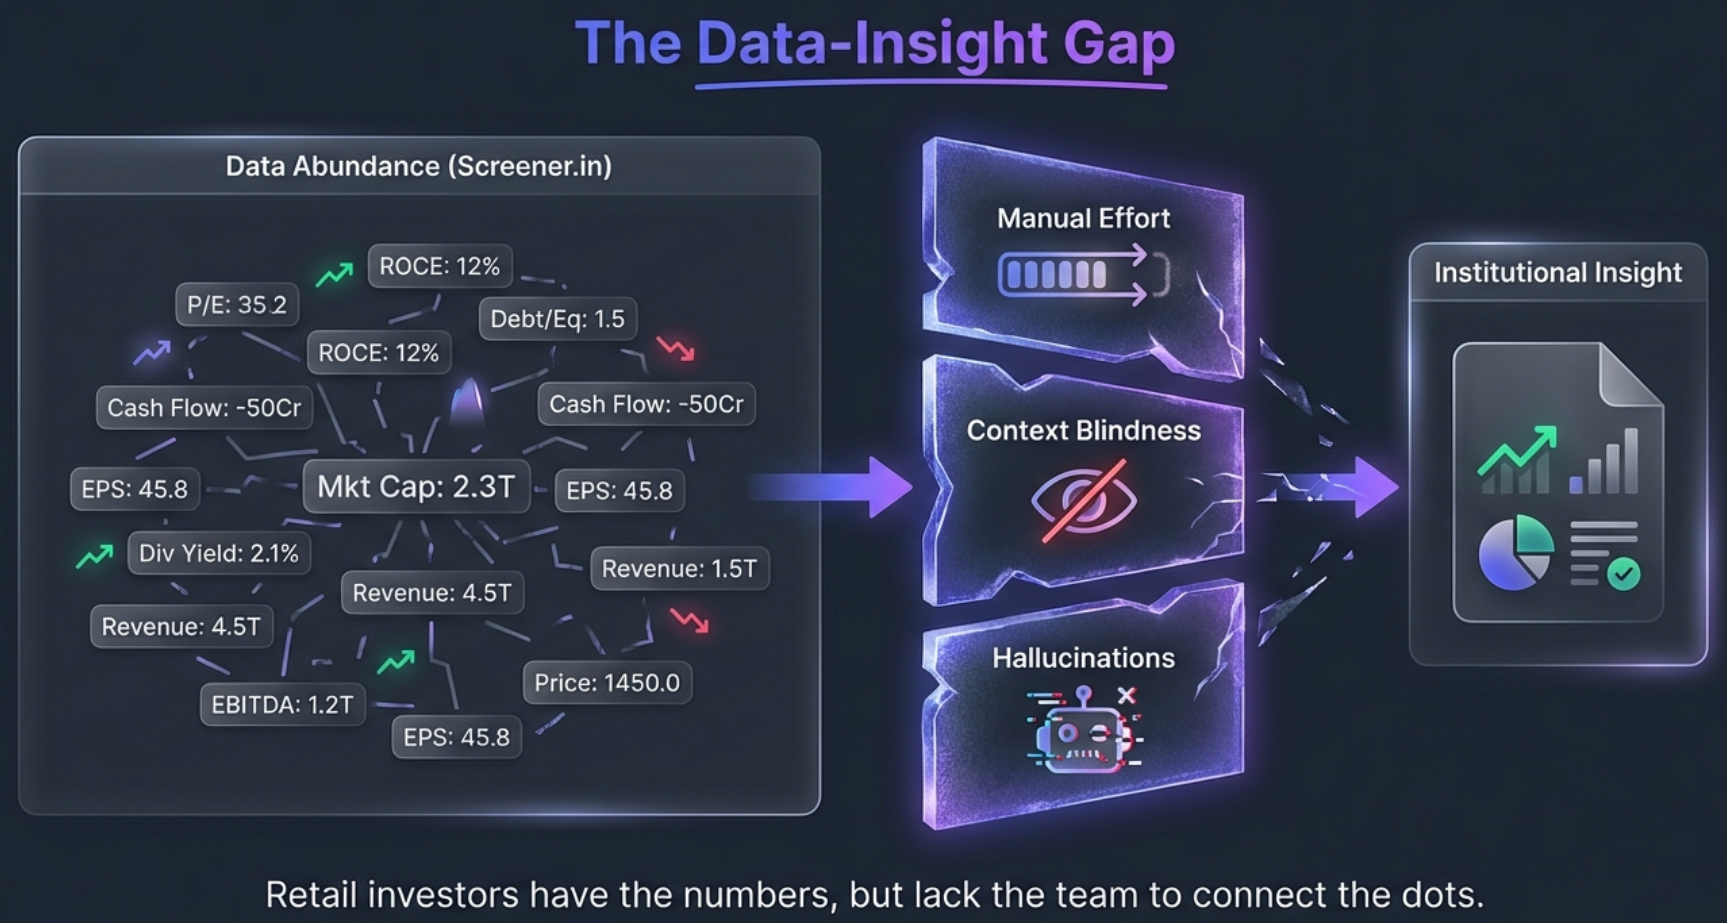
On one side, you have platforms like Screener.in that provide an extraordinary wealth of financial data. Twelve years of Profit & Loss statements. Balance sheets going back a decade. Cash flow statements, shareholding patterns, ratios, quarterly results — it's all there, meticulously organized and freely accessible. India's retail investor has never had more data at their fingertips.
On the other side, you have institutional investors — mutual funds, hedge funds, PMS operators — who employ dedicated research teams. These teams have Bloomberg terminals, proprietary models, sector specialists, and years of experience distilling raw data into actionable insight. They don't just look at the numbers. They interrogate them. They cross-reference management commentary with actual delivery. They detect when a company quietly drops a metric from its investor presentation because the numbers turned ugly.
Think about what actually happens when a retail investor tries to analyze a company from scratch. You open Screener.in, see the wall of numbers, and your brain starts doing mental gymnastics. Is revenue growth accelerating or decelerating? Is the margin expansion sustainable? What's driving ROE — genuine profitability or just leverage? Is the promoter pledging shares? Are FIIs accumulating or distributing?
Each of those questions requires pulling data from different tables, computing metrics that aren't shown (like multi-year CAGRs or DuPont decomposition), and contextualizing everything against the company's sector. A bank's negative operating cash flow means something completely different from a manufacturing company's negative operating cash flow. A pharma company's low P/E might signal a value opportunity or an FDA warning letter. Without sector context, every analysis is flying blind.
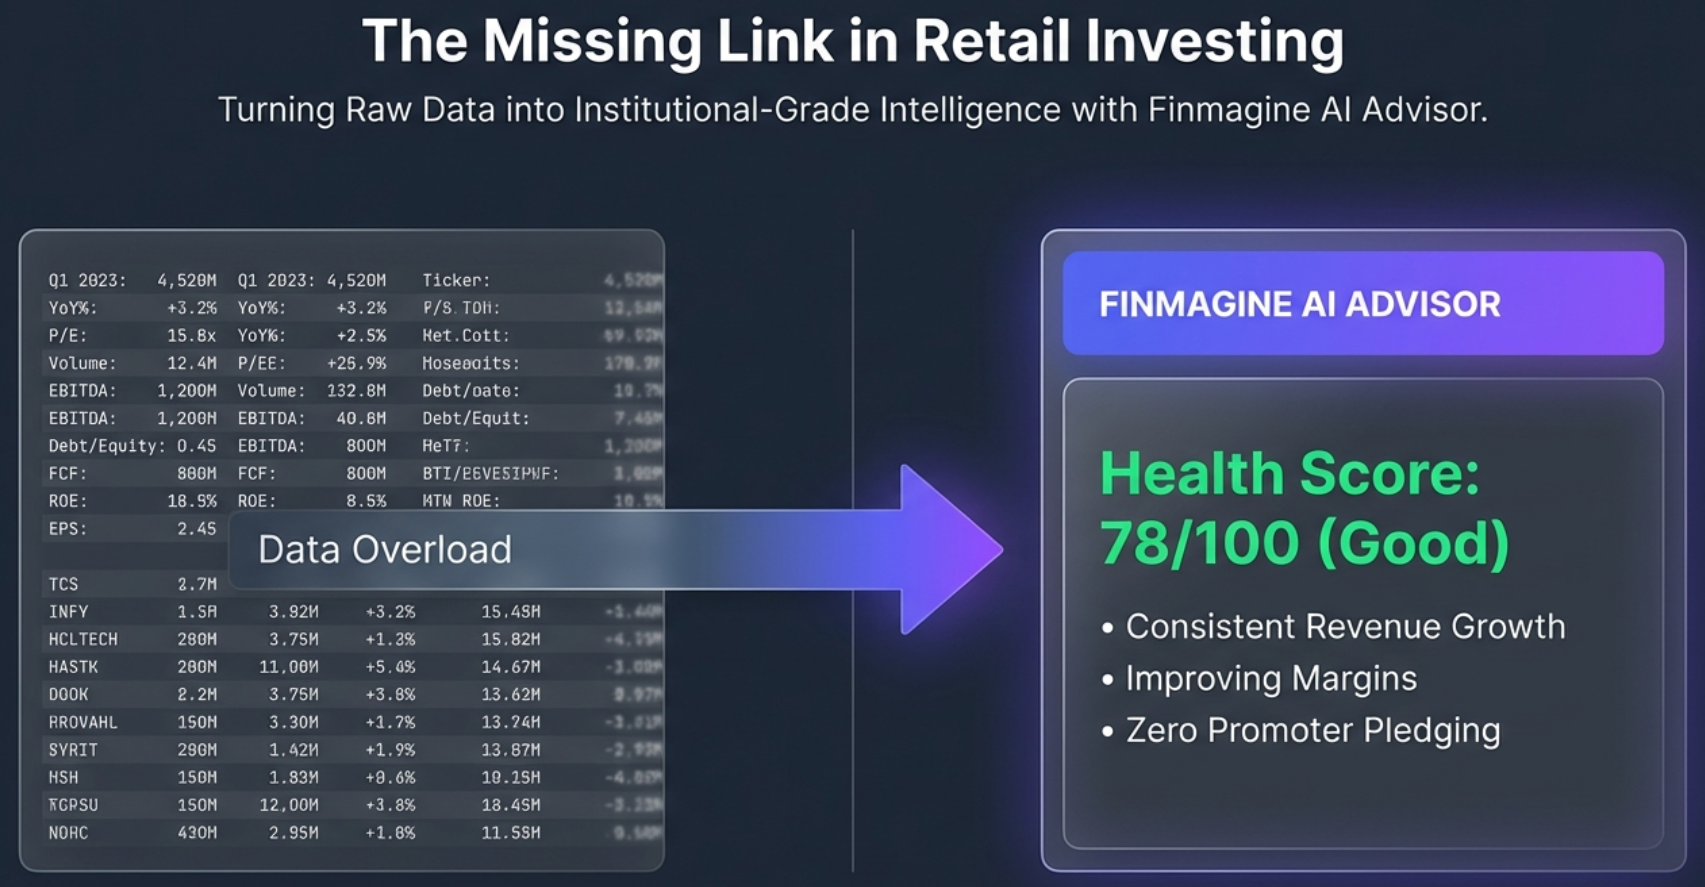
This is the gap the Finmagine AI Advisor was built to close. Not by replacing your judgment — that's the one edge AI can't replicate — but by automating the analytical heavy lifting that separates a 10-minute scroll through numbers from a structured, sector-aware, forensic-quality research report.
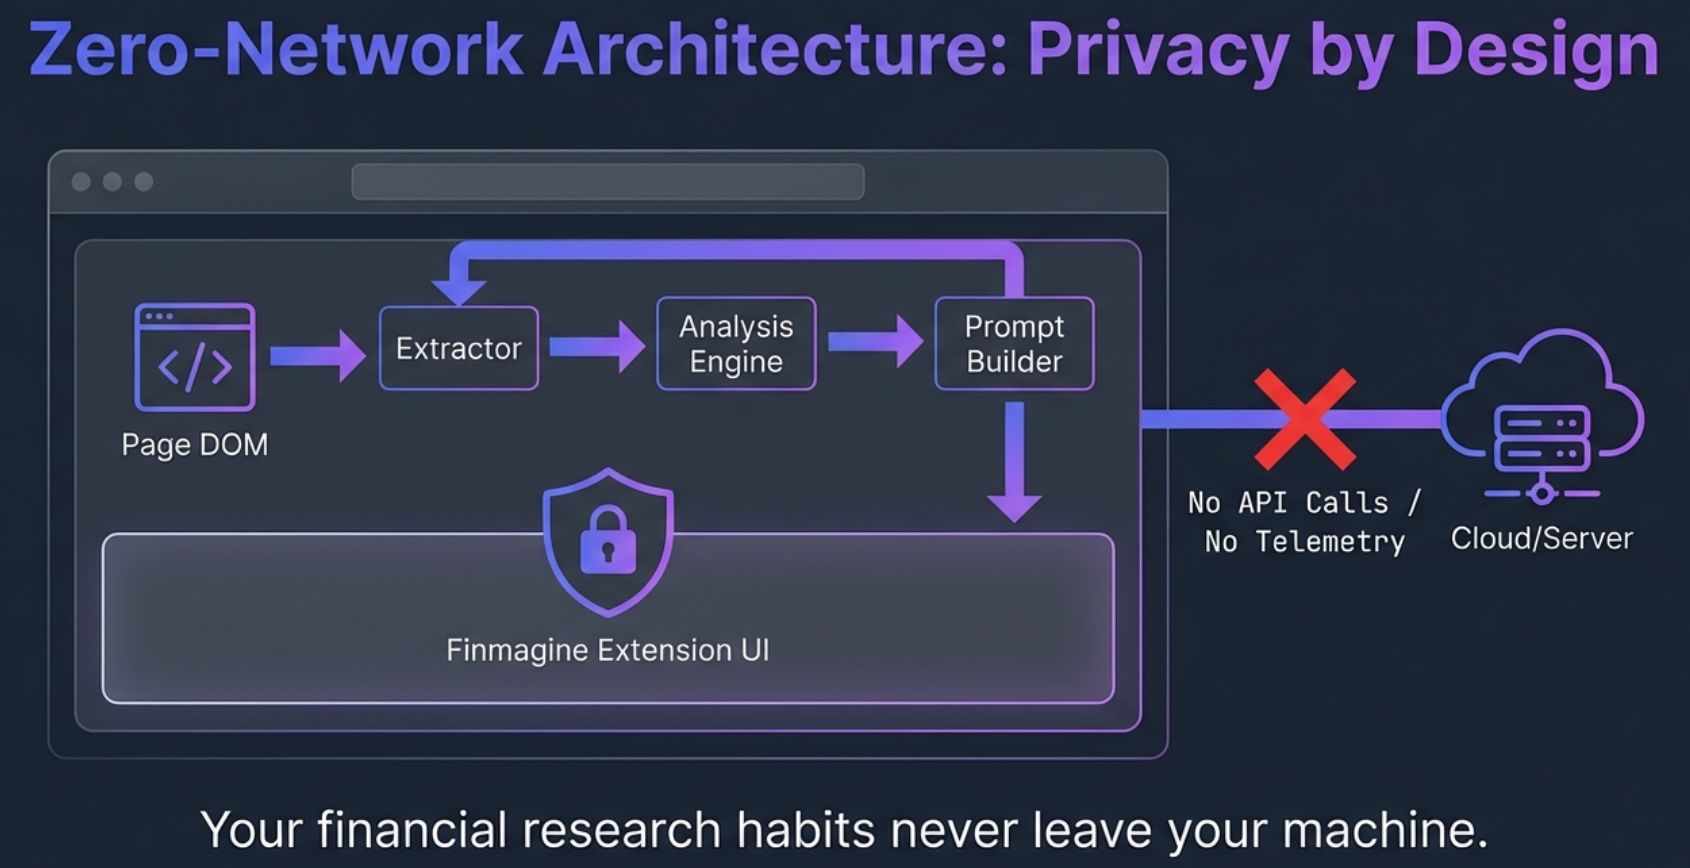
What if a Chrome extension could vacuum up every data point on that Screener.in page, detect the company's sector automatically, compute health scores and growth rates, assemble it all into a structured research prompt, and hand it to a Custom GPT trained on institutional-grade methodology? What if all of this happened in under a second, entirely in your browser, without a single byte of data leaving your machine?
That's exactly what this extension does. And in this deep dive, we're going to explore every layer of how it works.
From Raw Page Data to AI-Ready Research: The Complete Journey
The beauty of the Finmagine AI Advisor is that despite the sophistication of what's happening under the hood, the user experience is almost trivially simple. Three steps: visit a company page, pick a template, copy-paste into GPT. Everything else is automated.
But let's peel back the layers and understand what actually happens in those few seconds between clicking a template and seeing a 1,800-word structured research prompt.
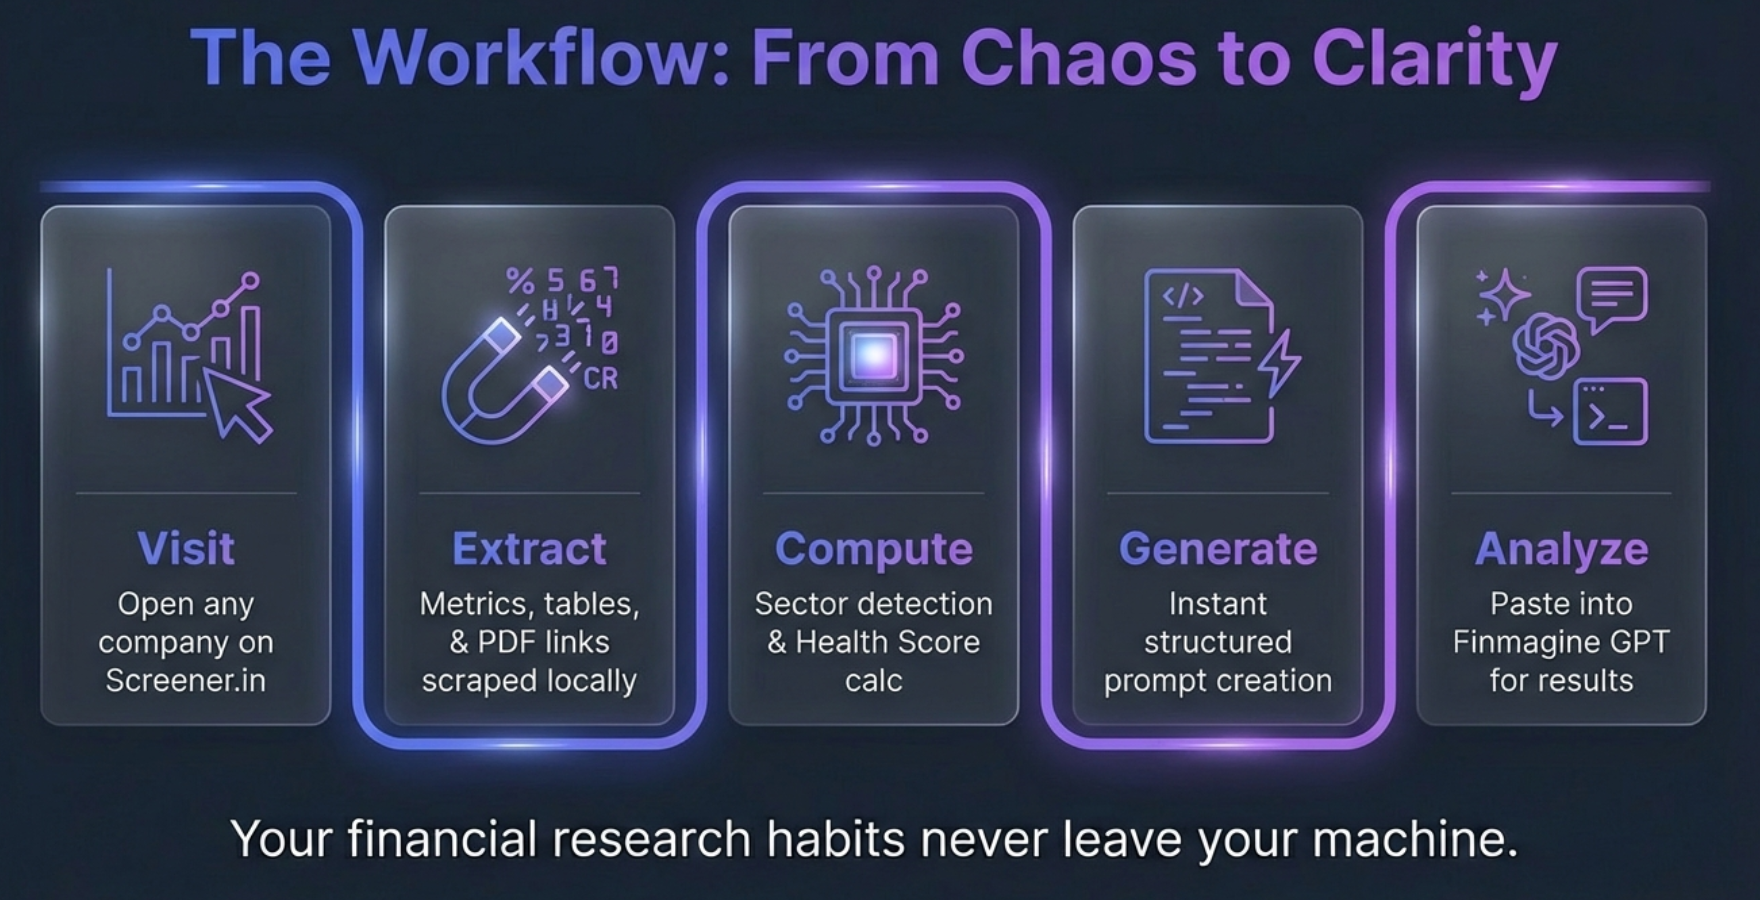
Phase 1: Automatic Data Extraction
The moment you land on any Screener.in company page (like screener.in/company/TCS/consolidated/), the extension wakes up. It's configured to activate only on company pages — it stays dormant on search results, watchlists, or the homepage.
Four specialized extractors run in sequence, each responsible for a different category of data:
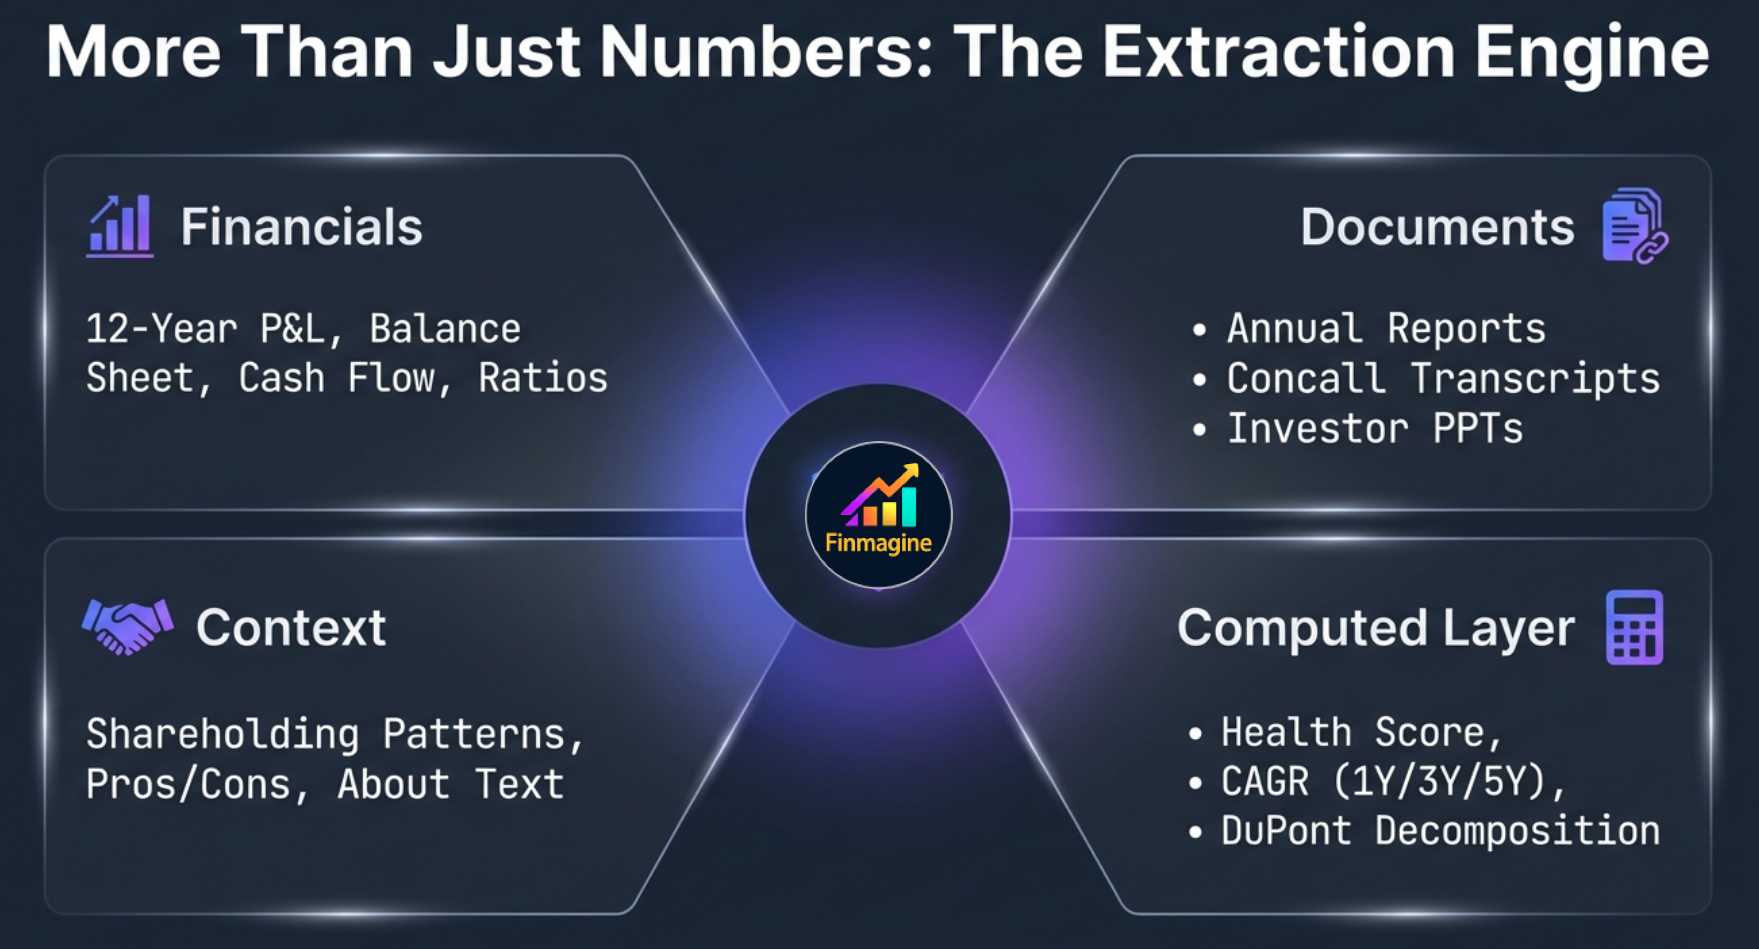
- Company Info Extractor: Captures the company name, BSE/NSE codes (detecting BSE-only stocks from numeric URLs), sector and industry from the Peer Comparison breadcrumb, and 12 key metrics from the
#top-ratiossection — current price, market cap, P/E, P/B, ROCE, ROE, dividend yield, debt/equity, 52-week high/low, and more. - Text Extractor: Pulls the company description from the About section (with 4 fallback strategies), plus the Pros and Cons lists. Noise filtering removes UI elements like "Read More" and "Show More" buttons.
- Financial Table Extractor: Parses 6 complete HTML tables into structured data — Annual P&L (up to 12 years), Balance Sheet, Cash Flow, Ratios, Shareholding Pattern, and Quarterly P&L (up to 11 quarters). The extraction handles hidden rows, expandable sections, and missing data gracefully.
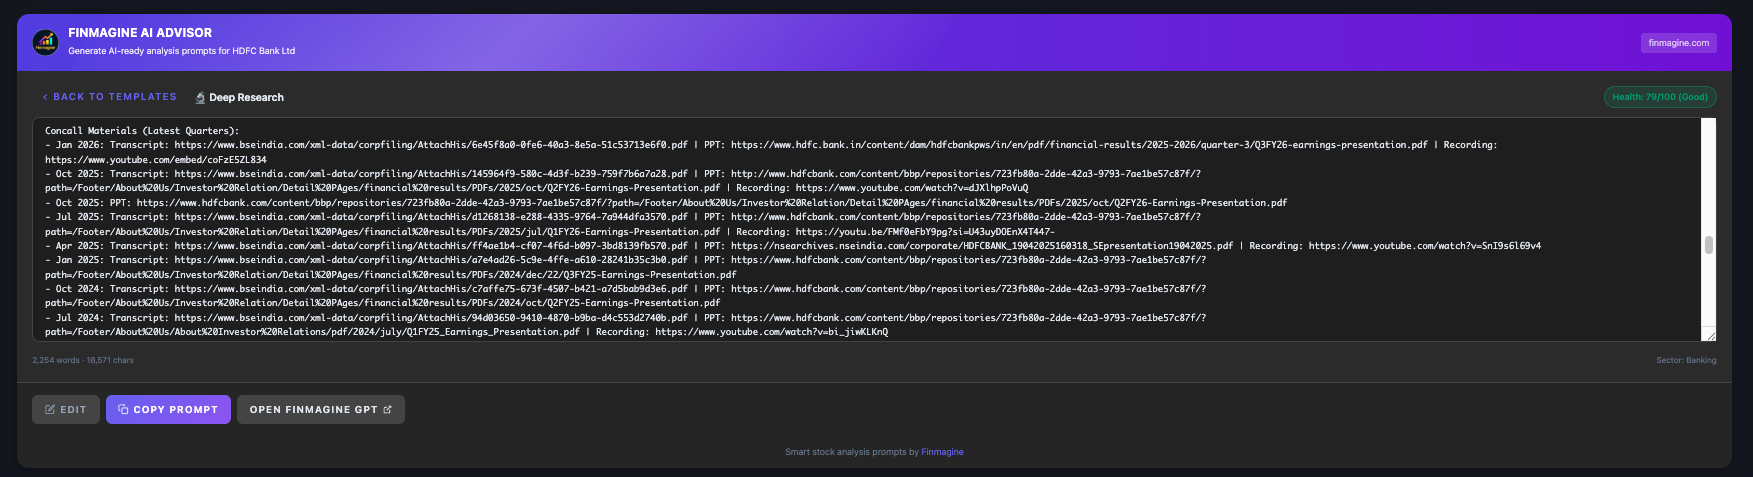
- Documents Extractor: Extracts URLs for up to 10 Announcements, all Annual Reports (often going back to 2012), Credit Ratings from agencies like CRISIL, ICRA, and CARE, and the most complex extraction — up to 12 quarters of Concall materials including separate Transcript, PPT, and Recording links.
All of this happens on page load, through DOM queries. The extension reads what's already on your screen, structures it, and holds it in memory. Stock fundamentals extracted from the page are also passively contributed to Finmagine's shared cache — improving load speed for all users without tracking your identity or research habits.
Phase 2: The Inline UI Panel
Once extraction completes, the extension injects its interface directly into the Screener.in page. The panel appears inline, embedded between the chart section and the financial tables — not as a floating overlay or popup, but as a natural part of the page.
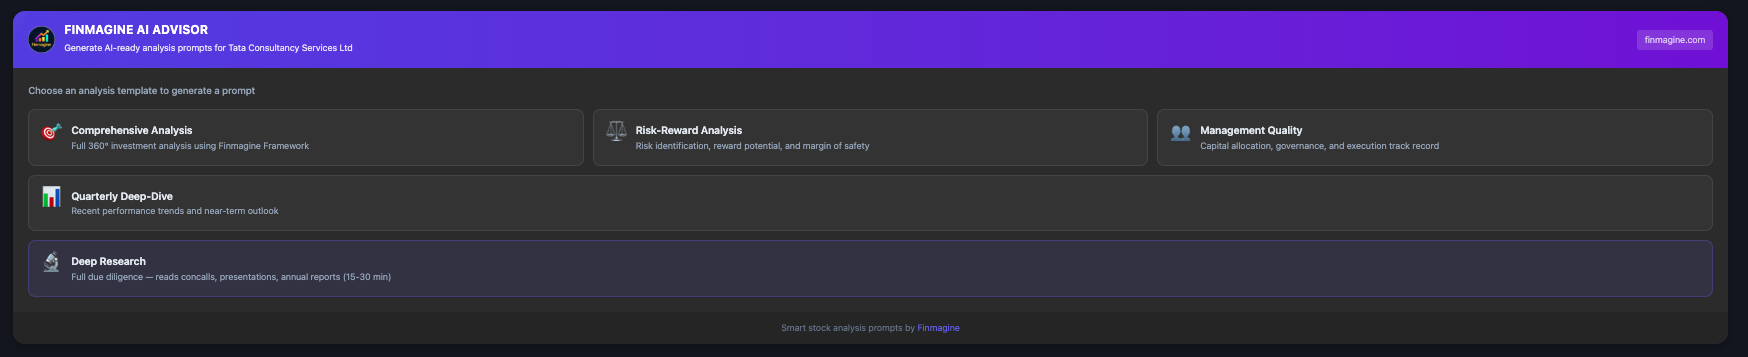
You see five template cards in a grid layout. The first three (Comprehensive, Risk-Reward, Management Quality) sit side by side. Quarterly Deep-Dive spans full width. Deep Research spans full width with a highlighted featured border. The panel automatically matches Screener.in's theme — light, dark, or auto — using CSS custom properties.
Phase 3: Analysis Engine (Lazy Execution)
Here's a subtle but important design decision: the analysis engine doesn't run on page load. It runs lazily — only when you click a template for the first time. This optimizes for the common case where investors browse many company pages but only use the AI Advisor on a few.
When you click your first template, the analysis engine fires up (typically in under 50 milliseconds) and computes:
- Sector detection — mapping the Peer Comparison breadcrumb text to one of 18 sector profiles
- Health score — 0-100 composite from strengths, concerns, and metric thresholds
- CAGR calculations — Revenue, Profit, and EPS growth at 1Y, 3Y, 5Y, and 10Y horizons
- DuPont ROE decomposition — NPM x Asset Turnover x Equity Multiplier
- Strengths and concerns identification — across growth, profitability, leverage, cash flow, and shareholding dimensions
The result is cached. If you switch to a different template, the analysis doesn't re-run — only the prompt assembly changes.
Phase 4: Prompt Assembly
The Prompt Builder takes all extracted data + analysis results + template-specific instructions and assembles them into a single structured text prompt. Every prompt includes the same data foundation (company header, key metrics, about section, pros/cons, analysis summary, 6 financial tables, document URLs) but ends with different analytical instructions depending on which template you chose.
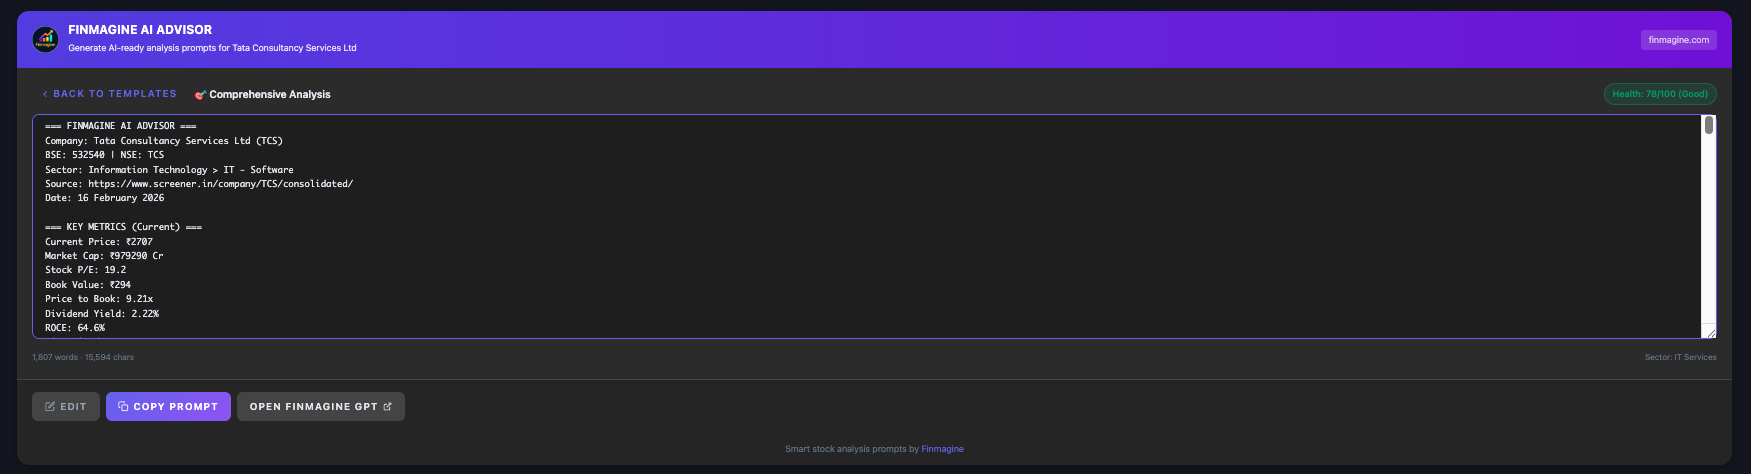
The prompt appears in a scrollable textarea with a toolbar showing the template name, health badge (color-coded from green for Excellent to red for Poor), word/character count, and the detected sector. Three action buttons sit below: Edit (to customize before copying), Copy Prompt, and Open Finmagine GPT.
Phase 5: GPT Analysis
Click "Copy Prompt," click "Open Finmagine GPT," paste, and the Custom GPT — pre-loaded with Finmagine's analysis methodology knowledge base — produces institutional-grade research. Comprehensive Analysis takes 2-3 minutes. Deep Research, which browses actual PDF documents, takes 15-30 minutes.
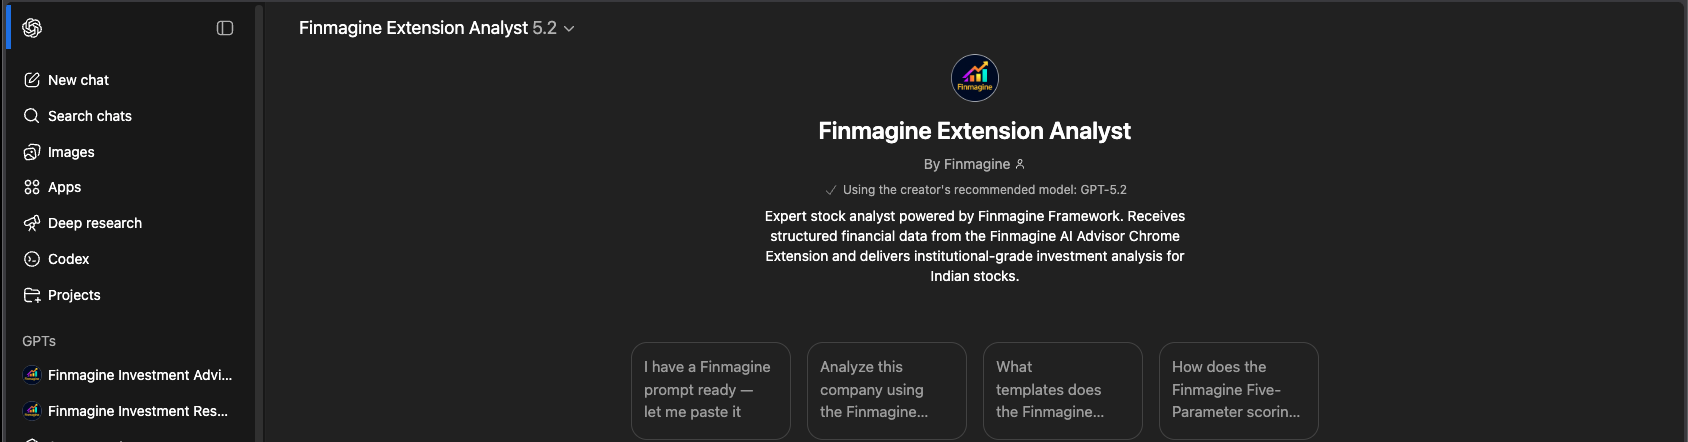
The Finmagine Extension Analyst — a purpose-built Custom GPT running on GPT-5.2 with the Five-Parameter scoring methodology baked into its knowledge base
Seven Templates for Seven Questions: Choosing the Right Analysis
Think of the AI Advisor not as a single tool but as a full research desk with seven specialized instruments. Each template is a different lens to examine a company through, depending on the specific question you're trying to answer right now. v2.4.0 added two powerful new India templates — Forensic Governance and Peer Comparison — bringing the total to seven.
| Template | Focus | GPT Time | Best For |
|---|---|---|---|
| Comprehensive Analysis | Full 360° with Five-Parameter scoring + Unit Economics | 2-3 min | First look, building an investment thesis |
| Risk-Reward Analysis | Risk identification, scenario modeling | 2-3 min | Pre-buy assessment, value trap detection |
| Management Quality | Capital allocation, governance, execution | 3-5 min | Evaluating leadership, family-run companies |
| Quarterly Deep-Dive | Sequential trends, near-term outlook | 2-3 min | Post-earnings check, monitoring holdings |
| Deep Research | 9-part forensic due diligence with PDFs | 15-30 min | Full due diligence before significant investment |
| Forensic Governance v2.4.0 | Quantified RPTs, pledging trends, concall evasion patterns | 10-20 min | Governance deep-dive, promoter-run mid-caps |
| Peer Comparison v2.4.0 | Auto-fetches 8 peers, live financial snapshot comparison | 3-5 min | Sector ranking, best-in-class identification |
Template 1: Comprehensive Analysis — The 360-Degree View
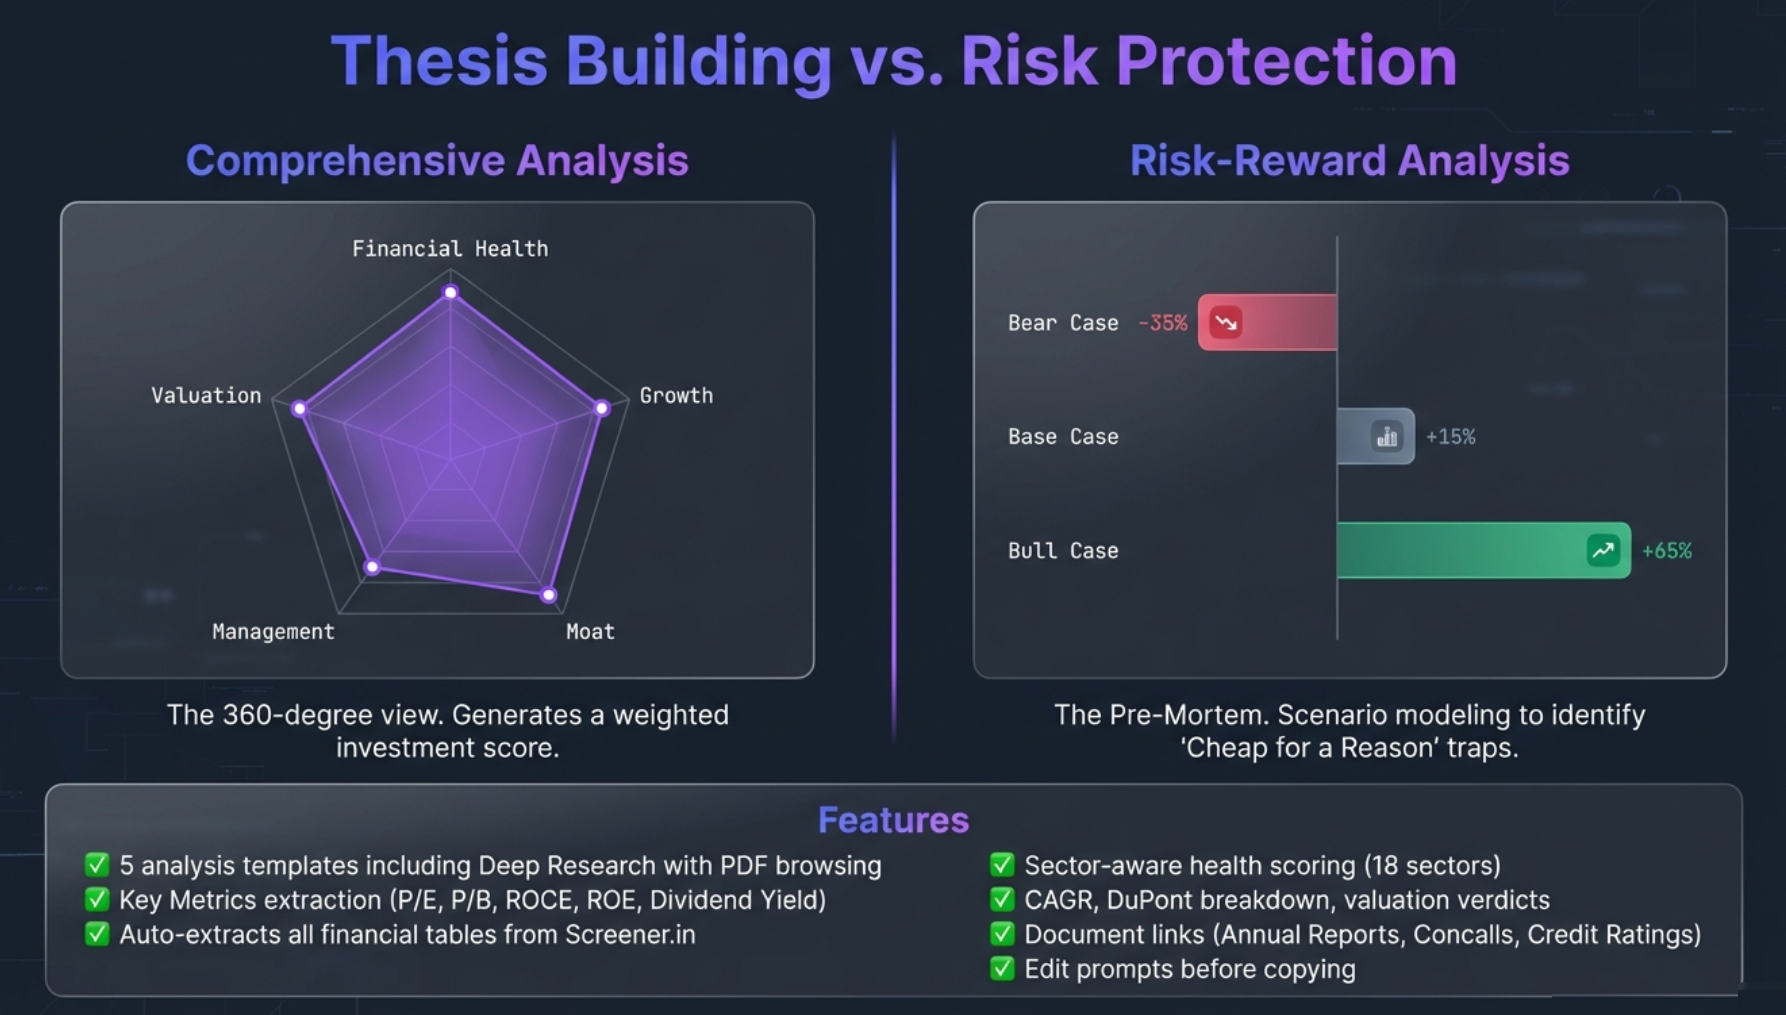
This is your default "go-to" template. It produces a complete investment thesis using the Five-Parameter Weighted Scoring Framework, rating the company on Financial Health (25%), Growth Prospects (25%), Competitive Position (20%), Management Quality (15%), and Valuation (15%) — each on a 2-10 scale.
The GPT evaluates the balance sheet, profitability metrics, and cash flow quality. It analyzes CAGR trends and operating leverage potential. It assesses competitive advantages and economic moats. It reads the most recent concall transcripts and investor presentations. And it concludes with a clear risk-reward summary and investment verdict with a weighted composite score.
For TCS, the Comprehensive Analysis produced a composite score of 7.6/10 (Strong) — institutional-grade output with specific financial citations and management commentary references.
v2.4.0 Addition: Cost Structure & Unit Economics Analyst
In v2.4.0, a sixth analyst role was added to the Comprehensive Analysis framework: the Cost Structure & Unit Economics Analyst. This is one of the most powerful additions to the template because it forces the AI to ground its analysis in the actual economics of how the company makes money — not just reported P&L percentages.
Here's what makes this qualitatively different from standard margin analysis: unit economics works from the bottom up. Instead of asking "what is the EBITDA margin?", it asks "what is the EBITDA per operating unit, and how does that unit's economics change as the company scales?"
The analyst is instructed to identify the most relevant operating unit for each company's business model, then build the analysis from the unit level up:
| Business Model | Operating Unit | Key Metrics |
|---|---|---|
| Manufacturing | ₹/tonne or ₹/unit | Per-unit gross margin, fixed cost absorption at scale |
| IT Services | Revenue/employee (annualized) | Revenue per associate, utilization, offshore mix |
| Retail | ₹/sq ft or ₹/store | Same-store sales growth, footprint expansion ROI |
| Telecom | ARPU (₹/subscriber/month) | Revenue per user, churn, subscriber unit economics |
| Hospital/Diagnostics | ₹/test or ₹/bed | Occupancy rate, revenue per occupied bed, ALOS |
After identifying the unit, the analyst must:
- Estimate per-unit revenue, gross profit, and EBITDA from the available financial data
- Reconcile with consolidated P&L — the unit-level calculation must agree with reported totals within ±15%
- Forecast the next 3 years from the unit level up — explicitly accounting for product mix changes and capacity additions; no linear extrapolation allowed
Operating unit: Revenue per Associate (annualized)
₹2,60,802 Cr ÷ 5,82,163 associates = ₹44.8 Lakhs/associate
Reconciliation: ₹44.8L × 5,82,163 = ₹2,60,809 Cr (±0.003% — exact match)
3-year forecast: FY2026 +3-4%, FY2027 ₹48-50L/associate (AI productivity tailwind), FY2028 compute-as-a-service transition impact modeled
Why does this matter? Consider what happens when two IT companies report the same 20% EBITDA margin. Company A achieves this with ₹60L revenue/employee. Company B achieves it with ₹40L revenue/employee. Company A has fundamentally better unit economics and will scale profitably at higher velocity. Standard P&L analysis misses this entirely — unit economics reveals it immediately.
Template 2: Risk-Reward Analysis — The Pre-Mortem
This template exists for one purpose: to answer the question "What could go wrong?" before you commit capital. It forces a probabilistic view of the future rather than a single target price.
The GPT identifies all material risks across five dimensions: balance sheet risks (leverage, liquidity, contingent liabilities), earnings quality risks (cash flow vs. profit divergence, one-time items), sector and regulatory risks, shareholding risks (promoter pledge, FII exodus), and risks disclosed by management in concalls.
Then it builds a Risk-Reward Matrix with probability-weighted scenarios:
- Bull Case — upside catalysts play out, margins expand, valuation re-rates higher
- Base Case — continuation of historical trends, most likely outcome
- Bear Case — identified risks materialize, margins contract, multiples compress
The probability-weighted expected return tells you whether the current price offers adequate margin of safety. If the bear case wipes out more value than the bull case creates, the math doesn't work — regardless of how exciting the growth story sounds.
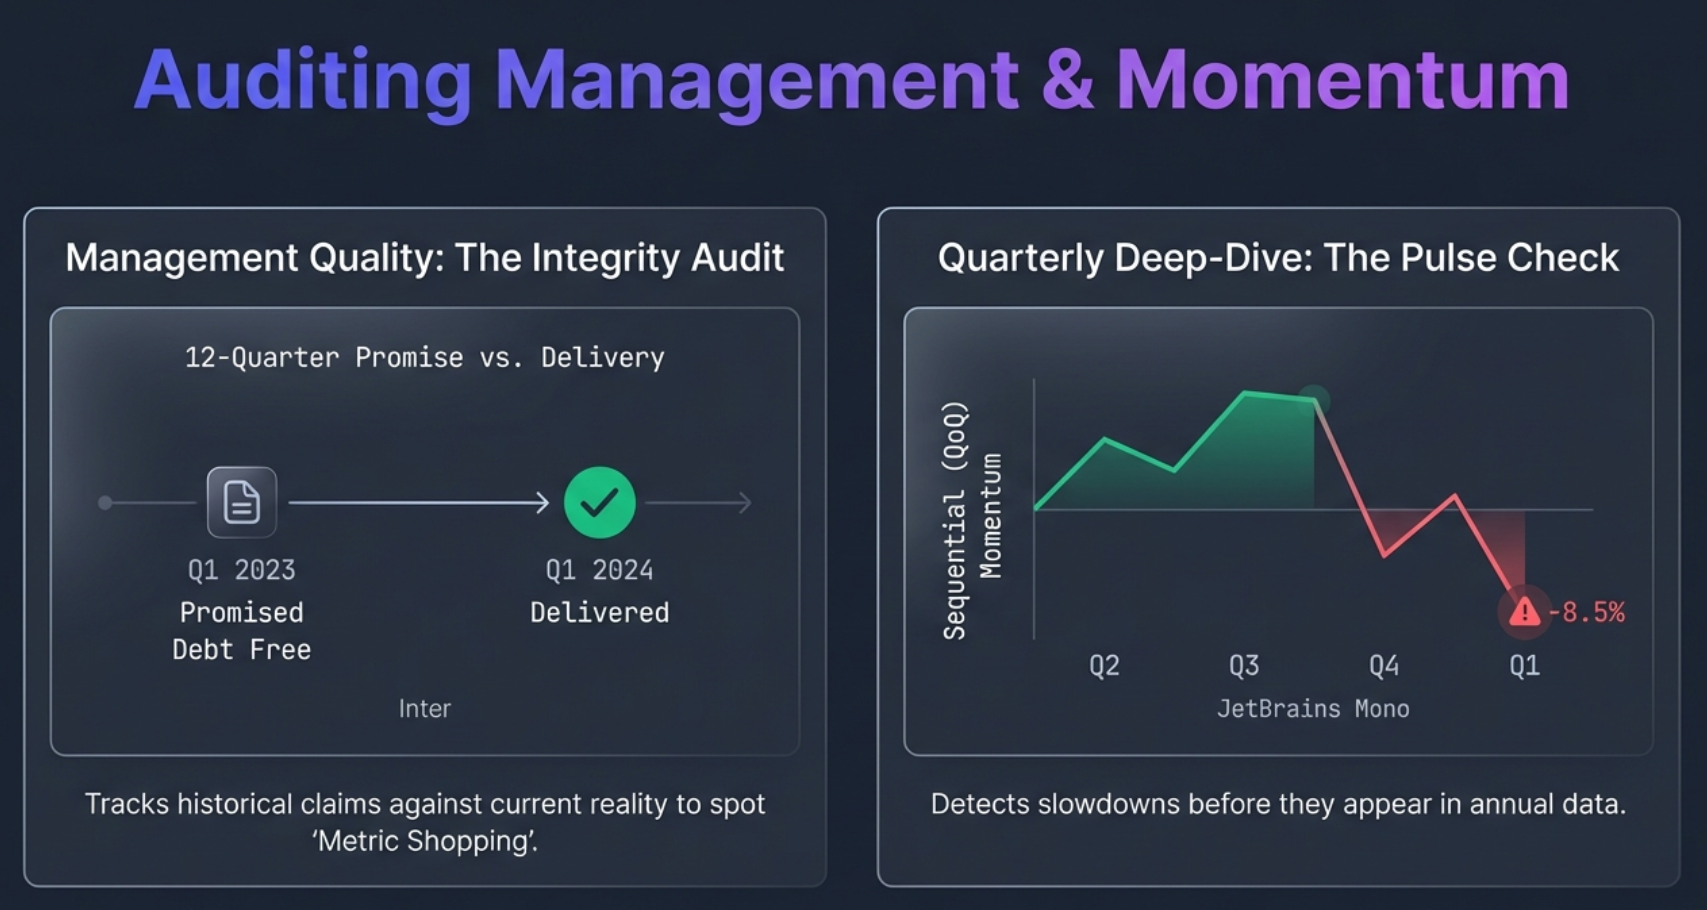
Template 3: Management Quality — The Integrity Audit
Here's a fact that separates sophisticated investors from the crowd: management quality is the single largest determinant of long-term returns, yet it's the hardest factor to quantify.
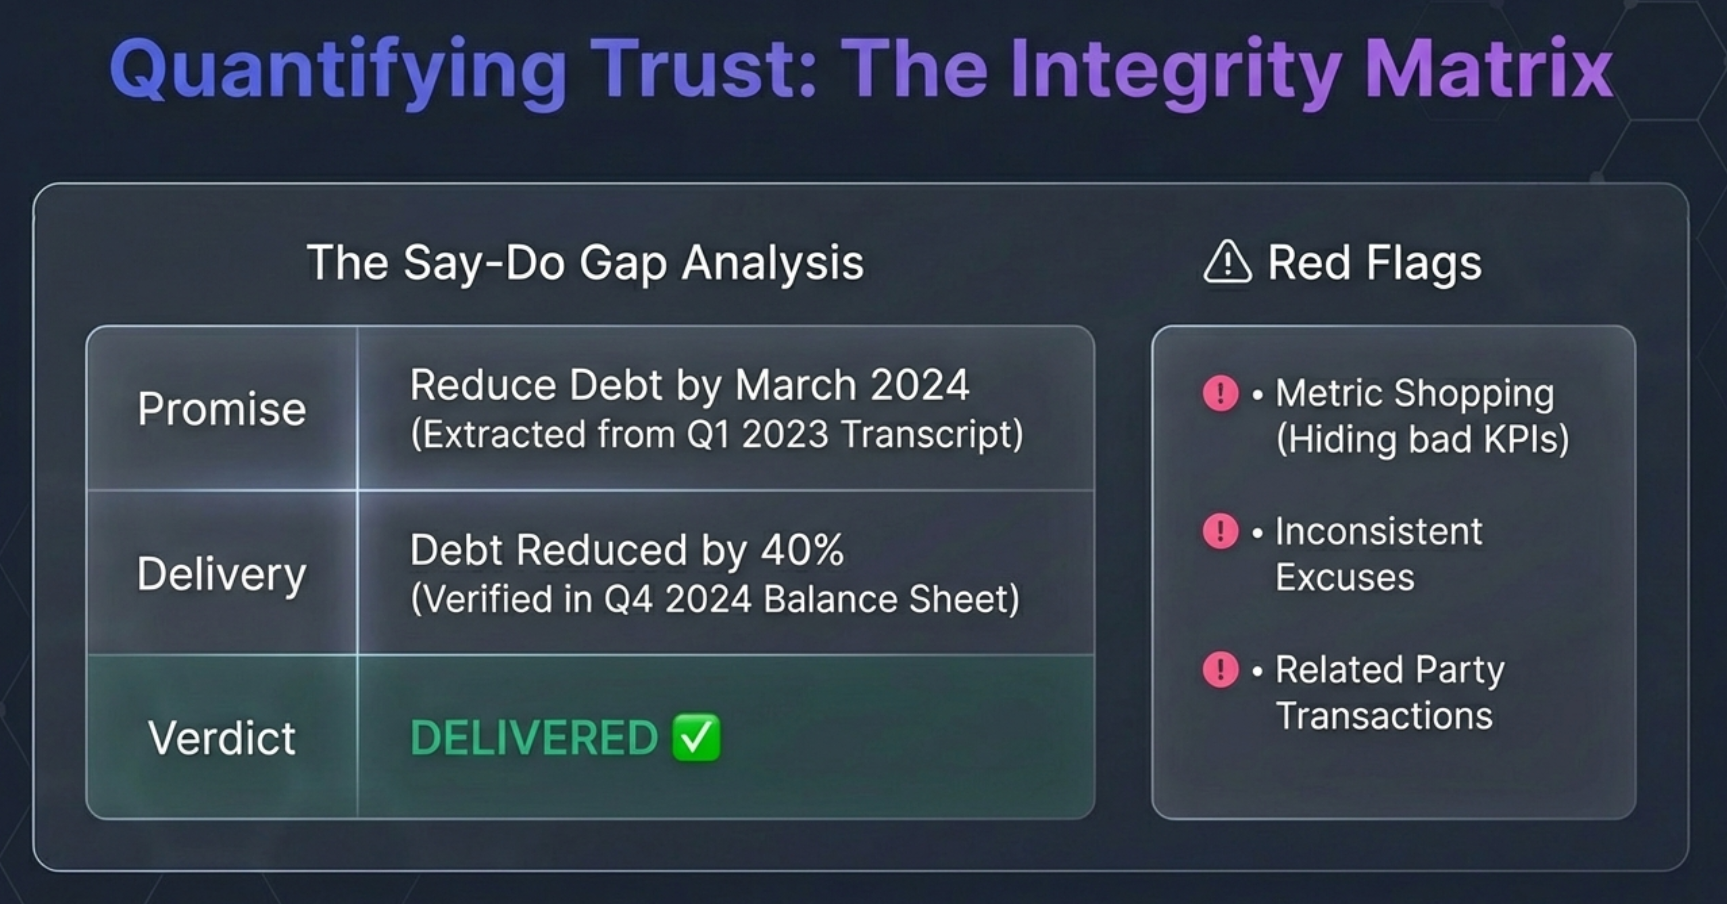
This template doesn't just summarize what management says. It audits what management does. The GPT reads 2-4 recent concall transcripts and investor presentations to create a Promise vs. Delivery track record spanning 12 quarters.
The analysis evaluates capital allocation efficiency (capex patterns, debt management, working capital, dividend policy), 5-year execution track record (margin trajectory, ROE/ROCE improvement, DuPont decomposition), shareholding signals (promoter trends, pledge status, institutional activity), governance indicators (transparency, related party transactions, succession depth), and concall intelligence (management tone, guidance credibility, strategic execution).
The result is a Management Integrity Matrix categorizing every tracked commitment as Delivered, Delayed, or Forgotten — with a composite Management Quality score out of 10. Each row in the matrix now carries a Category tag (Revenue / Margin / Capex&Project / Strategic), making it immediately visible whether management is reliable on financials but optimistic on strategic execution — or vice versa. Category-specific trust is far more actionable than an overall score: a company can have an Excellent rating on Revenue guidance yet consistently slip on Capex timelines, which changes how you model their expansion projects.
The analysis closes with a named Credibility Pattern archetype — one of four patterns identified from the full guidance history:
| Archetype | What It Means | Investment Implication |
|---|---|---|
| Conservative Promiser | Guidance is habitually below what the company actually delivers | Street estimates are systematically too low — beat surprises are structural, not one-off |
| Reliable Executor | Guidance and delivery are tightly correlated across all categories | Forecasting is straightforward — model close to guidance with high confidence |
| Optimistic Narrator | Management consistently over-promises, particularly on strategic and capex targets | Apply a haircut to forward guidance; financial estimates need a downside buffer |
| Erratic | No consistent pattern — delivery is unpredictable across categories | High execution risk; widen Bear Case scenario significantly; require margin of safety |
If the pattern is category-specific (e.g., Reliable Executor on Revenue but Optimistic Narrator on Capex), the archetype explicitly states which segments to trust and which to discount — giving you a finely calibrated view rather than a blanket credibility score.
Template 4: Quarterly Deep-Dive — The Pulse Check
This is your earnings-season companion. It focuses on the latest quarter's performance, sequential trends across 4-8 quarters, and near-term outlook from management guidance.
The GPT analyzes revenue growth (QoQ and YoY), margin expansion or contraction, and significant line item movements. It checks earnings quality by comparing quarterly profit with cash flow and flagging working capital anomalies. It extracts near-term outlook from the most recent concall — order pipeline visibility, sector tailwinds mentioned, expansion plans, and any guidance updates.
The concluding verdict answers one critical question: Is the quarterly trajectory supporting or diverging from the annual growth story? A company can report headline profit growth while its quarterly momentum is quietly deteriorating. This template catches those divergences before they show up in the annual numbers.
Section 0C: Narrative Drift — What Management Stopped Saying
Before the financial tables, the template now runs a Narrative Drift check between the two most recent sequential concall transcripts. This section catches the signals that numbers alone miss — the things management quietly stopped discussing, the new framing that appeared without explanation, and the metrics that used to headline every earnings call but are now buried or absent.
Four signals are analysed:
- Vanishing Topics: Subjects that featured prominently in the previous transcript but received no mention this quarter — without a clear reason (project completion, sale, etc.)
- New Talking Points: Language or framing introduced this quarter that was not present before — new terms, new metrics, new strategic narratives
- Metric Retreat: KPIs that were cited prominently in prior quarters but are now absent or buried in the appendix — a classic sign of a deteriorating metric being managed out of attention
- Drift Verdict: An overall characterisation of the shift: Suspicious Pivot (abrupt and unexplained), Tactical Adjustment (plausible given circumstances), Organic Evolution (natural maturation of the business narrative), or None Detected
Template 5: Deep Research — The Forensic Due Diligence
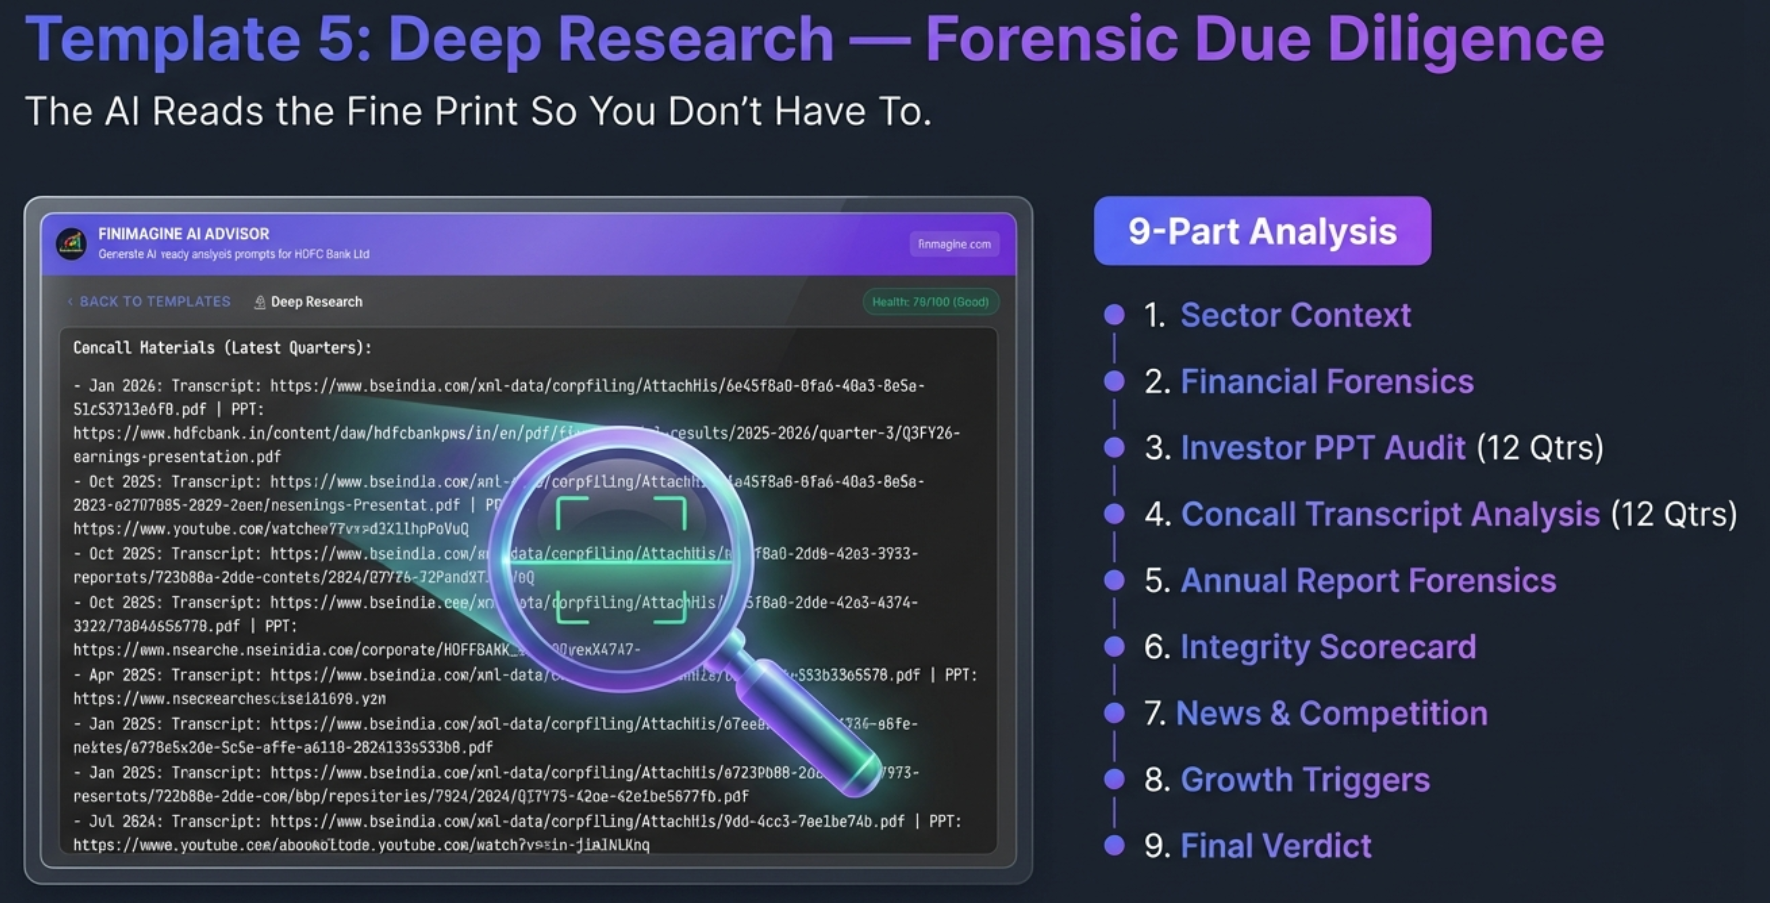
This is where the Finmagine AI Advisor becomes something genuinely unprecedented. Every other template works with the data extracted from the Screener.in page. Deep Research goes further: it instructs the GPT to browse and read the actual PDF documents linked in the prompt.
That list of concall transcript URLs? The GPT opens them. Those investor presentation PDFs from BSE? The GPT reads them. The latest annual report? The GPT performs a forensic audit of it.
The result is a 9-part forensic analysis:
- Sector Context: Industry outlook, government policies, structural trends
- Financial Forensics: 5-year deep dive into P&L, Balance Sheet, Cash Flow, and Ratios with pattern detection and forecasting
- Investor Presentation Analysis: 12 quarters of PPT data — tracking promises vs. delivery, revenue mix shifts, margin trajectory
- Concall Transcript Analysis: 12 quarters of management commentary — growth plans, headwinds, capex progress, guidance accuracy
- Annual Report Forensics: Red flag detection — creative accounting, related party transactions, contingent liabilities, buried negatives
- Management Integrity Scorecard: Promises delivered on time, delayed, or forgotten — with a composite integrity score out of 10
- News & Competition: Recent announcements review plus competitive landscape analysis
- Growth Triggers: Every trigger now carries a conviction tag — 🔵 VISIBLE (confirmed from actuals), 🟡 GUIDED (stated by management but not yet in numbers), or 🟢 OPTIONALITY (unpriced possibility not in consensus). This immediately separates confirmed catalysts from speculative ones, and Rule #6 enforces that the tag must match the evidence standard. The section closes with a Trigger Scoreboard: Dominant Theme, Trigger Density score, and Re-Rating Probability — giving you a single-line investment posture for the stock's catalyst picture.
- Final Verdict: Bull/Base/Bear scenarios, Five-Parameter scores, key monitorables, investment recommendation
Deep Research takes 15-30 minutes because the GPT needs to read the prompt data, browse 12+ PDF documents, and synthesize everything into a comprehensive report. This is by design. Thoroughness requires time — this is the same work that would take a human analyst days.
For HDFC Bank, the Deep Research template produced a composite score of 8.3/10 (Exceptional) with a full valuation assessment including scenario-modeled returns. The GPT cited specific management commentary from multiple quarterly concalls and flagged both positives and concerns from the annual report.
Template 6: Forensic Governance — The Quantified Integrity Audit New in v2.4.0
Template 3 (Management Quality) evaluates leadership narratively. Forensic Governance goes further: it quantifies. Related-party transactions are measured as a percentage of revenue. Promoter pledging is tracked as a multi-year trend. Earnings call language is pattern-analyzed for evasion tactics. No free tool does this for Indian stocks at this level of specificity.
This template deploys a 5-analyst forensic team, each examining governance quality through a different lens:
| Forensic Analyst | What They Examine |
|---|---|
| Business & Strategy | Actual vs. claimed strategy, pivot frequency, guidance delivery track record |
| Financial Quality & Earnings Integrity | CFO/PAT ratio (5-year table), working capital trend, receivables ageing, one-off frequency |
| Corporate Governance & Promoter Behaviour | RPTs as % of revenue/expenses/assets, promoter pledging trend, remuneration vs. peers, board independence, CARO remarks, auditor changes |
| Earnings Call Language | Question avoidance patterns, blame-shifting, selective metric reporting, cross-quarter consistency of narrative |
| Capital Allocation & Long-Term Risk | Capex ROI, acquisition logic, dilution history, buyback vs. dividend policy |
The template feeds on the same document URLs extracted by the Documents section — concall transcripts, annual reports, investor presentations — without requiring any additional extraction code. Every Indian company on Screener.in automatically generates a Forensic Governance-ready prompt.
Particularly powerful for: Promoter-driven mid-caps, companies with complex holding structures, businesses with a history of acquisitions, any company where you've noticed a qualitative "feel bad" but can't pin down the specific red flags. Forensic Governance forces those feelings into quantifiable evidence.
Template 7: Peer Comparison — Auto-Fetched, Live Head-to-Head New in v2.4.0
This template answers the question that no other template addresses: "Is this company actually good, or does it just look good because you haven't compared it to its peers?"
Most analysis evaluates a company in isolation. Peer Comparison forces a relative frame. A ROCE of 22% sounds acceptable — until you discover that every competitor in the sector earns 35%+. A P/E of 30x sounds expensive — until peers are trading at 45x for similar growth. Context transforms interpretation.
How the Data Is Assembled Automatically
This is where Peer Comparison introduces genuine technical innovation. The extension automatically:
- Reads the Screener.in Peers section and extracts up to 8 sector peers including their tickers
- Fetches live financial snapshots from the Finmagine Data Layer for each peer — P/E, ROCE, ROE, OPM%, NPM%, D/E, Market Cap, Promoter Holding, Revenue Growth, EPS Growth, Current Ratio, and Incremental ROCE
- Shows a live status indicator as data loads — ✅ for peers with complete data, ⚠️ for peers with partial data
- Builds a structured head-to-head comparison table in the prompt, ready for the AI to analyze
Peers detected: INFY, WIPRO, HCLTECH, TECHM, PERSISTENT, LTM — all 6 returned ✅
Output ranking: TCS (25/25) > PERSISTENT (23) > HCLTECH (21) > INFY (20) > TECHM (17) > WIPRO (13)
Best risk-reward identified: HCLTECH ("best balance of growth, margin and cash flow")
Structural laggard identified: WIPRO (-0.75% revenue CAGR, ROCE 17.8% vs. TCS 64.6%)
The four analysts in the Peer Comparison framework cover:
- Valuation Analyst: P/E cross-peer table, P/E-to-growth calibration, valuation premium or discount justified?
- Profitability & Efficiency Analyst: ROCE hierarchy, OPM comparison, incremental ROCE trend (capital allocation quality)
- Growth & Quality Analyst: Revenue CAGR, EPS CAGR, promoter conviction, balance sheet strength ranking
- Final Ranking & Recommendation: A pre-filled 5-criterion scorecard (0-5 per criterion), total score, best risk-reward pick, structural laggard identification
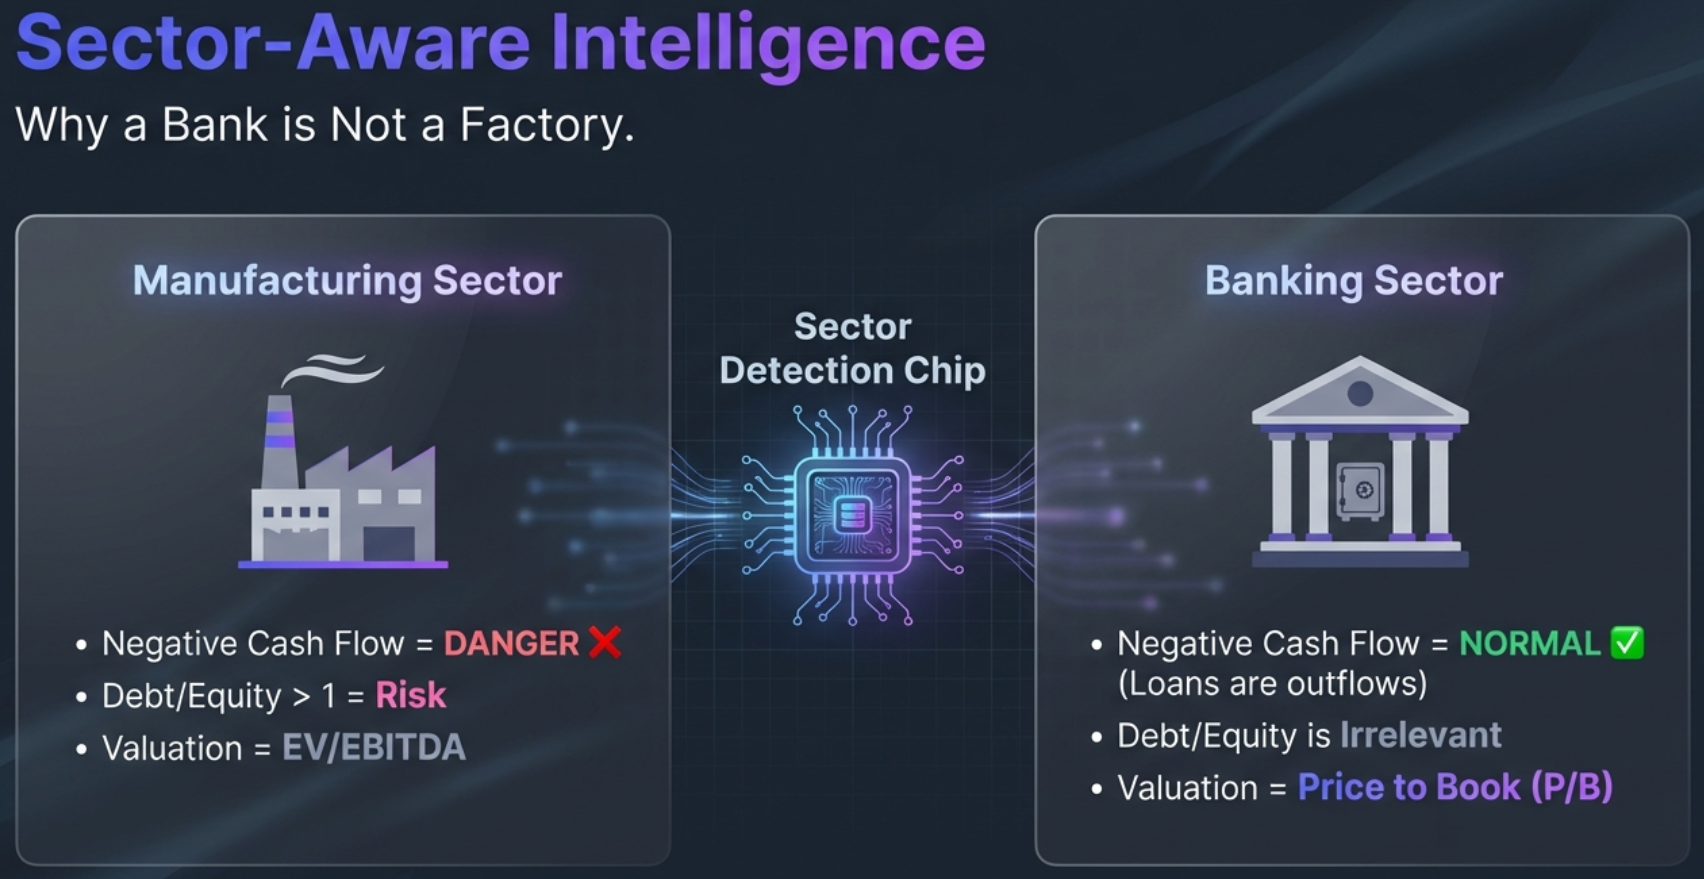
Sector-Aware Analysis: Why a Bank Is Not a Factory
This is where the Finmagine AI Advisor separates itself from generic stock screeners and basic analysis tools. The extension doesn't apply a one-size-fits-all framework. It has a built-in intelligence layer that understands context — specifically, that you cannot analyze a bank the same way you analyze a car company or a pharma firm.
18 Sector Profiles
The analysis engine contains 18 distinct sector profiles, each with its own set of relevant metrics, disabled metrics (things to ignore for that sector), and customized thresholds. When the extension detects the company's sector from the Peer Comparison breadcrumb, everything downstream adjusts automatically.
| Sector | Primary Valuation | Special Handling |
|---|---|---|
| Banking | Price-to-Book (P/B) | NIM, GNPA, CASA, ROA; skip D/E and Current Ratio; negative CFO is normal |
| NBFC | Price-to-Book (P/B) | NIM, GNPA, ROA; D/E threshold raised to 7.0 |
| IT Services | P/E Ratio | Skip D/E, Current Ratio; focus on attrition, TCV deal wins |
| Pharma | P/E Ratio | R&D pipeline, ANDA filings, FDA inspection risk, gross margin emphasis |
| Metals & Mining | EV/EBITDA | Cyclical handling; P/E unreliable for cyclicals |
| Infrastructure | EV/EBITDA | Interest coverage, order book-to-revenue ratio |
| FMCG | P/E Ratio | Volume vs. price-led growth, inventory days, brand premium |
| Telecom | EV/EBITDA | ARPU, interest coverage; P/E often irrelevant |
The Banking Exception: A Case Study in Sector Intelligence
The banking sector illustrates why sector-aware analysis matters so profoundly. Consider what a generic analyzer would flag when looking at HDFC Bank:
- Negative operating cash flow — a generic tool would raise a red alert. But for a bank, issuing loans is a core operating activity. A growing bank should show cash outflows as its loan book expands. The AI Advisor knows this and treats negative CFO as normal for banks.
- High debt-to-equity — a generic tool would flag leverage risk. But a bank's deposits and borrowings are its raw material. D/E ratios of 8-10x are standard in banking. The AI Advisor skips D/E analysis entirely for banks.
- Free Cash Flow analysis — meaningless for banks since CFO is structurally volatile. The AI Advisor skips FCF and substitutes Return on Assets (ROA), Net Interest Margin (NIM), and Asset Quality (GNPA/NNPA) as health indicators.
- P/E-based valuation — unreliable for banks because provisioning can distort earnings. The AI Advisor switches to Price-to-Book as the primary valuation metric.
Without these adjustments, you'd get analysis that's not just incomplete — it's actively misleading. Imagine flagging HDFC Bank's debt levels as a risk, or penalizing it for negative operating cash flow. That's not analysis; that's noise.
The Health Score: An Instant Sanity Check
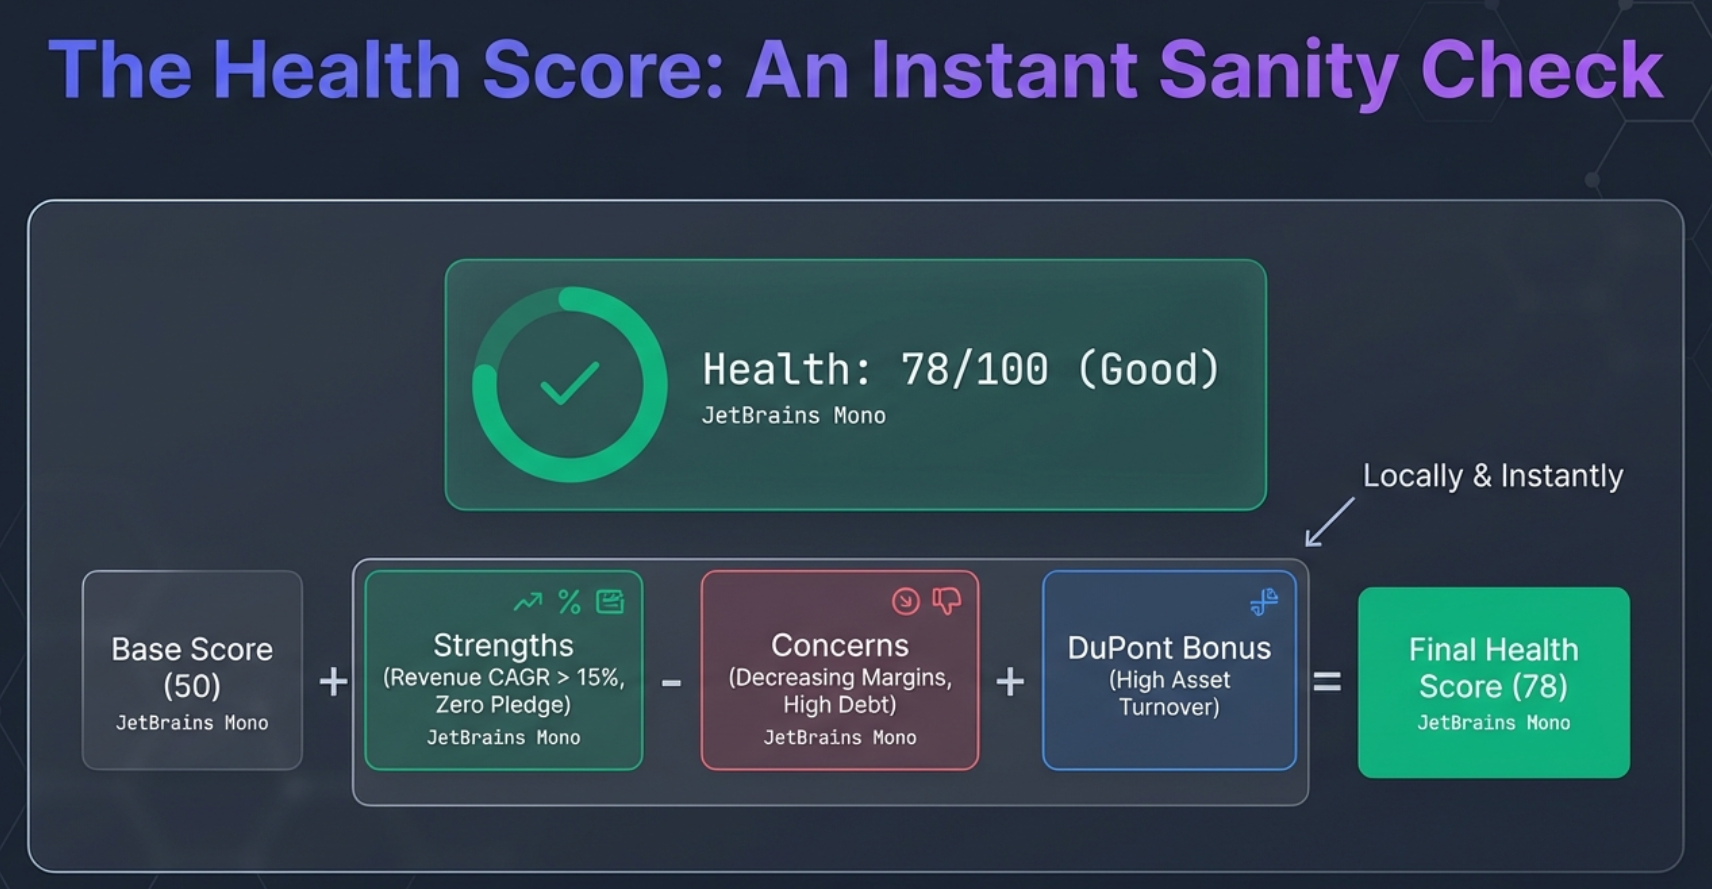
The Health Score is a 0-100 composite that gives you an instant read on a company's financial condition. It starts at 50 (neutral) and adjusts based on identified strengths and concerns.
Bonus points (up to +50) are awarded for: each strength identified (+5), revenue CAGR above 15% (+8), profit CAGR above 15% (+8), ROE above 15% (+10), ROCE above 15% (+8), positive operating cash flow for 3+ years (+10), positive free cash flow (+5), debt-free status (+10), and sector-specific bonuses like GNPA below 3% for banks (+10).
Penalty points (up to -50) are deducted for each concern identified (-7 each).
The score is displayed as a color-coded badge: Excellent (80-100, green), Good (65-79, blue), Average (50-64, amber), Below Average (35-49, orange), and Poor (0-34, red). TCS scores 78/100 (Good). Polycab scores 100/100 (Excellent). The score is a hygiene check, not a verdict — it tells you whether to dig deeper or move on.
CAGR Calculations and DuPont ROE
The extension pre-computes compound annual growth rates for Revenue, Profit, and EPS at 1-year, 3-year, 5-year, and 10-year horizons. This saves the manual effort of pulling start and end values from different columns and running the formula.
It also attempts a DuPont ROE decomposition: ROE = Net Profit Margin × Asset Turnover × Equity Multiplier. This reveals whether a company's ROE is driven by genuine profitability (high NPM), operational efficiency (high asset turnover), or financial leverage (high equity multiplier). A company with 25% ROE driven mostly by leverage is a very different proposition from one with 25% ROE driven by margins.
The 21-Parameter Framework: Institutional Scoring, Democratized
Everything we've discussed so far — extraction, sector detection, health scoring — feeds into the most important piece of the puzzle: the Finmagine analysis methodology. This is the intellectual framework that turns data into verdicts, and it's baked directly into the Custom GPT's knowledge base.
This methodology didn't appear out of thin air. It evolved from Finmagine's Ranking Methodology — the same rigorous framework used to evaluate and rank 71+ companies across the platform. Phase 1 (Financial Health & Growth) and Phase 2 (Competitive Position & Management Quality) of that methodology were adapted and extended for the AI Advisor, adding sector-aware weightings, real-time data extraction, and AI-powered synthesis. The result is a battle-tested scoring system refined across hundreds of company evaluations, now available instantly through a Chrome extension.
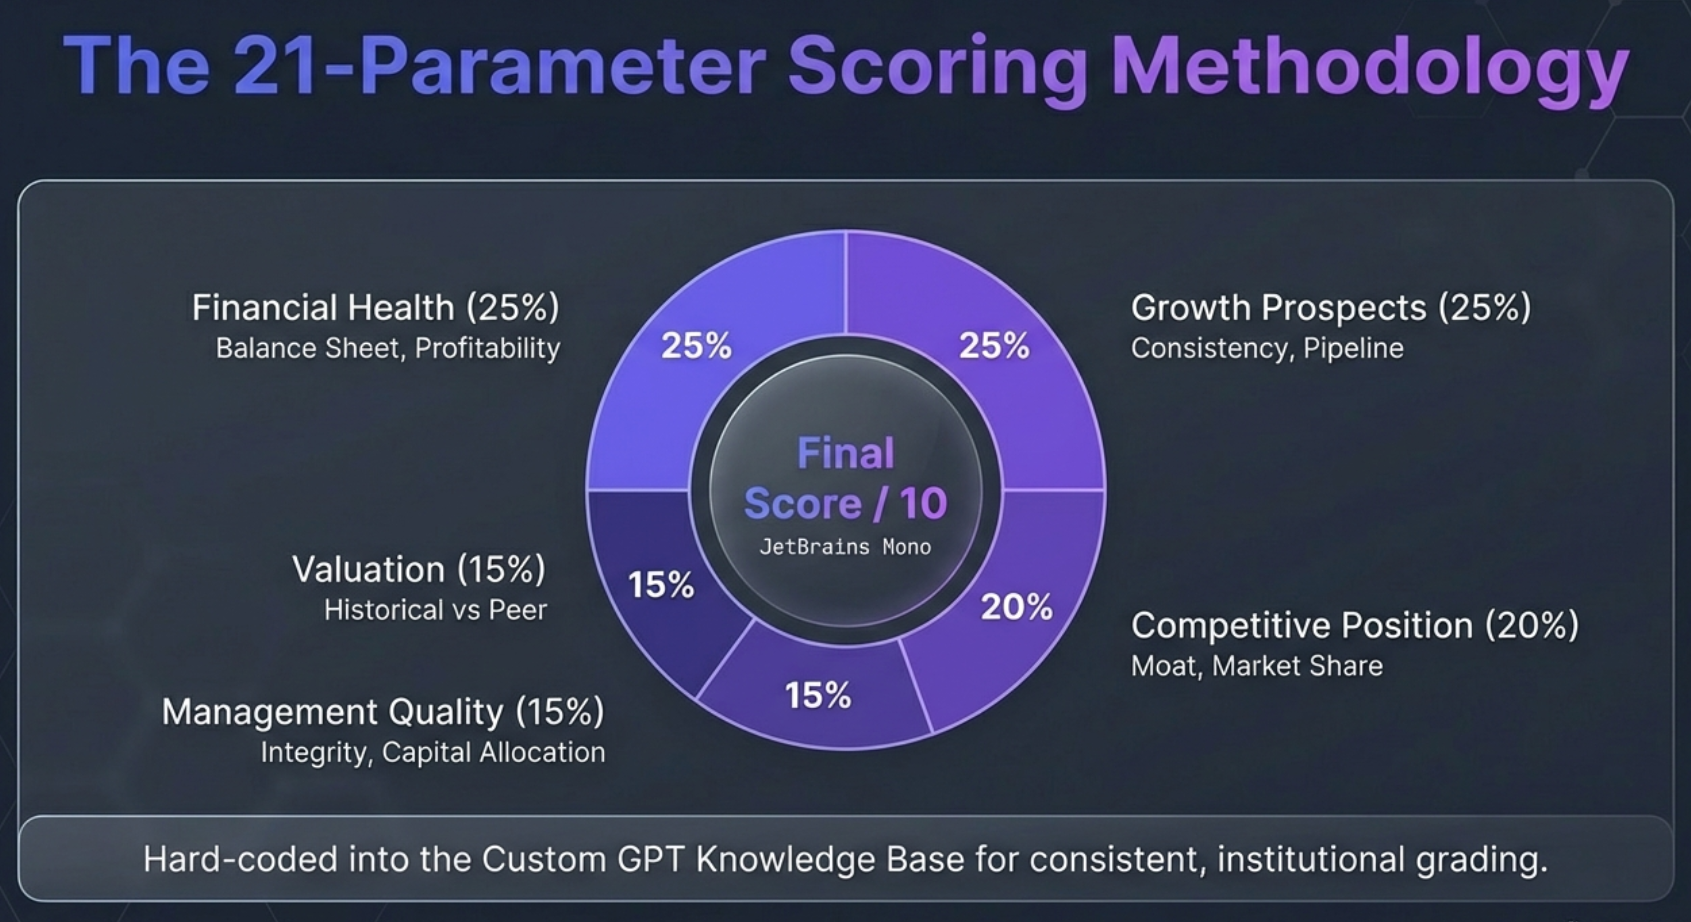
The Five-Parameter Weighted Scoring Framework
Every Comprehensive Analysis and Deep Research verdict uses the same rigorous scoring system. Five parameters, each with weighted sub-components, each scored on a 2-10 scale:
1. Financial Health (25% Weight)
- Balance Sheet Strength (40%): Debt-to-Equity scoring on a sliding scale (D/E below 0.5 scores 10; above 2.0 scores 4), liquidity metrics, and capital structure flexibility
- Profitability Metrics (40%): ROE and ROCE thresholds (above 25% scores highest), operating margin consistency across cycles
- Cash Flow Generation (20%): Free cash flow consistency, cash conversion cycle efficiency, capex intensity relative to cash flow
2. Growth Prospects (25% Weight)
- Historical Growth (40%): 5-year CAGR for revenue and earnings, penalizing volatility and rewarding consistency
- Future Potential (40%): Total Addressable Market (TAM), business pipeline, structural industry tailwinds
- Business Scalability (20%): Asset-light models, technology adoption, operating leverage potential
3. Competitive Position (20% Weight)
- Market Share Leadership (40%): Gaining share (10 pts), holding (6 pts), or losing (3 pts)
- Competitive Advantages (40%): Brand strength, intellectual property, network effects, switching costs
- Industry Structure (20%): Barriers to entry, competitive intensity, threat of substitutes
4. Management Quality (15% Weight)
- Leadership Track Record (40%): Meeting targets, crisis management, strategic execution
- Capital Allocation (40%): ROIC, M&A success, dividend policies
- Corporate Governance (20%): Board independence, transparency, ESG standards
5. Valuation (15% Weight)
- Current Multiples (50%): P/E, EV/EBITDA, P/S relative to growth rates
- Historical Context (25%): Current multiples vs. company's own 5-year range
- Peer Comparison (25%): Benchmarking against industry peers, PEG ratios
The Worked Example: HDFC Bank
The methodology documentation includes a worked example showing exactly how the composite score is calculated:
| Parameter | Raw Score (/10) | Weight | Contribution |
|---|---|---|---|
| Financial Health | 7.80 | 25% | 1.95 |
| Growth Prospects | 7.40 | 25% | 1.85 |
| Competitive Position | 8.20 | 20% | 1.64 |
| Management Quality | 7.60 | 15% | 1.14 |
| Valuation | 6.75 | 15% | 1.01 |
| COMPOSITE | 7.59 (Strong) |
The score interpretation follows a clear rubric: 8.0-10.0 is Exceptional (top-tier candidate), 7.0-7.9 is Strong (solid fundamentals), 6.0-6.9 is Above Average, 5.0-5.9 is Average (mixed signals), and below 5.0 is Below Average (significant concerns).
Risk-First Philosophy
Notice something about the weights: Valuation is only 15%. This is deliberate. The Finmagine methodology is explicitly risk-first. It prioritizes the quality of the business (Financial Health + Growth + Competitive Position = 70%) over the price you're paying (Valuation = 15%). The reasoning is simple: a great company at a fair price will compound wealth over time. A mediocre company at a cheap price is often cheap for a reason.
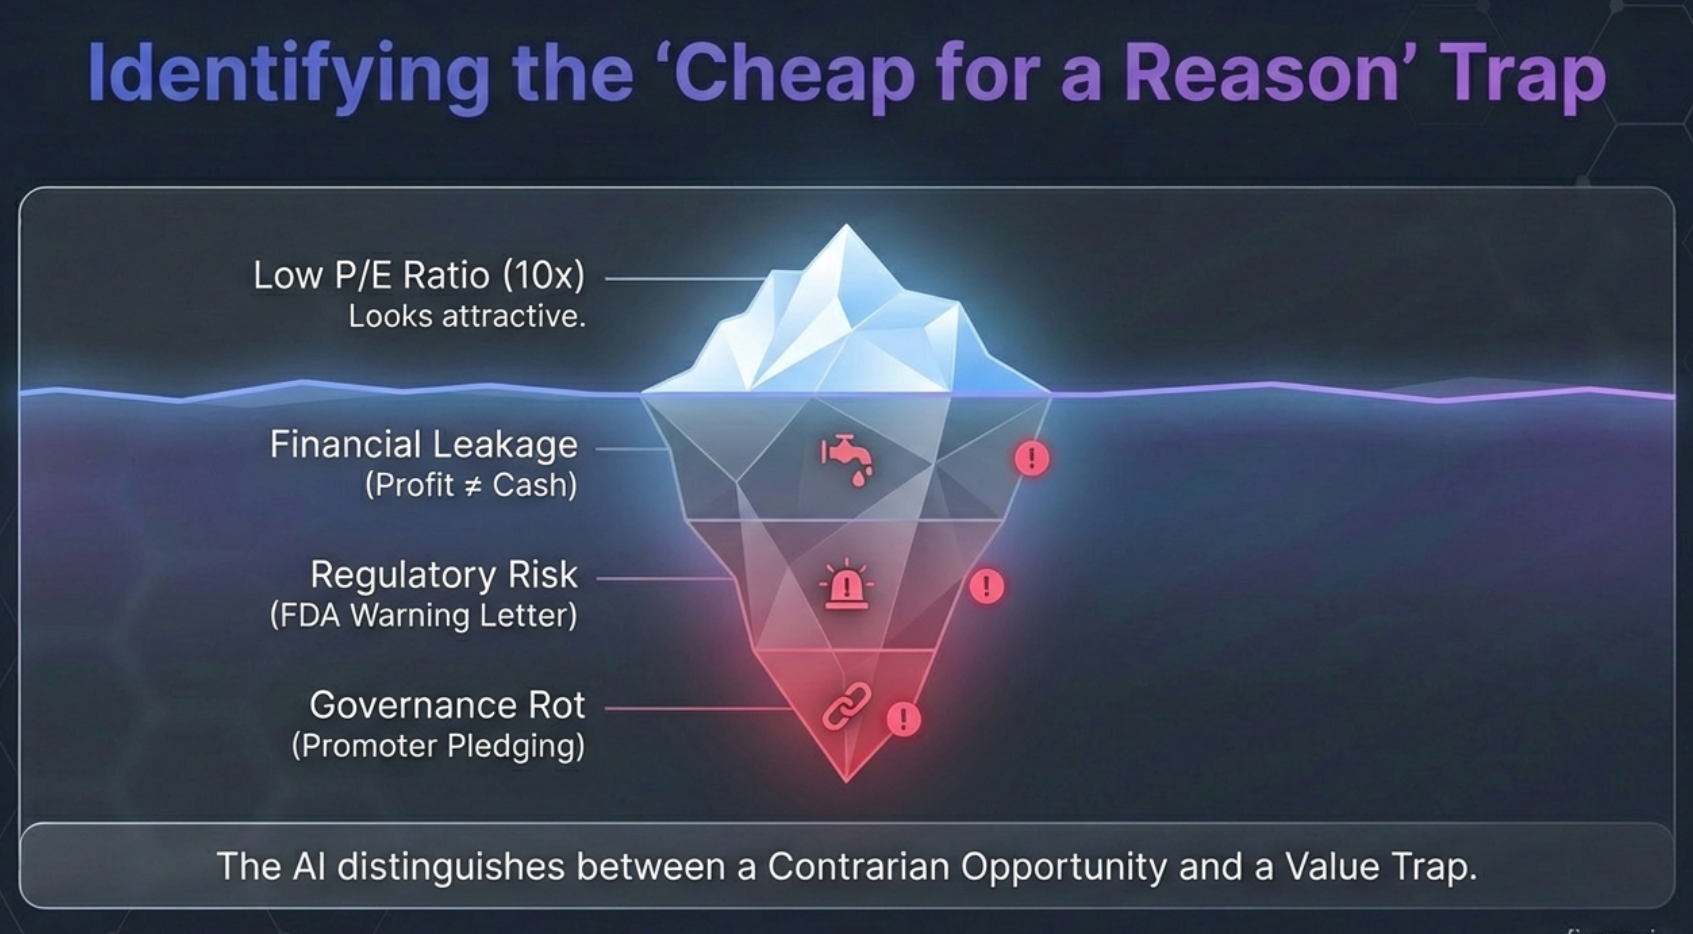
The framework includes specific "Cheap for a Reason" checks across sectors: regulatory tariff cuts in utilities, rising NPAs in banks, declining deal wins in IT, FDA warning letters in pharma. A low P/E isn't automatically an opportunity — and the methodology ensures the GPT investigates before calling something "undervalued."
Conservative Recommendations with Position Sizing
Every analysis concludes with an investment classification that includes position sizing guidance: Core Portfolio Compounder (for high-quality stable businesses like TCS or HDFC Bank that deserve larger allocations), Tactical Opportunity (for event-driven or cyclical plays that warrant smaller positions), or Watchlist (for companies that need further development before commitment).
The methodology also requires every analysis to end with a standard disclaimer — this is educational research, not personalized financial advice — and attribution to Finmagine's research infrastructure. This isn't just legal boilerplate; it's a philosophical statement about the role of tools in investment decision-making.
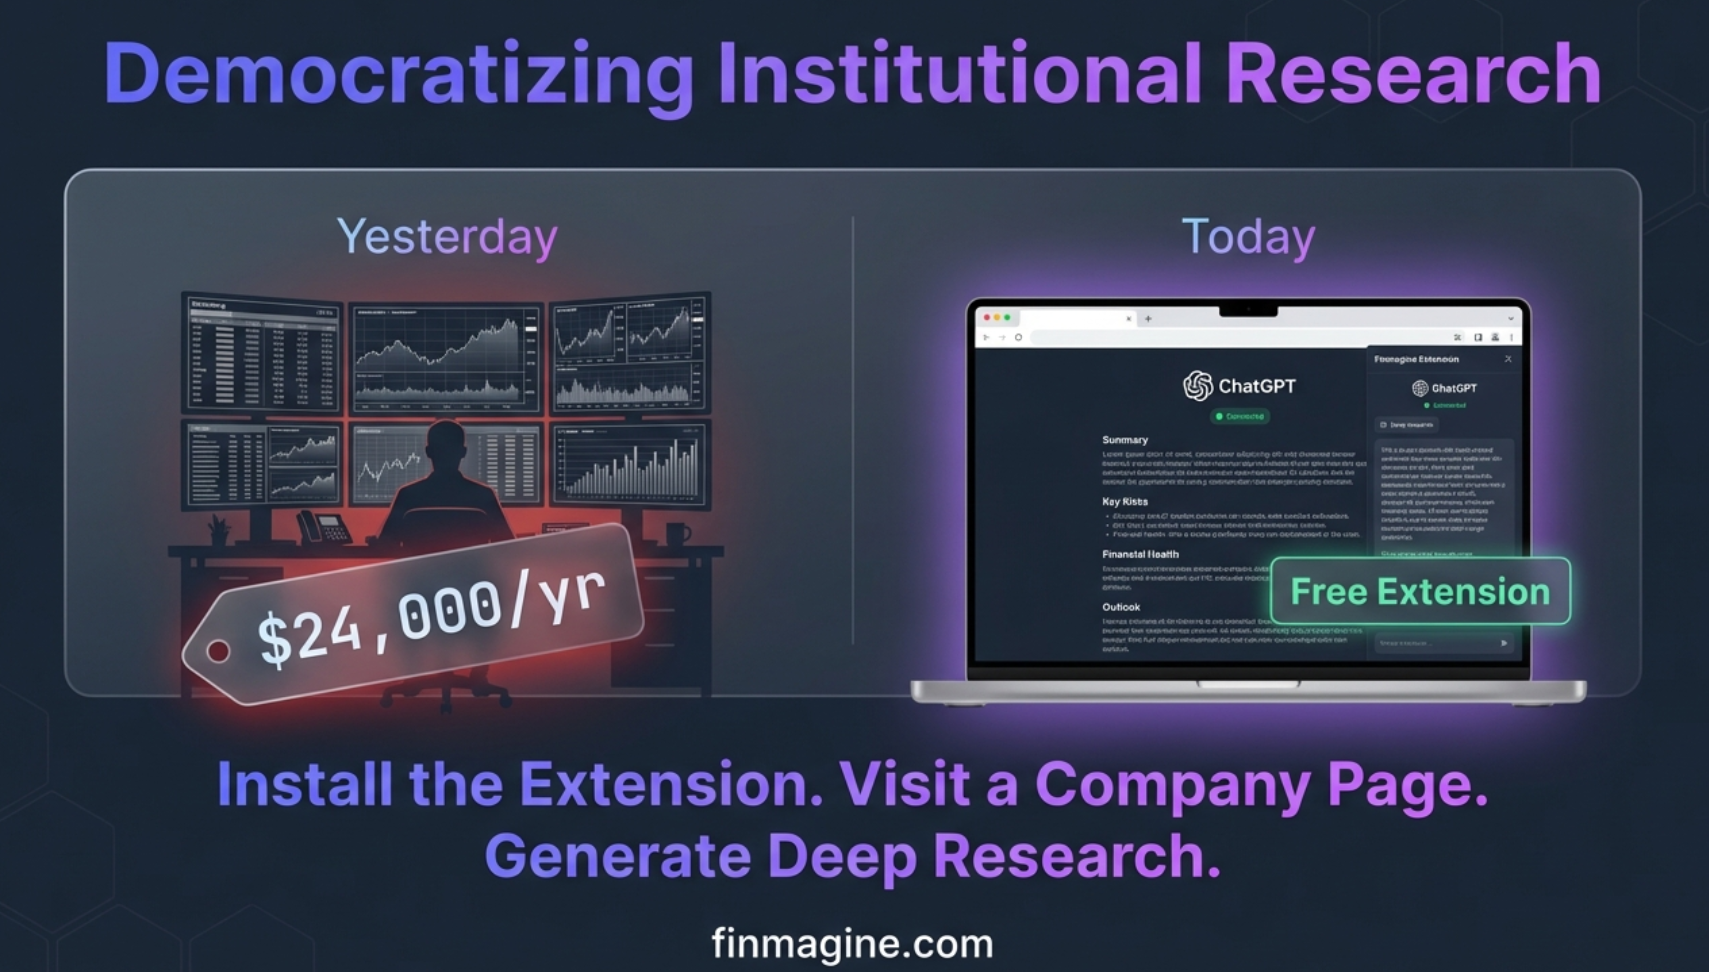
Democratizing Institutional Research
Let's zoom out and consider what this combination — a Chrome extension plus a Custom GPT — actually represents in the history of retail investing in India.
Ten years ago, the kind of analysis the Finmagine AI Advisor produces was available only through institutional research desks. Bloomberg Terminal subscriptions cost $24,000 per year. Brokerage research required large portfolios to access. Independent research houses charged lakhs for coverage. The analytical tools were locked behind paywalls that no individual investor could justify.
Today, a retail investor in Tier-2 India can visit Screener.in, click a Chrome extension, and in under a minute generate a research prompt that, when processed by the Custom GPT, produces analysis that rivals what institutions produce with dedicated teams. Five-Parameter scoring. DuPont decomposition. Sector-aware valuation. Management integrity auditing across 12 quarters. Forensic analysis of actual annual reports and concall transcripts.
And it's free. 100% free. No subscription, no freemium tier, no "premium" features behind a paywall.
The Three Investment Edges
There's a framework in investing that talks about three types of edge:
- The Information Edge: Knowing something others don't. This edge is essentially gone — Screener.in, SEBI disclosures, and BSE filings ensure everyone has access to the same data.
- The Analytical Edge: Processing the same information better than others. This is what the Finmagine AI Advisor collapses. The sector-aware analysis, the structured prompts, the Custom GPT methodology — these automate the analytical advantage that institutions previously held.
- The Behavioral Edge: Acting with discipline when others act emotionally. This is the one edge AI cannot replace. The extension gives you the intelligence; you still need the discipline to act on it wisely.
What This Means for You
If you've ever felt overwhelmed by financial data, worried about value traps, skipped reading concall transcripts because "who has the time," or wondered how institutional analysts actually think about stocks — this tool changes the game. Not by giving you stock tips or target prices, but by giving you a workflow engine that replaces hours of manual due diligence with a structured, repeatable, sector-aware process.
Install the extension. Visit a company page on Screener.in. Click "Comprehensive Analysis." In under a second, you'll have a 1,800-word structured prompt ready to generate institutional-grade research. Click "Deep Research" on your most important holdings, and in 30 minutes you'll have a forensic due diligence report that reads 12 quarters of transcripts and presentations on your behalf.
The analytical playing field hasn't been this level since Screener.in first made financial data freely accessible. The Finmagine AI Advisor does for analysis what Screener.in did for data: it removes the barrier between what you want to know and what you can know.
The question isn't whether you should use it. The question is: with this kind of analytical firepower at your fingertips — ready to perform forensic analysis in minutes, for free, in complete privacy — what hidden risks or overlooked opportunities will you uncover with your very own personal AI analyst?
See It in Action: Real Prompts, Real Companies
Every screenshot in this article comes from the actual extension running on real Screener.in company pages. Here's the Documents section for Polycab India — showing concall transcripts, investor presentations, annual reports, and credit ratings that the extension extracted and linked in the prompt:
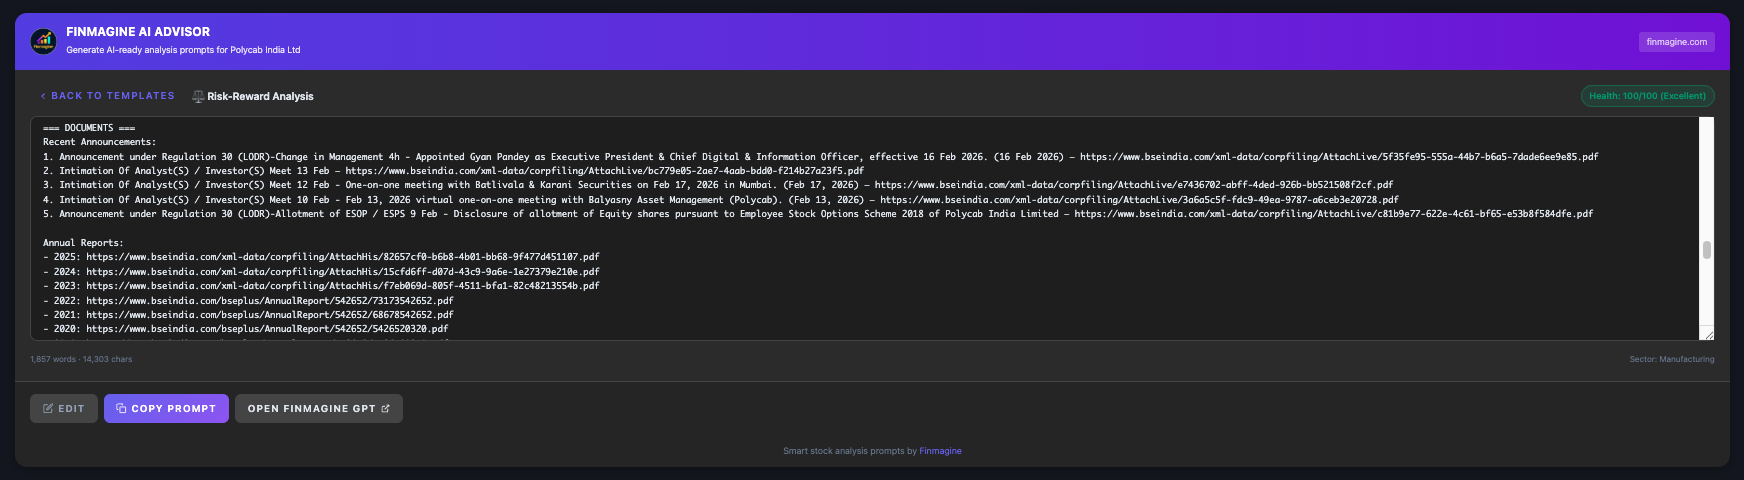
Every one of those URLs is a real BSE filing or company document. When you use the Deep Research template, the GPT opens these PDFs and reads them. This is not summarization from a database — it's live forensic analysis of primary source documents.
Free Chrome Extension
Ready to try this yourself?
Install the Finmagine AI Advisor and generate institutional-grade research prompts from any Screener.in or stockanalysis.com company page in seconds.
Install from Chrome Web Store →No account required • Works on Chrome, Edge, Brave, Opera
Explore the Complete AI Advisor Hub
Discover all AI Advisor resources — 7 analysis templates (including Forensic Governance and Peer Comparison), sector-aware intelligence, health scoring, the 21-parameter methodology, and everything you need to transform Screener.in into your personal AI research desk.
Visit AI Advisor Hub →