Following along? Install the extension first
Finmagine AI Advisor — free • no account needed • Chrome, Edge, Brave
Multimedia Learning Hub
Master Forensic Analysis through video, audio deep dive, and interactive knowledge testing
Complete Learning Path
This tutorial is a complete guide to the Forensic Analysis template — the featured US stock template in the Finmagine AI Advisor Chrome Extension. You'll learn what makes it different from every other template, how each of its 7 parts works, and see a complete real-world example using Amazon (AMZN) with actual GPT output.
What You'll Learn:
- Why Forensic Analysis exists: The gap it fills versus Comprehensive, Risk-Reward, and Quarterly templates
- The /forecast/ page: How forward estimates and analyst consensus trend data are extracted and what they reveal
- Part 1 — Financial Forensics: P&L dissection, balance sheet evolution, cash flow scrutiny, ratio trend analysis
- Part 2 — Financial Health: Altman Z-Score and Piotroski F-Score interpreted in forensic context
- Part 3 — Value Creation: ROIC-WACC spread trend and capital allocation assessment
- Part 4 — Ownership & Sentiment: Insider, institutional, and short interest forensics
- Part 5 — Analyst Consensus Forensics: Recommendation trend, price target spread, forward estimate quality
- Part 6 — Valuation Forensics: Multi-metric triangulation and earnings yield vs risk-free rate
- Part 7 — Final Verdict: Bull/base/bear synthesis and Five-Parameter Score
- AMZN Case Study: Real GPT output dissected section by section
Key Skills You'll Master:
- Run a 7-part forensic investigation on any US-listed stock in under 10 minutes
- Interpret analyst consensus trends — not just the current snapshot, but the direction of change
- Identify when analyst forward estimates are extrapolating vs pricing in a step-change
- Understand when FCF suppression is a red flag vs a strategic investment signal
- Triangulate valuation across 6 metrics and identify which one tells the most honest story
Watch: Forensic Analysis in Action
See the Forensic Analysis template run on a live US stock page, from template selection to final GPT output.
▶ The “Enough” Problem in Investing — Forensic Stock Analysis with Finmagine AI (Amazon Case Study)
Listen: The “Enough” Problem in Investing
A ~25-minute NotebookLM deep dive — two hosts interrogate the 7-part framework, the AMZN CapEx paradox, and what forensic analysis reveals that headlines never will. Dense with real numbers throughout.
🎙️ Generated by NotebookLM — covers Z-Score, F-Score, ROIC-WACC, analyst forensics, and the Amazon CapEx bet in full depth
Test Your Knowledge
Click any flashcard to reveal the answer. Use the search box to find specific topics.
Forensic Analysis — the featured US stock template: no documents, no guesswork, pure numbers. A 7-part systematic interrogation of the financial evidence.
What Is Forensic Analysis — And Why It's Not Deep Research
Every investment analysis tool eventually confronts a question: how deep is deep enough? The Finmagine AI Advisor already offered three US stock templates — Comprehensive, Risk-Reward, and Quarterly Deep-Dive — but something was missing. None of them systematically interrogated the numbers the way a forensic accountant would. None of them treated analyst consensus as a signal to be dissected rather than simply noted. And none of them dedicated a section to the quality of forward estimates: are analysts extrapolating history, or pricing in a step-change?
Forensic Analysis fills that gap. It is the featured template for US stocks — the card that appears highlighted in the AI Advisor panel the moment you land on a stockanalysis.com page. It runs a 7-part, 18-task quantitative investigation using every data point the extension extracts: five years of P&L, balance sheet, and cash flow data; Altman Z-Score; Piotroski F-Score; ROIC-WACC spread; insider, institutional, and short interest ownership; analyst recommendation trends over three months; forward EPS and revenue estimates; and multi-metric valuation.
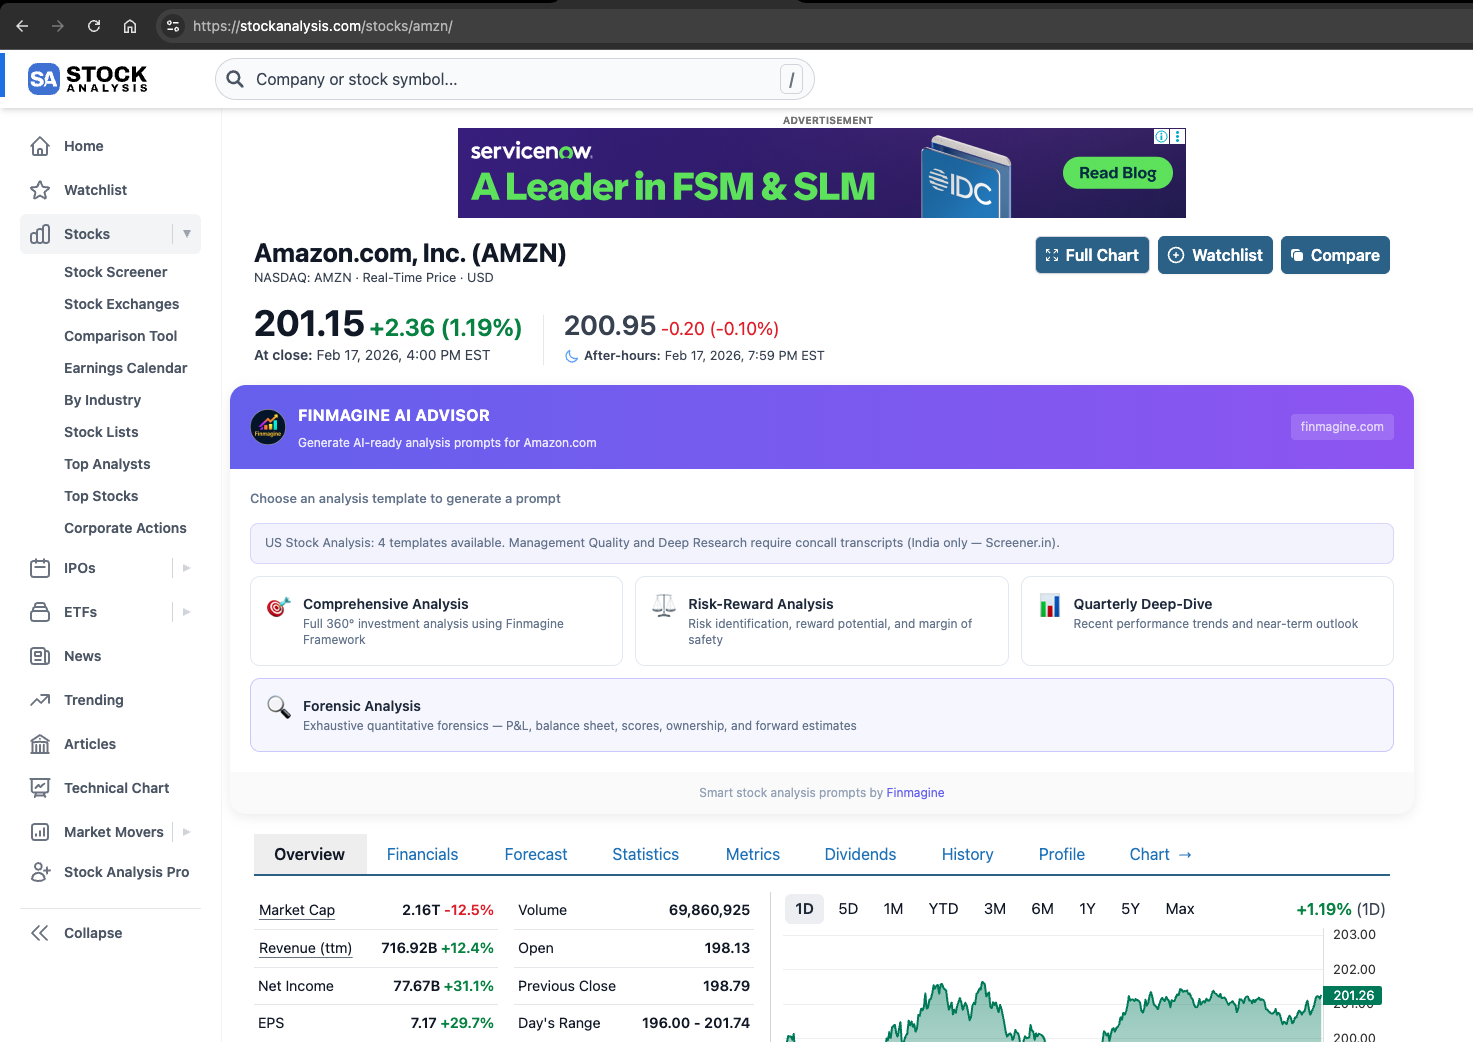
The Forensic Analysis card is the featured (highlighted) template for US stocks in the AI Advisor panel
Why Not Call It "Deep Research"?
The Finmagine AI Advisor has a template called Deep Research for Indian stocks on Screener.in. It is a 9-part, 15–30 minute analysis that instructs the GPT to browse and read 12+ PDF documents — concall transcripts, investor presentations, annual reports — in addition to the financial data. That qualitative document-reading capability is what makes it "research" in the full sense.
US stocks on stockanalysis.com do not provide concall transcripts, investor presentation PDFs, or annual report links on their free pages. So a US "Deep Research" template would be a misnomer — you'd be promising document analysis that isn't possible. Forensic Analysis is honest about what it is: a rigorous, systematic, entirely quantitative investigation. The word "forensic" is deliberate. A forensic accountant doesn't need management's word for anything — they read the numbers, and the numbers tell the story.
| Dimension | Forensic Analysis (US) | Deep Research (India) |
|---|---|---|
| Platform | stockanalysis.com only | Screener.in only |
| Document reading | None — purely quantitative | GPT browses 12+ PDFs |
| Analyst forward data | Consensus trend + forward EPS/Revenue | Not available |
| Financial scores | Altman Z-Score, F-Score, ROIC-WACC | Not pre-computed |
| Ownership data | Institutional %, Insider %, Short Interest % | Promoter %, FII %, DII % |
| Management assessment | Capital allocation + insider alignment | Concall-based integrity scorecard |
| GPT time | 5–8 minutes | 15–30 minutes (PDF reading) |
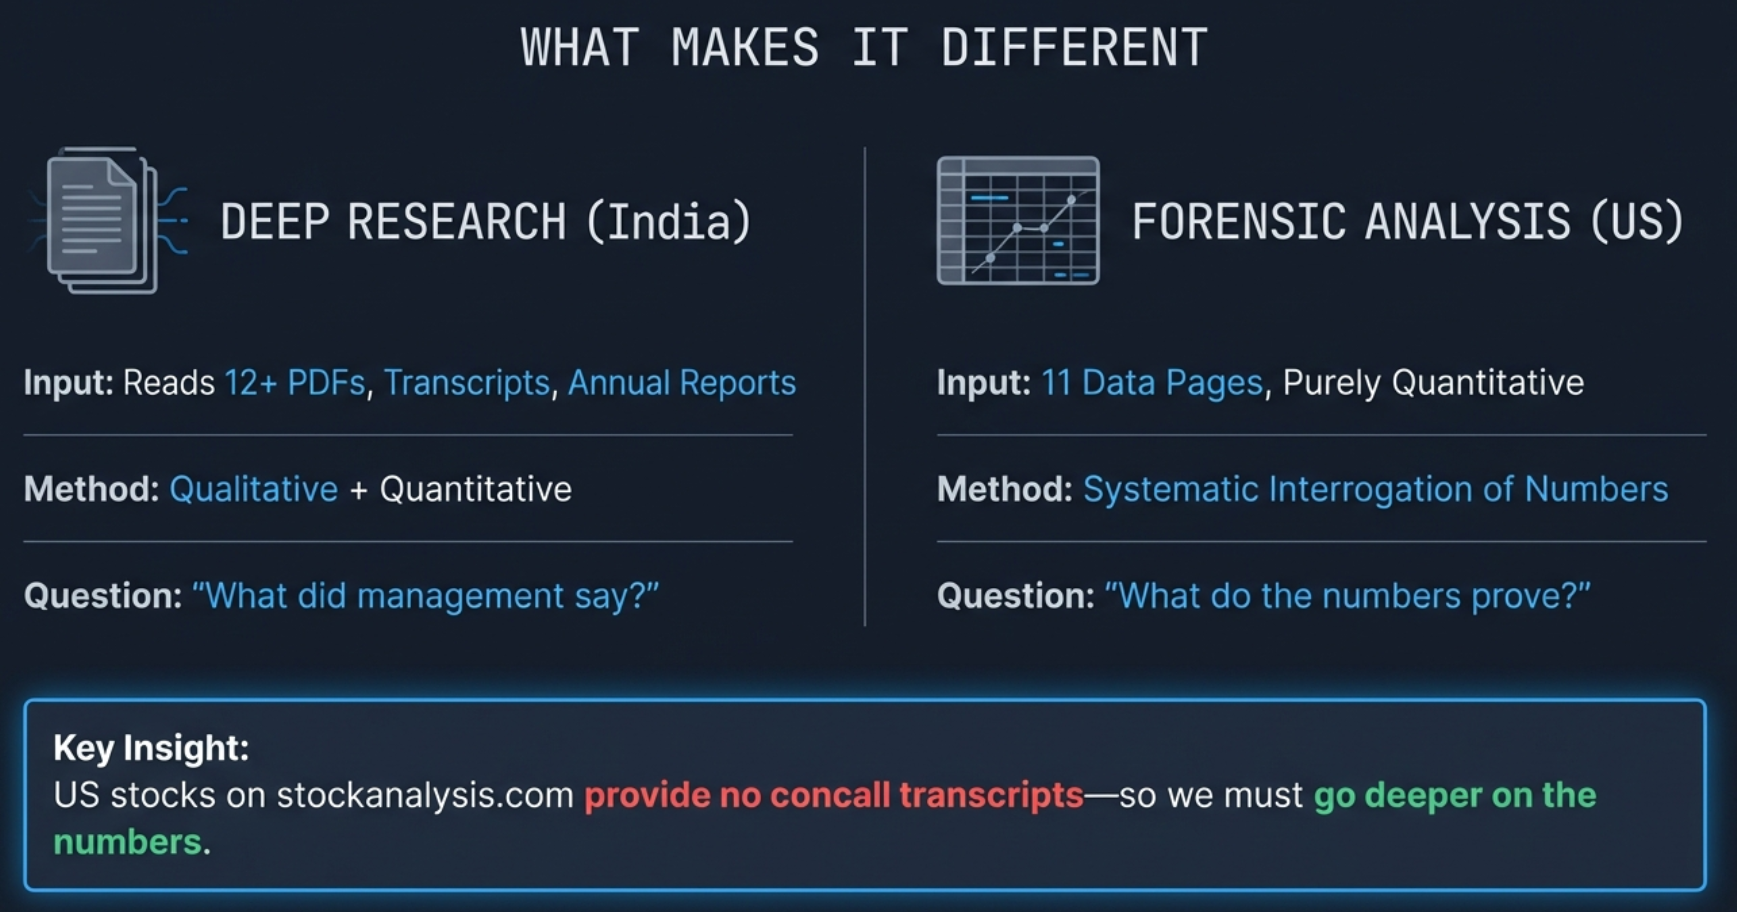
The fundamental distinction: Deep Research (India) listens to management's story through 12+ PDFs. Forensic Analysis (US) ignores the story and reads the evidence the numbers left behind.
The Analyst Intelligence Layer — Forward Estimates from the /forecast/ Page
Every other US template uses data from 10 stockanalysis.com pages. Forensic Analysis fetches an 11th page: the /forecast/ subpage for each stock. This page is where analyst consensus comes alive — not just as a current snapshot ("Buy/Hold/Sell") but as a dynamic dataset showing how sentiment is moving, how wide the disagreement is, and whether forward estimates are ambitious or merely extrapolated.
What the /forecast/ Page Provides
1. Analyst Price Target Range
Rather than a single consensus price target, the extension extracts the full distribution: Low, Average, Median, and High. The spread between these values is more informative than the average alone. A narrow spread signals analyst confidence. A wide spread — where the low target is 40% below the average — signals that analysts fundamentally disagree about the company's future.
2. Recommendation Trend (3-Month Window)
This is one of the most underused signals in retail investing. Rather than just knowing that 45 analysts rate the stock "Buy", Forensic Analysis tracks how that number has changed over the past three months. Strong Buy counts falling from 21 to 17, with Hold counts rising from 1 to 4, tells a very different story than a stable distribution. The direction of consensus often leads price by several months.
3. Forward Annual Estimates (FY+1 and FY+2)
The forecast page provides analyst consensus estimates for the next two fiscal years: Revenue, Revenue Growth, EPS, EPS Growth, Forward P/E, and Number of Analysts contributing. The extension extracts the free-tier rows (FY+1 and FY+2) and passes them to the GPT for quality assessment — a process described in Part 5 of the framework.
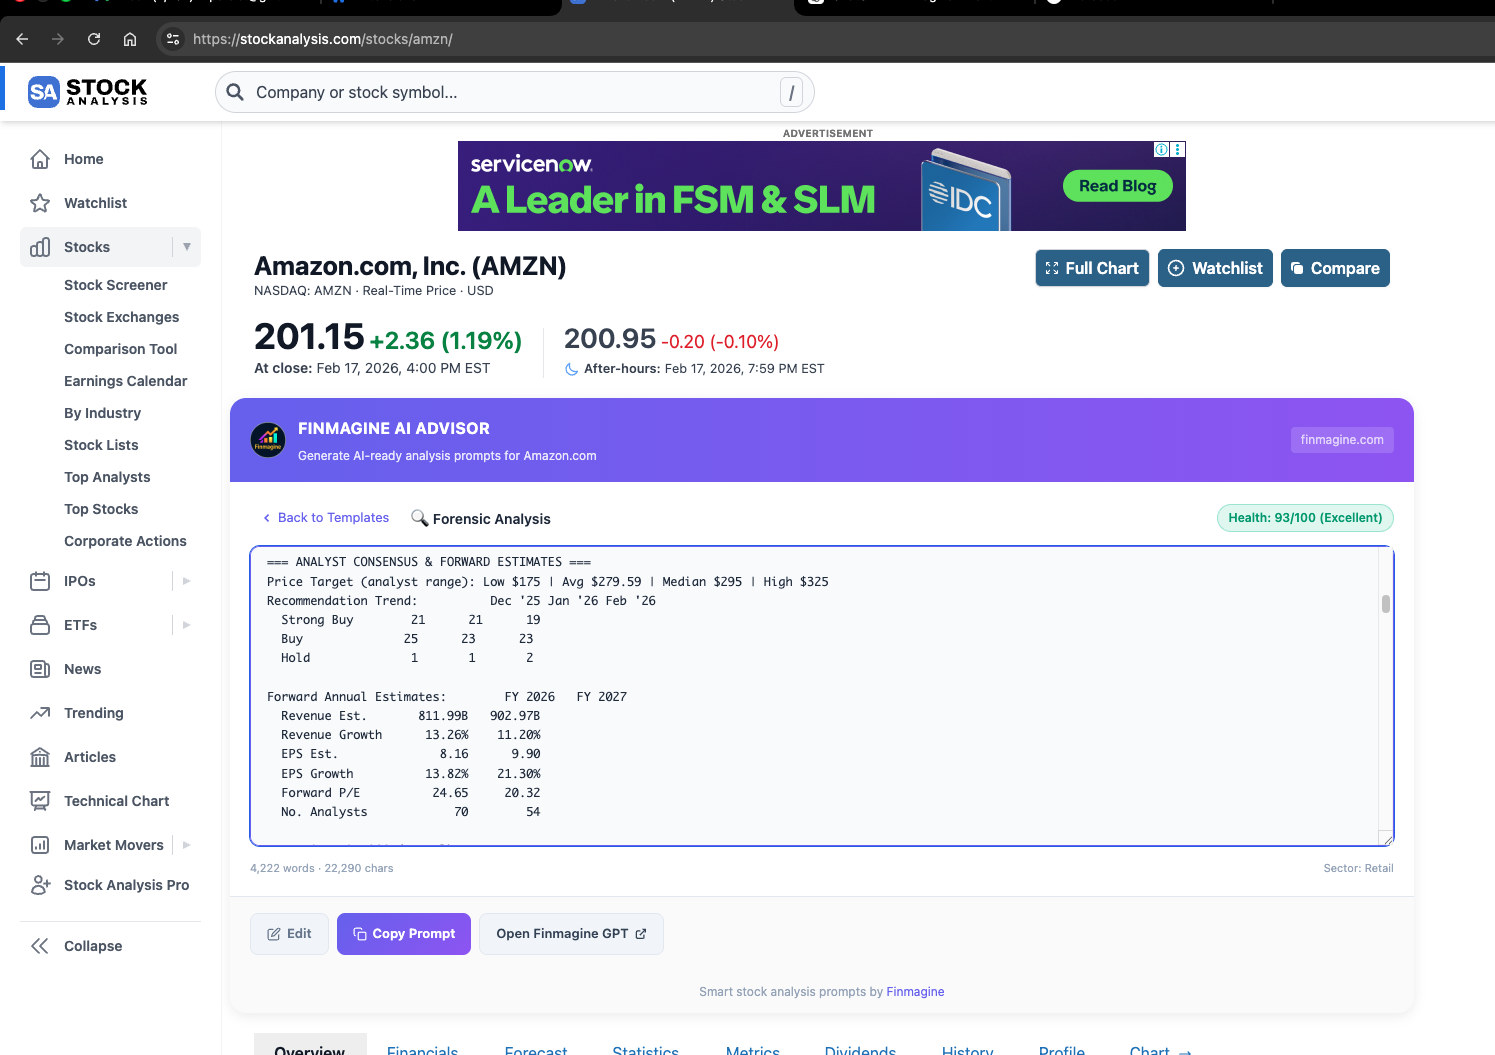
The Analyst Consensus & Forward Estimates section is populated from the /forecast/ page — a dedicated 11th data source fetched only for Forensic Analysis
Rate Limiting — Why Loading Takes 15–20 Seconds
stockanalysis.com rate-limits aggressive fetching. The extension batches its requests in pairs with 800ms gaps between batches — and the /forecast/ page is fetched in Phase 2 of this pipeline, after the core financial data. This means the full data load for Forensic Analysis typically takes 15–20 seconds. The instant UI shell renders the panel immediately, but the Forensic Analysis card activates only once all 11 pages have been processed. Do not close or refresh the panel during this loading window.
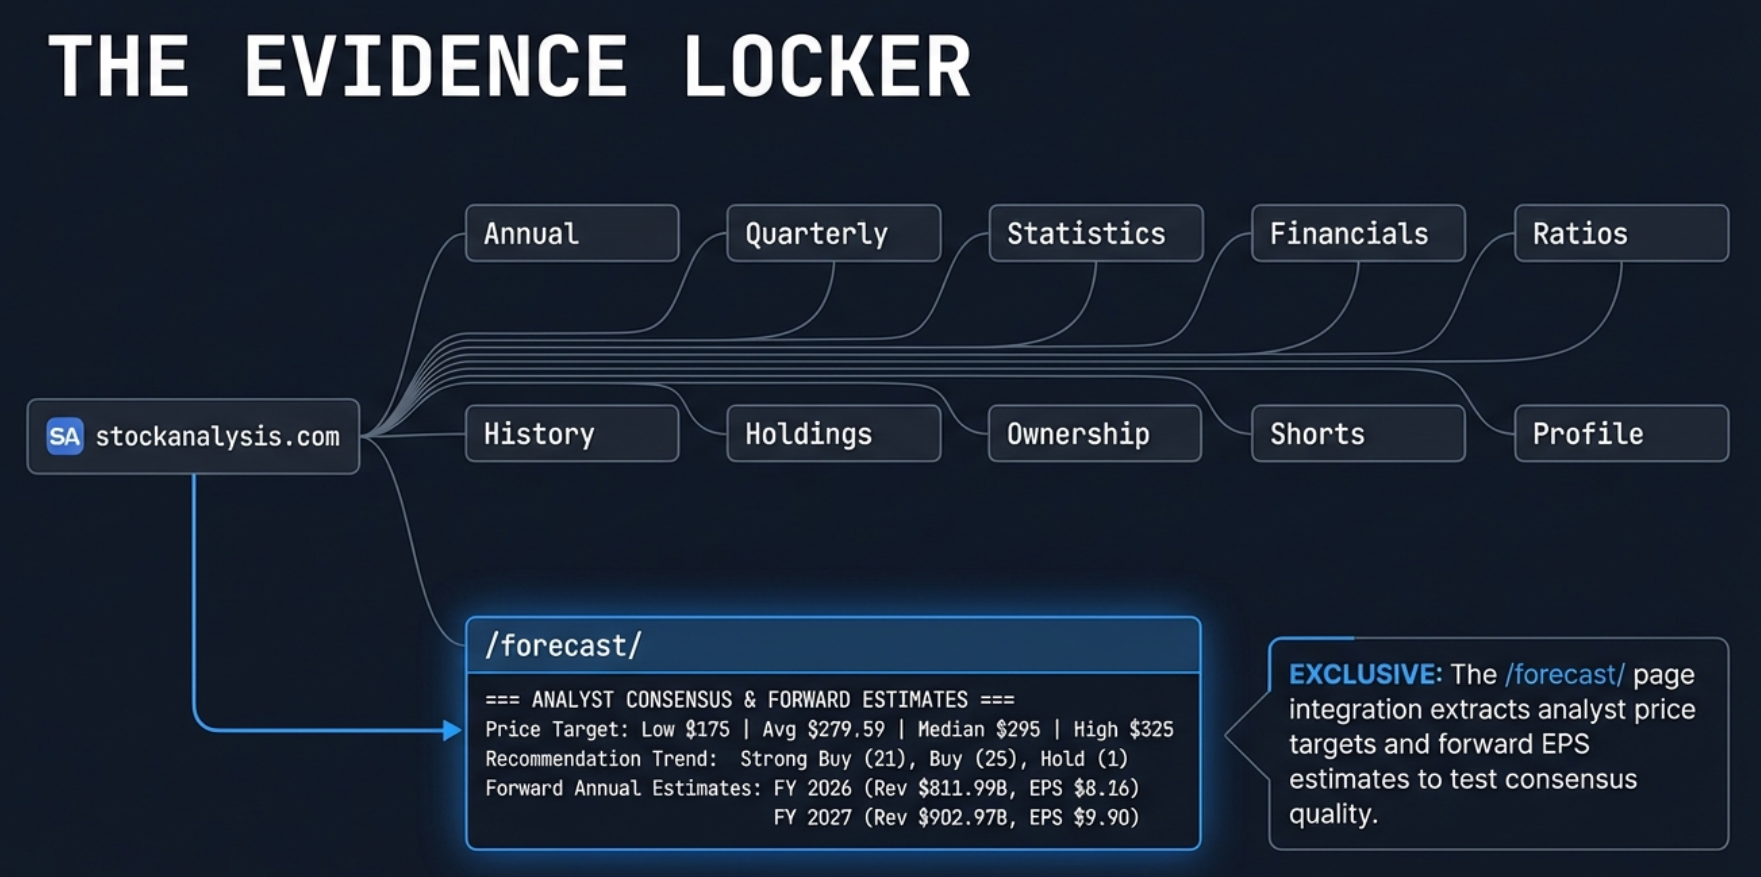
The Evidence Locker: 11 pages fetched in staggered batches. The /forecast/ page (highlighted) is exclusive to Forensic Analysis — where analyst price targets, recommendation trends, and forward EPS estimates live.
Part 1: Financial Forensics — What Do the Numbers Actually Say?
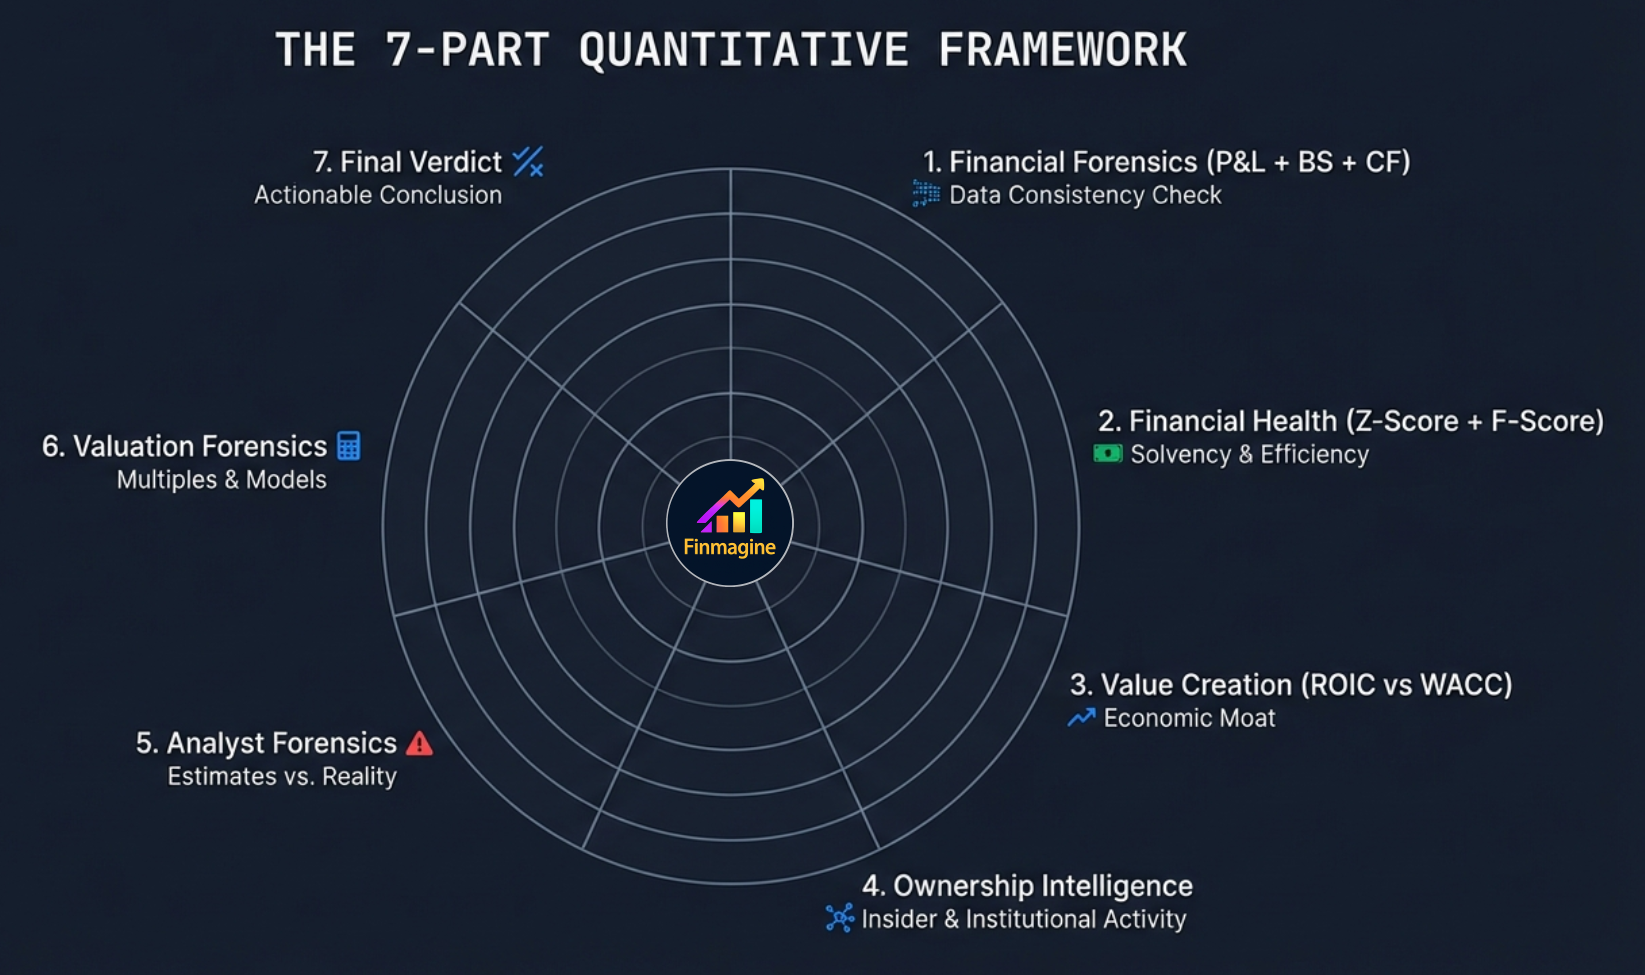
The 7-Part Forensic Framework: each investigation orbits from raw financial evidence (Part 1) through health scores, value creation, ownership, analyst intelligence, and valuation, converging on the final actionable verdict (Part 7).
The foundation of every forensic investigation is the financial statements. Part 1 covers four systematic tasks — P&L, Balance Sheet, Cash Flow, and Ratio Trends — with an explicit mandate: do not just describe the numbers. Interrogate them. Find the concerning reversals, the positive inflections, the divergences between revenue growth and margin trends, the gaps between reported profit and actual cash generation.
Task 1: Profit & Loss Dissection
The GPT examines five years of revenue growth, operating leverage, margin trajectory, and earnings quality. The goal is not to summarize — it's to find structural patterns:
- Is revenue growth accelerating, decelerating, or stable?
- Is operating leverage real — are margins expanding faster than revenue?
- Are earnings quality indicators (cash flow vs reported profit) consistent?
- Are there one-time items inflating or deflating any year?
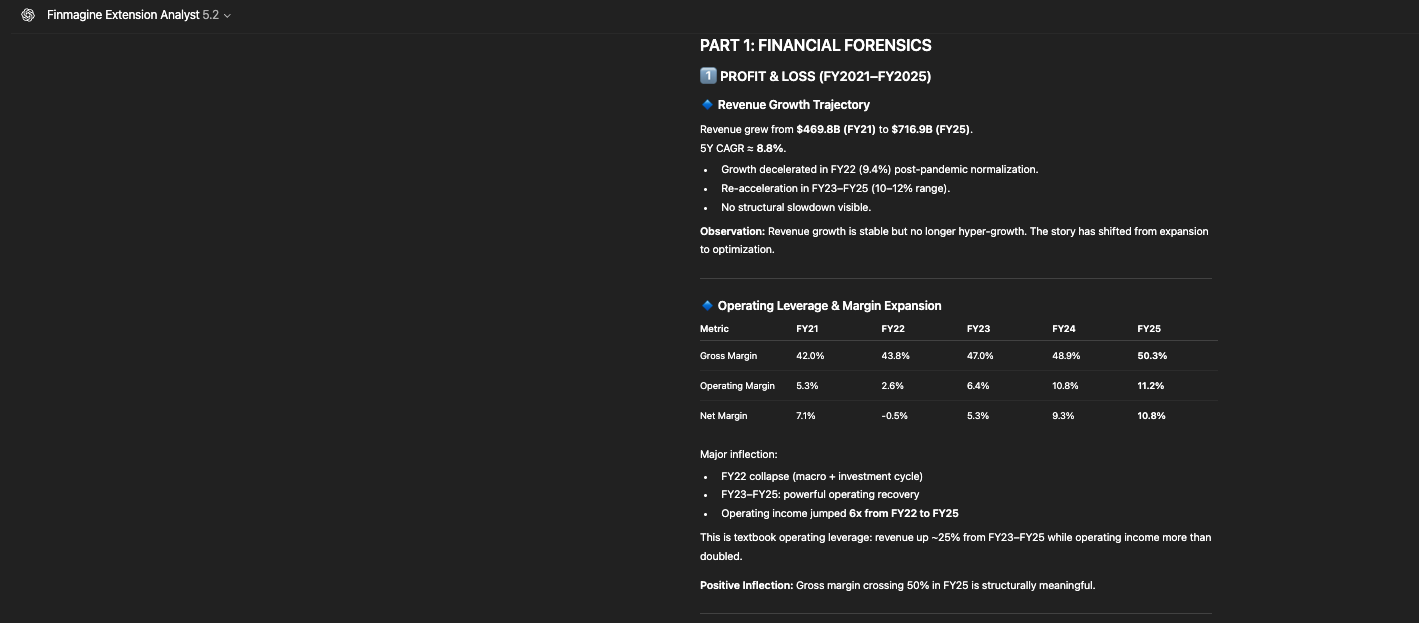
Amazon's P&L forensics: gross margin crossing 50% in FY25 is structurally meaningful — but FY25 net income includes a $15.3B gain on sale of investments
Task 2: Balance Sheet Forensics
The balance sheet reveals how a company is funding its growth — and whether that funding is sustainable. Key questions:
- Is debt-to-equity improving or deteriorating over five years?
- Is working capital positive and stable? If it turned negative, when and why?
- Is asset growth driven by productive capacity (PP&E) or financial engineering (goodwill from acquisitions)?
- Is interest coverage sufficient even in a stress scenario?
Task 3: Cash Flow Scrutiny
Cash flow statements are harder to manipulate than income statements. Forensic Analysis specifically looks for divergence between operating cash flow and net income (the accrual gap), the trajectory of free cash flow, capex intensity trends, and the financing pattern (is debt being used to fund operations or to fund growth?).
Task 4: Ratio Trend Analysis
The GPT explicitly tracks the 5-year trend for: ROE, ROIC, ROCE, gross margin, operating margin, FCF margin, asset turnover, inventory turnover, and interest coverage. For each metric, it identifies whether the trend is structurally improving or structurally deteriorating — not just higher or lower than last year, but whether the direction of change is systemic or situational.
| Metric | What Improving Trend Signals | What Deteriorating Trend Signals |
|---|---|---|
| ROIC | Capital is being deployed more efficiently | New investments earning lower returns |
| Asset Turnover | Revenue growing faster than assets | Asset-heavy shift; lower capital efficiency |
| FCF Margin | Cash conversion improving | Capex or working capital consuming cash |
| Operating Margin | Operating leverage; cost control | Input cost pressure; pricing power erosion |
| Interest Coverage | Debt becoming more manageable | Earnings deteriorating relative to debt burden |
Parts 2 & 3: Financial Health & Value Creation Forensics
Parts 2 and 3 use three institutional-grade metrics that are pre-computed by stockanalysis.com and extracted from the Statistics page — metrics that are simply not available for Indian stocks on Screener.in. Together, they answer two of the most important questions in investing: Is this company financially sound? and Is it actually creating shareholder value?
Part 2: Altman Z-Score — Bankruptcy Probability
Developed by Professor Edward Altman in 1968, the Z-Score combines five financial ratios into a single score that predicts the probability of bankruptcy within two years. It isn't just a safety check — in forensic analysis, it reveals which components of a company's financial structure are strong and which are dragging the score down.
| Zone | Z-Score | Meaning | Forensic Treatment |
|---|---|---|---|
| Safe | > 2.99 | Low bankruptcy risk | Positive contributor to Financial Health score |
| Grey | 1.81 – 2.99 | Uncertain territory | GPT investigates which of the 5 components are failing |
| Distress | < 1.81 | High bankruptcy risk | Major flag; solvency section prominent in final verdict |
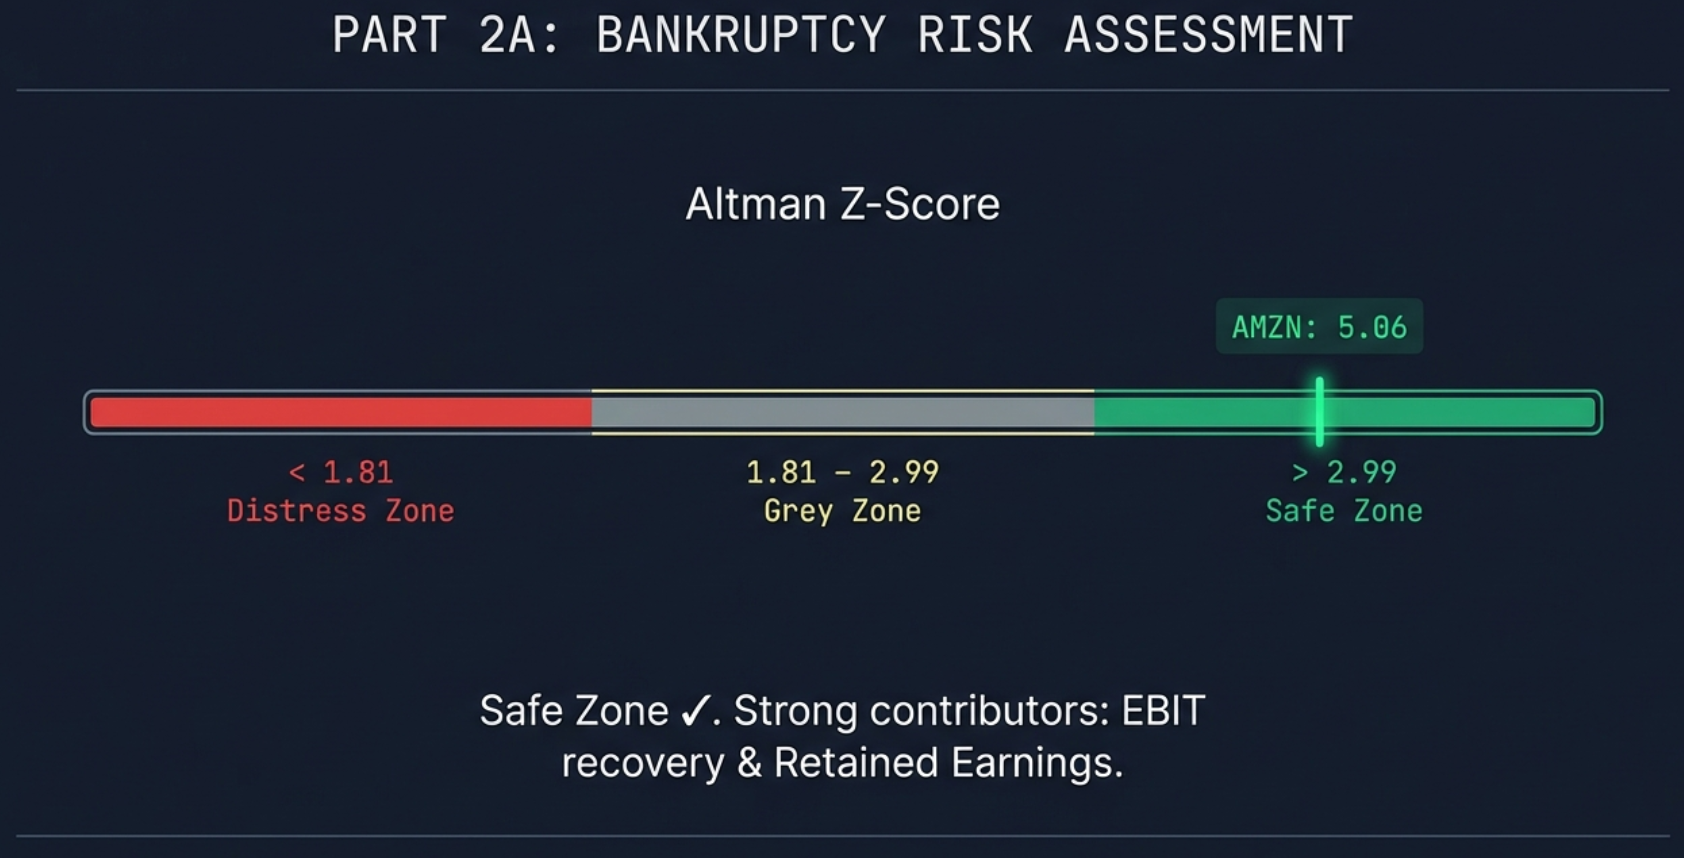
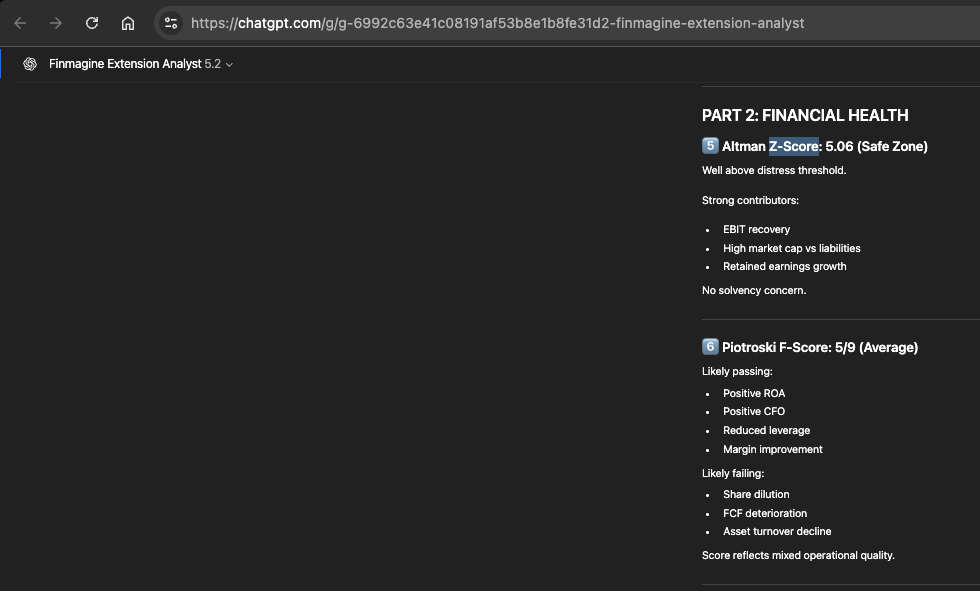
Amazon's Z-Score: 5.06 — deep in the Safe Zone. Strong contributors are EBIT recovery and the enormous equity buffer relative to total liabilities. Solvency is not the risk here.
Part 2: Piotroski F-Score — Financial Strength
The F-Score is a 9-point binary test developed by Professor Joseph Piotroski in 2000. Each of the 9 criteria either passes (1 point) or fails (0 points). The forensic value of the F-Score is that it forces the GPT to reason through which specific criteria are being passed or failed — providing a diagnostic picture of financial quality.
| Category | Criterion | Pass Condition |
|---|---|---|
| Profitability | Net Income | Positive |
| Operating Cash Flow | Positive | |
| ROA Trend | ROA improved year-over-year | |
| Cash Flow vs Income | OCF > Net Income (earnings quality) | |
| Leverage | Debt Trend | Long-term debt ratio decreased |
| Current Ratio Trend | Current ratio improved | |
| Share Dilution | No new shares issued | |
| Efficiency | Gross Margin Trend | Gross margin improved year-over-year |
| Asset Turnover Trend | Asset turnover improved year-over-year |
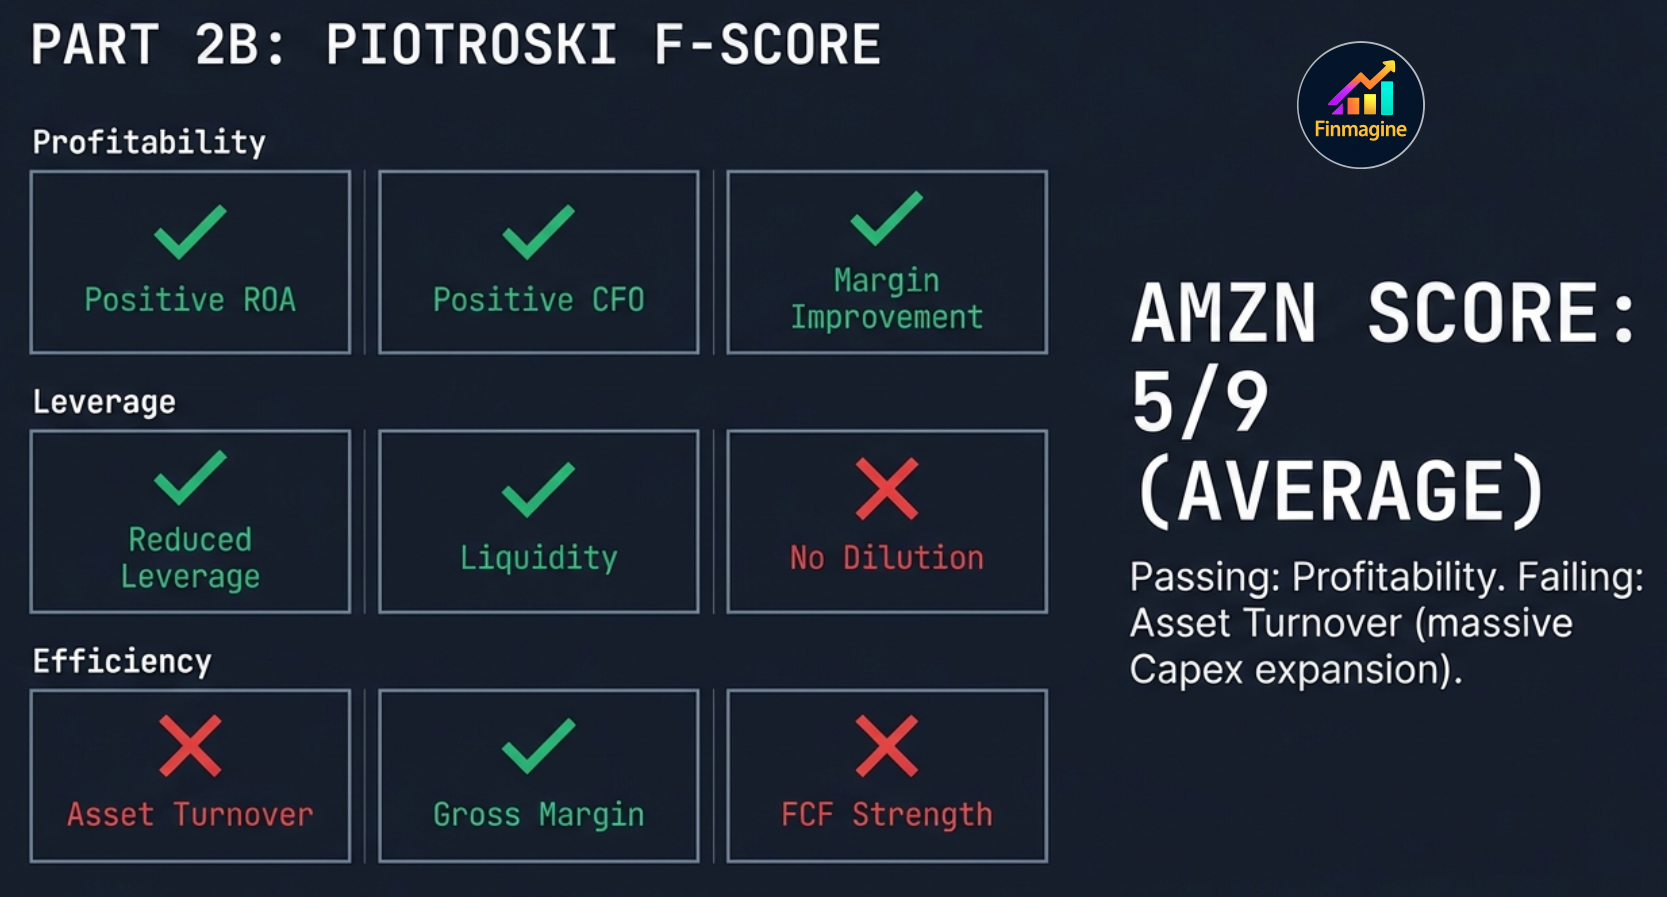
Amazon's F-Score scorecard: 5/9 (Average). Profitability criteria pass cleanly. Asset turnover and FCF strength fail — both explained by the strategic $131.8B capex surge, not operational weakness.
AMZN Forensic Analysis: Z-Score 5.06 (Safe Zone) and F-Score 5/9 (Neutral) — the F-Score reflects strategic dilution and asset turnover decline, not operational weakness
Part 3: ROIC vs WACC — Are They Creating Value?
The ROIC-WACC spread is the single most powerful metric for identifying true economic value creators. Return on Invested Capital (ROIC) tells you what the company earns on every dollar it has invested in the business. Weighted Average Cost of Capital (WACC) tells you what it costs to fund those investments. The difference is the value created — or destroyed — per dollar deployed.
| Spread | Economic Meaning | GPT Signal |
|---|---|---|
| > +15% | Exceptional value creation | Wide moat indicator; Core Compounder territory |
| +5% to +15% | Solid value creation | Healthy capital allocation; Growth Compounder |
| 0% to +5% | Marginal value creation | Adequate but not exceptional; needs context |
| Negative | Value destruction | Capital allocation concern; is this structural or transitional? |
Amazon's ROIC-WACC spread of +3.19% confirms ongoing value creation — ROIC peaked at 19% in FY24 before normalizing in FY25 due to the capex surge
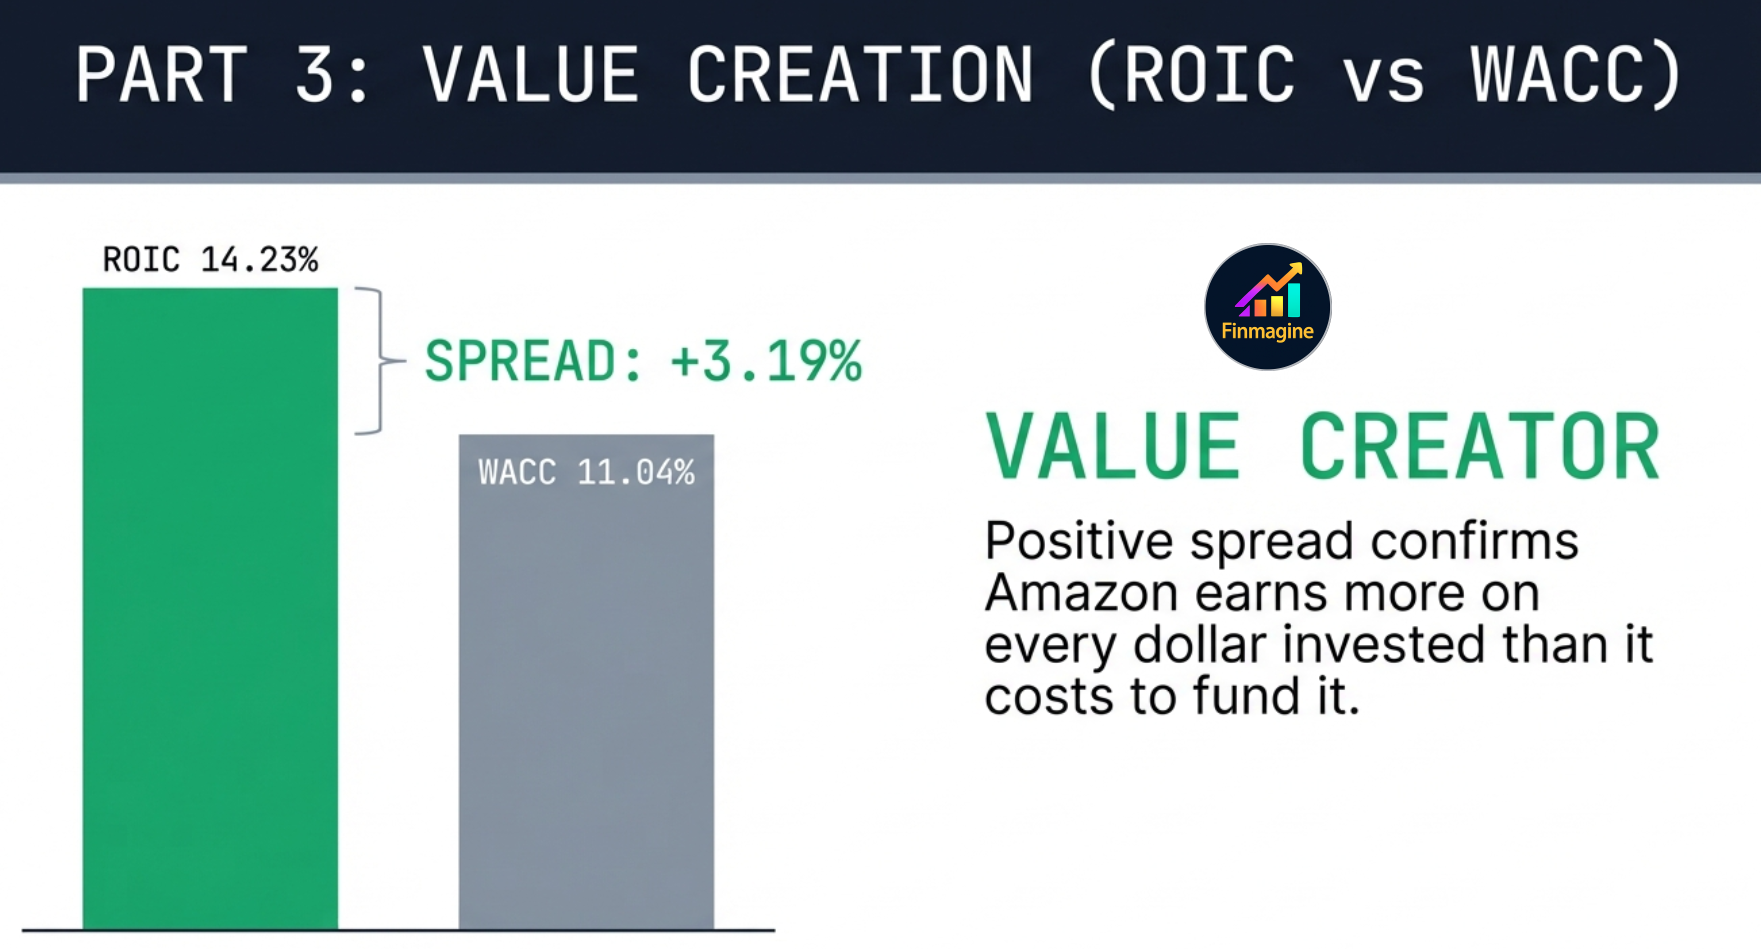
Value Creation visualised: ROIC 14.23% comfortably above WACC 11.04%. The +3.19% spread means Amazon earns more on every invested dollar than it costs to fund it — the definition of a compounder.
Part 3: Capital Allocation Assessment
The forensic investigation of capital allocation asks: is management deploying capital in ways that will compound returns, or are they destroying value through misguided expansion? Key signals include the reinvestment rate, buyback yield (share count declining = buybacks accretive), dividend payout ratio, and whether the capex pattern is consistent with ROIC expansion or compression.
Parts 4 & 5: Ownership & Analyst Consensus Forensics
Part 4: Ownership Forensics
Three ownership metrics from the Statistics page tell the GPT who is in this stock, how aligned they are with company performance, and how much bearish pressure exists in the market.
Insider Ownership
Insider ownership measures what percentage of outstanding shares is held by executives and board members. High insider ownership signals management has skin in the game — their personal wealth rises and falls with the stock. For mega-cap companies, the absolute dollar value matters more than the percentage: 1% of a $2 trillion company is $20 billion of personal exposure.
Institutional Ownership
Institutional ownership above 80% creates "crowded trade" risk: when sentiment shifts, institutions sell simultaneously and price declines can be violent. Conversely, very low institutional ownership (under 30%) on a quality company signals that professional money hasn't discovered it yet — potentially a setup for re-rating.
Short Interest
Short interest as a percentage of float represents the fraction of shares that sophisticated investors are actively betting will decline. When short interest exceeds 5%, the forensic question is: what do the bears see that the bulls are missing? This becomes a critical input for the bear case in Part 7.
Part 5: Analyst Consensus Forensics — The Three-Layer Interrogation
This is the section that most uniquely defines Forensic Analysis compared to every other template. Standard analysis asks: "What is the analyst consensus?" Forensic Analysis asks three harder questions.
Task 12: Is Sentiment Building or Eroding?
The three-month recommendation trend table is the key input. Look for movement in the distribution of Strong Buy, Buy, and Hold counts. A trend of Hold counts rising while Buy counts fall is an early warning signal — institutions are quietly becoming more cautious before any price target cut materialises. The inverse (Strong Buy counts rising) signals growing conviction in a thesis.
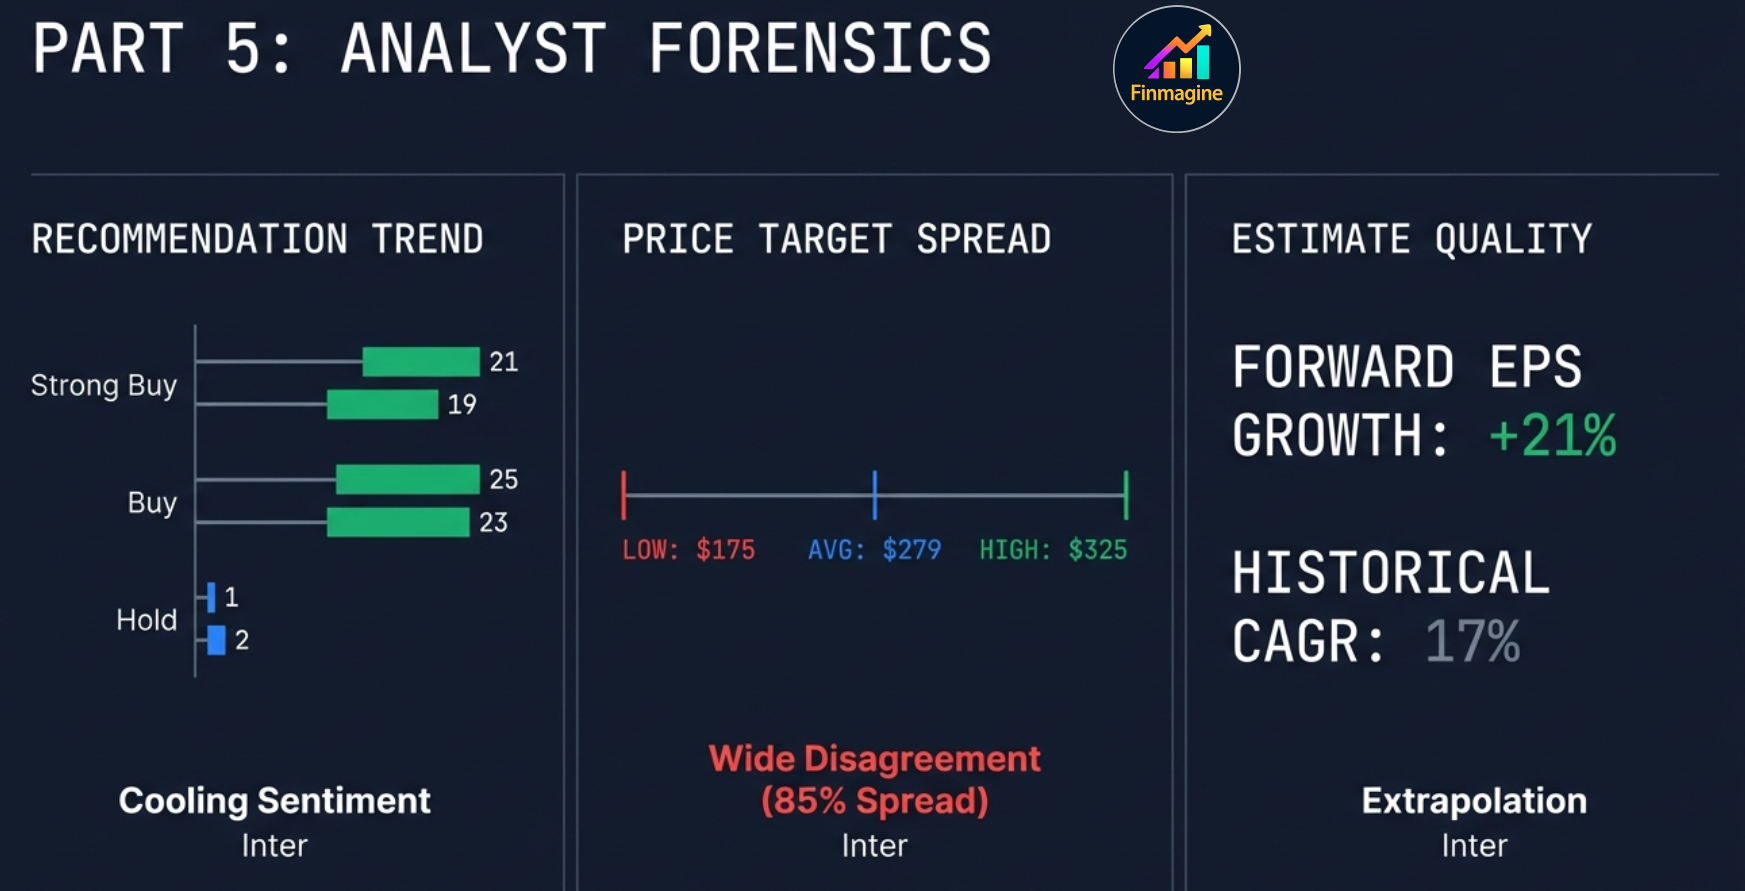
Analyst Forensics in full: cooling recommendation trend, 85% price target spread (wide disagreement), and forward EPS growth marginally above historical CAGR — extrapolation, not a step-change pricing event.
Analyst Forensics for AMZN: recommendation trend (Strong Buy 21→19, Hold 1→2) and forward estimates (EPS FY26 $8.16 +13.8%, FY27 $9.90 +21.3%) analysed for quality and conviction
Task 13: How Wide Is the Disagreement?
The price target spread — the gap between the low analyst target and the high target — is a direct measure of analyst disagreement about the company's future. A tight spread signals strong visibility. A wide spread signals either binary business risk or limited analytical coverage.
| Spread Width | Analyst Disagreement | What It Usually Means |
|---|---|---|
| < 30% | Tight consensus | High earnings visibility; predictable business |
| 30% – 60% | Moderate dispersion | Normal for cyclicals and growth companies |
| > 60% | Wide disagreement | Binary outcome risk; earnings sensitivity to key variable |
Task 14: Are Forward Estimates Credible?
This is where Forensic Analysis asks the hardest question. The GPT compares the forward EPS growth implied by analyst estimates (FY+1 and FY+2) against the company's actual historical EPS CAGR. If history shows 17% EPS CAGR and analysts are projecting 18% growth forward — they're extrapolating. If they're projecting 35% growth, they're pricing in a structural improvement that has to materialise. The GPT evaluates whether the financial data supports the step-change scenario or not. It also checks whether forward P/E multiples are expanding (market paying a premium for expected growth) or contracting (market is sceptical).
Parts 6 & 7: Valuation Forensics & Final Verdict
Part 6: Multi-Metric Valuation Triangulation
Any single valuation metric can be misleading. P/E is distorted by non-operating items. P/FCF is temporarily suppressed during capex cycles. EV/EBITDA ignores capital intensity. P/B is irrelevant for asset-light businesses. The forensic approach triangulates across six metrics simultaneously — and critically, identifies which metric tells the most honest story for this specific business and sector.
| Metric | Best For | Distorted When |
|---|---|---|
| P/E | Stable, mature earners | One-time gains/losses; heavy R&D amortization |
| Forward P/E | Growth companies with visible earnings | Estimates are overly optimistic |
| PEG Ratio | Growth-adjusted valuation | Cyclical companies with volatile EPS |
| EV/EBITDA | Capital-intensive; cyclicals; M&A valuation | Companies with large operating lease obligations |
| P/FCF | Asset-light; software; consumer platforms | Capex cycle; one-time asset sales |
| P/B | Banks; asset-heavy industrials; REITs | Intangible-asset-heavy tech companies |
Task 16: Earnings Yield vs Alternatives
The earnings yield (1 ÷ P/E ratio) expresses what the stock "returns" on an earnings basis as a percentage. Comparing it to the 10-year Treasury yield shows the equity risk premium — the extra return you're being compensated for owning an equity rather than a risk-free bond. When the equity risk premium is thin (earnings yield barely above Treasury yield), the stock has less margin of safety. This is one of the most underutilised signals in retail investing.
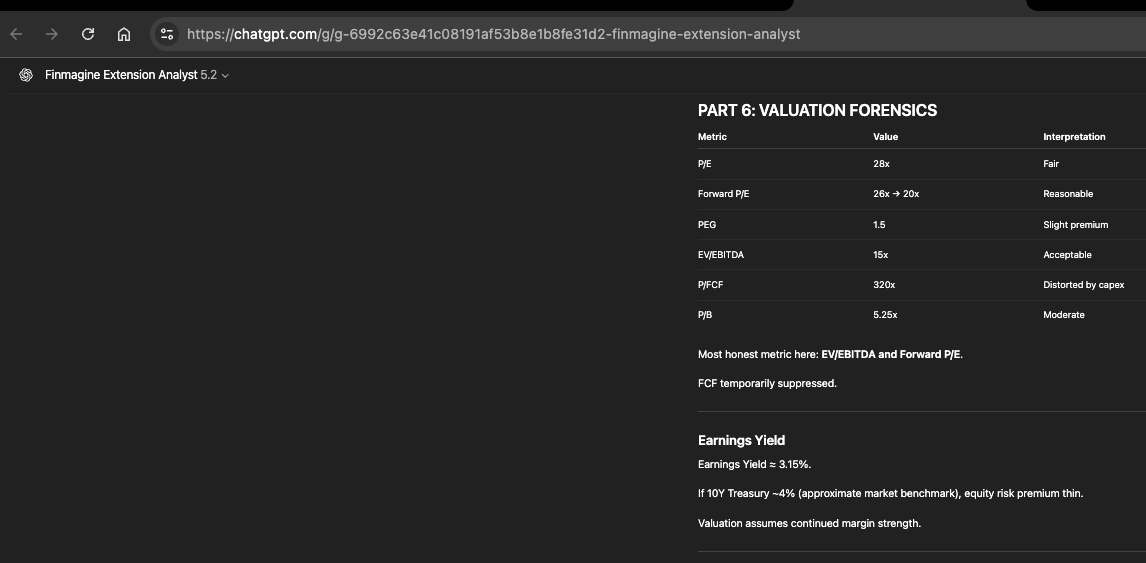
AMZN valuation triangulation: P/FCF 320x is distorted by the $131.8B capex surge. EV/EBITDA 15x and Forward P/E 20x are the most honest metrics for this stage of the investment cycle
Part 7: Final Verdict — Synthesis Into Actionable Investment Thesis
The final part of Forensic Analysis is not a summary — it is a synthesis. The GPT is instructed to convert seven parts of forensic evidence into a clear investment thesis with explicit scenarios, monitorables, and a scored recommendation.
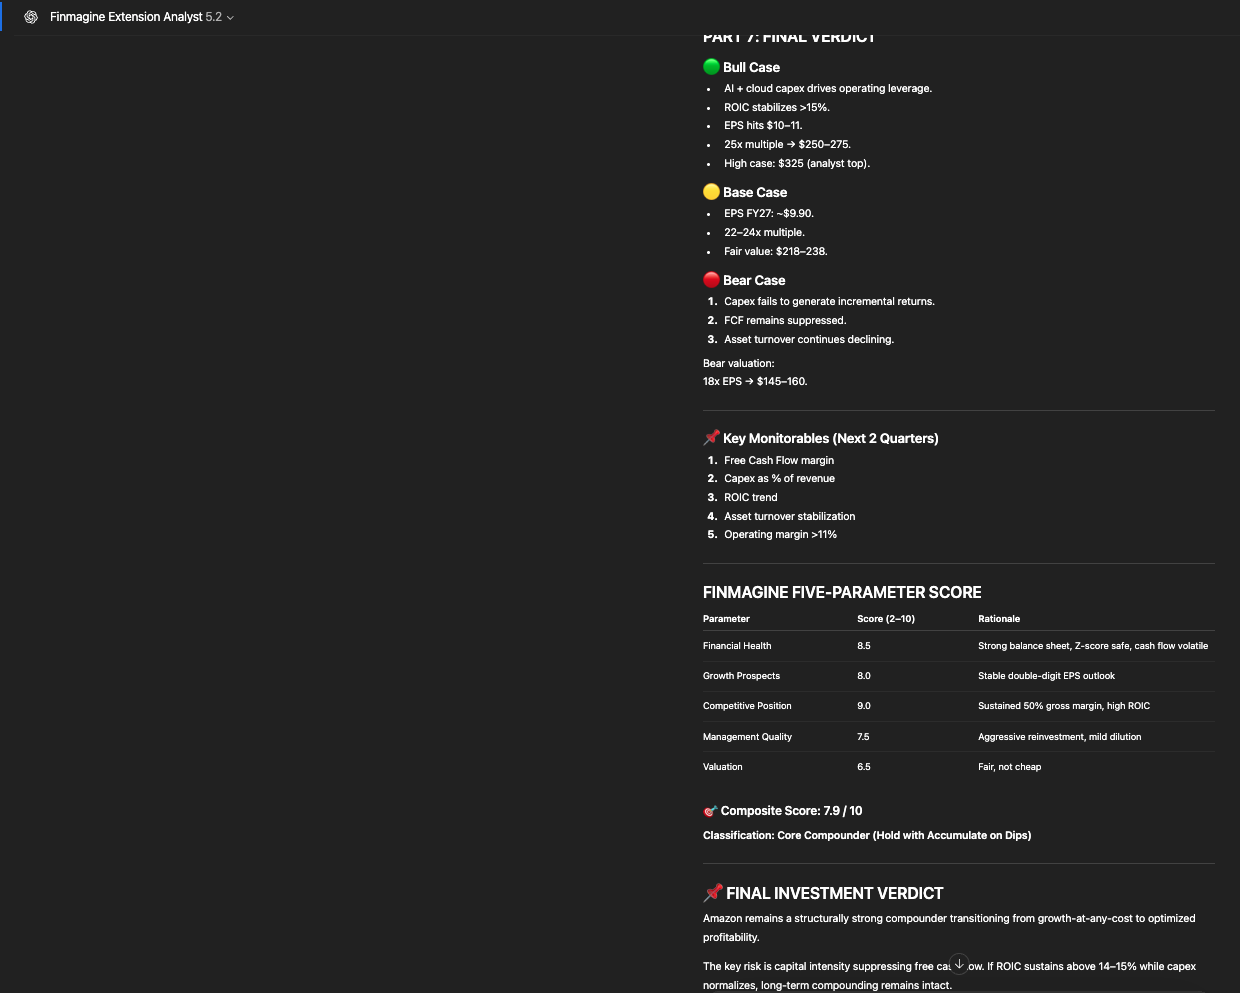
Bull / Base / Bear Scenarios
Each scenario must specify what has to go right (bull), what is the most likely outcome (base), and what the 2–3 largest risks are (bear). Estimated return ranges are included for each case. The asymmetry ratio between bull upside and bear downside is often the most actionable insight: a 3:1 ratio (40% upside vs 13% downside) is a very different setup from a 1:1 ratio.
Key Monitorables
The top 5 metrics to watch over the next 2 quarters. This section operationalises the forensic findings into a monitoring checklist — the specific data points that will confirm or disprove the base case thesis.
Finmagine Five-Parameter Score
Every Forensic Analysis concludes with the Five-Parameter scoring framework — the same methodology used across all Finmagine analysis templates. Each parameter is scored 2–10 and draws on forensic evidence rather than impressions:
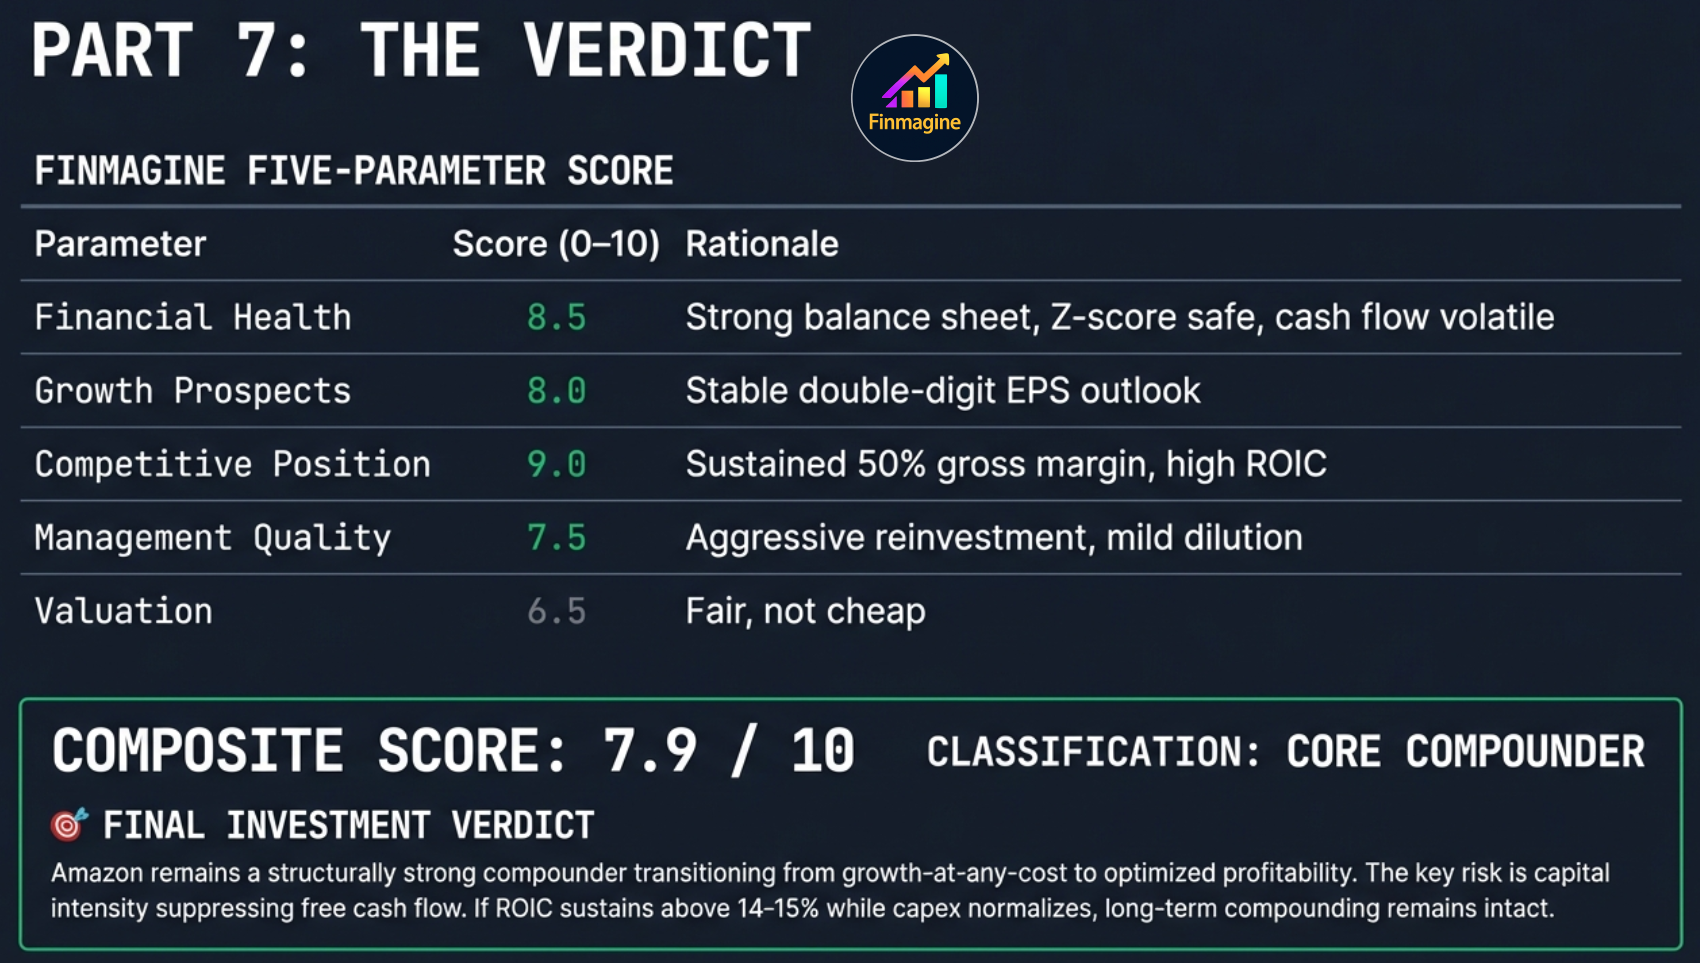
The Forensic Verdict: the Five-Parameter Score synthesises all 7 parts of forensic evidence. Amazon scores 7.9/10 — Competitive Position (9.0) is the standout; Valuation (6.5) reflects fair but not cheap pricing.
| Parameter | Weight | Primary Forensic Inputs |
|---|---|---|
| Financial Health | 25% | Z-Score zone, F-Score rating, D/E trend, interest coverage, OCF quality |
| Growth Prospects | 25% | Historical CAGR (Revenue, EPS) vs forward analyst estimates (FY+1, FY+2) |
| Competitive Position | 20% | ROIC-WACC spread, gross margin sustainability, asset turnover trends |
| Management Quality | 15% | Capital allocation efficiency, insider ownership, dilution vs buyback pattern |
| Valuation | 15% | Multi-metric triangulation, earnings yield vs risk-free rate, forward P/E trajectory |
Amazon (AMZN) — A Complete Forensic Analysis Case Study
Let's walk through a real Forensic Analysis result for Amazon.com Inc. (NASDAQ: AMZN), run in February 2026 with the stock at $201.15 and a market cap of $2.16 trillion. This is actual GPT output generated by the Finmagine Extension Analyst Custom GPT using the prompt produced by the AI Advisor.
The Opening Forensic Picture
Sector: Consumer Discretionary > Internet Retail. This immediately activates the Consumer Discretionary analysis profile from the 145 GICS industry mappings, which prioritises PE as a primary valuation metric, emphasises revenue growth consistency, and pays close attention to working capital trends.
Part 1 Highlights: Financial Forensics
Revenue & Margin Story
Revenue grew from $469.8B (FY21) to $716.9B (FY25) — a 5-year CAGR of 8.8%. The critical forensic observation isn't the CAGR — it's the margin transformation that occurred simultaneously:
| Metric | FY21 | FY22 | FY23 | FY24 | FY25 |
|---|---|---|---|---|---|
| Gross Margin | 42.0% | 43.8% | 47.0% | 48.9% | 50.3% |
| Operating Margin | 5.3% | 2.6% | 6.4% | 10.8% | 11.2% |
| Net Margin | 7.1% | -0.5% | 5.3% | 9.3% | 10.8% |
Gross margin crossing 50% in FY25 is structurally meaningful — it reflects the growing contribution of AWS and advertising (both high-margin businesses) to the overall revenue mix. Operating income jumped 6x from FY22 to FY25 while revenue grew only 25% in the same period. This is textbook operating leverage.
However, the forensic analyst doesn't stop at the headline. FY25 net income includes a $15.3 billion gain on sale of investments — a non-operating item that inflates the reported net margin. Stripping this out, the core EBIT trend is clean and credible.
The Biggest Forensic Red Flag: Free Cash Flow Collapse
This is where Forensic Analysis earns its name. While the income statement looks excellent, the cash flow statement tells a different story in FY25:
| Year | OCF | Capex | Free Cash Flow | FCF Margin |
|---|---|---|---|---|
| FY21 | $46B | $61B | -$14.7B | — |
| FY22 | $47B | $64B | -$16.9B | — |
| FY23 | $85B | $53B | +$32.2B | 5.0% |
| FY24 | $108B | $75B | +$32.9B | 5.1% |
| FY25 | $139B | $132B | +$7.7B | 1.07% |
OCF reached an all-time high of $139B in FY25. But capex surged to $131.8B — likely AI infrastructure and cloud capacity expansion — collapsing FCF margin from 5.1% to 1.07%. The forensic question: does this represent a value-destroying capex cycle, or is Amazon laying the foundation for the next phase of operating leverage? The answer determines the bull vs bear case.
Parts 2 & 3 Highlights: Health & Value Creation
- Altman Z-Score: 5.06 — Safe Zone. Strong contributors: EBIT recovery, high market cap vs liabilities, retained earnings growth. No solvency concern.
- Piotroski F-Score: 5/9 — Neutral. Likely passing: positive ROA, positive CFO, reduced leverage, margin improvement. Likely failing: share dilution, FCF deterioration, asset turnover decline. The F-Score accurately captures the mixed picture: excellent profitability metrics, but operational efficiency declining as Amazon becomes more asset-heavy.
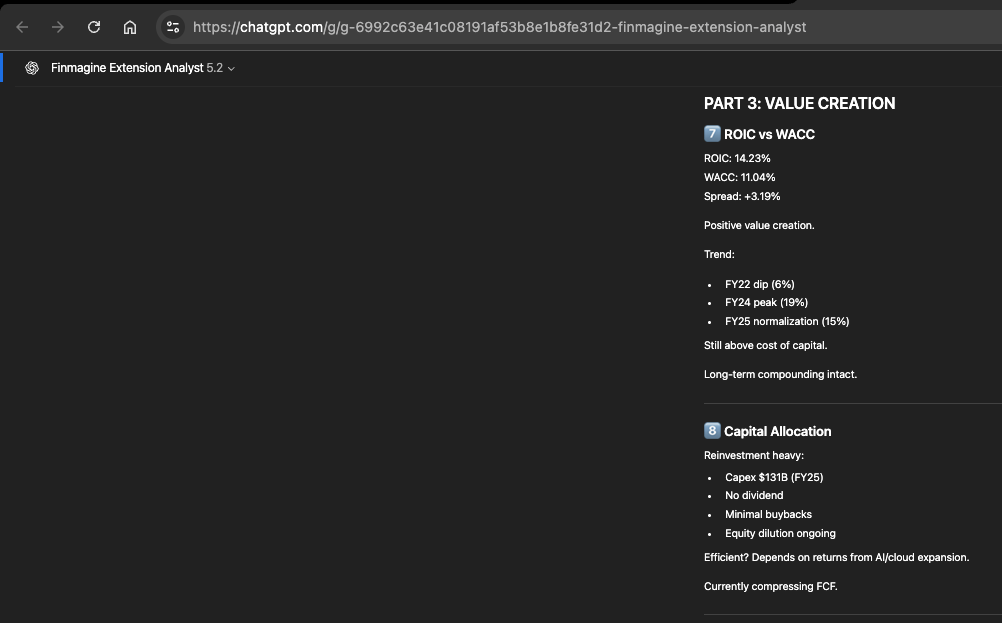
- ROIC: 14.23% | WACC: 11.04% | Spread: +3.19% — Positive value creation. The trend is more interesting: ROIC peaked at 19% in FY24 and compressed to 14.2% in FY25 as the capex surge hit the denominator before the returns materialise. If the AI/cloud investments deliver, ROIC should recover above 15% by FY27.
Part 5 Highlights: Analyst Consensus Forensics
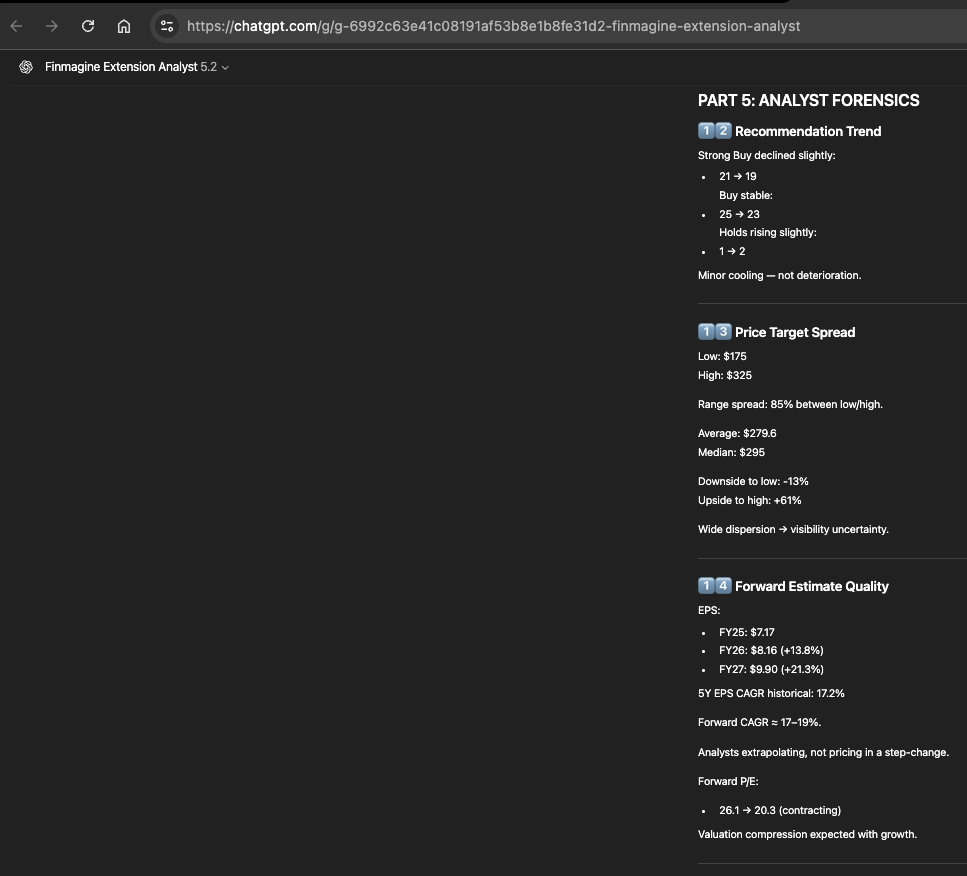
- Recommendation trend: Strong Buy declined from 21 to 19; Buy from 25 to 23; Hold rose from 1 to 2. GPT verdict: "Minor cooling — not deterioration. The slight hold increase likely reflects valuation concerns as the stock ran up, not a change in fundamental view."
- Price target spread: Low $175 / Average $279.6 / Median $295 / High $325. Gap between low and average is 37%; gap between low and high is 85%. GPT verdict: "Wide dispersion → visibility uncertainty. Analysts disagree significantly on the outcome of the AI/cloud capex cycle."
- Forward estimate quality: EPS FY26 $8.16 (+13.8%), FY27 $9.90 (+21.3%). Historical 5Y EPS CAGR: 17.2%. GPT verdict: "Analysts extrapolating, not pricing in a step-change. Forward P/E contracting from 26x to 20x. Valuation compression expected as earnings catch up."
Amazon's Finmagine Five-Parameter Score: 7.9/10 — Core Compounder classification. Competitive Position (9.0) is the standout; Valuation (6.5) reflects reasonable but not cheap pricing at $201
The Final Verdict: 7.9/10, Core Compounder
| Parameter | Score (2–10) | Key Rationale |
|---|---|---|
| Financial Health | 8.5 | Strong balance sheet, Z-Score safe; FCF volatile due to capex |
| Growth Prospects | 8.0 | Stable double-digit EPS growth; analysts credibly extrapolating 17% CAGR |
| Competitive Position | 9.0 | 50%+ gross margin, ROIC sustained above cost of capital, AWS moat |
| Management Quality | 7.5 | Aggressive but historically productive reinvestment; mild dilution ongoing |
| Valuation | 6.5 | Fair but not cheap; P/FCF temporarily distorted; EV/EBITDA 15x acceptable |
| Composite Score | 7.9 / 10 | Core Compounder — Hold with Accumulate on Dips |
Bull case ($250–$275): AI and cloud capex drives the next operating leverage cycle. ROIC stabilises above 15%. EPS hits $10–$11. Market assigns 25x multiple.
Base case ($218–$238): EPS reaches $9.90 by FY27 as per analyst consensus. 22–24x multiple. Fair value in line with current levels plus growth.
Bear case ($145–$160): Capex fails to generate incremental returns. FCF remains suppressed. Asset turnover continues declining. 18x EPS. Price compresses to bear levels.
Key monitorables: Free Cash Flow margin (recovery toward 4%+), capex as % of revenue (should normalise), ROIC trend (recover toward 17%?), asset turnover stabilisation, operating margin holding above 11%.
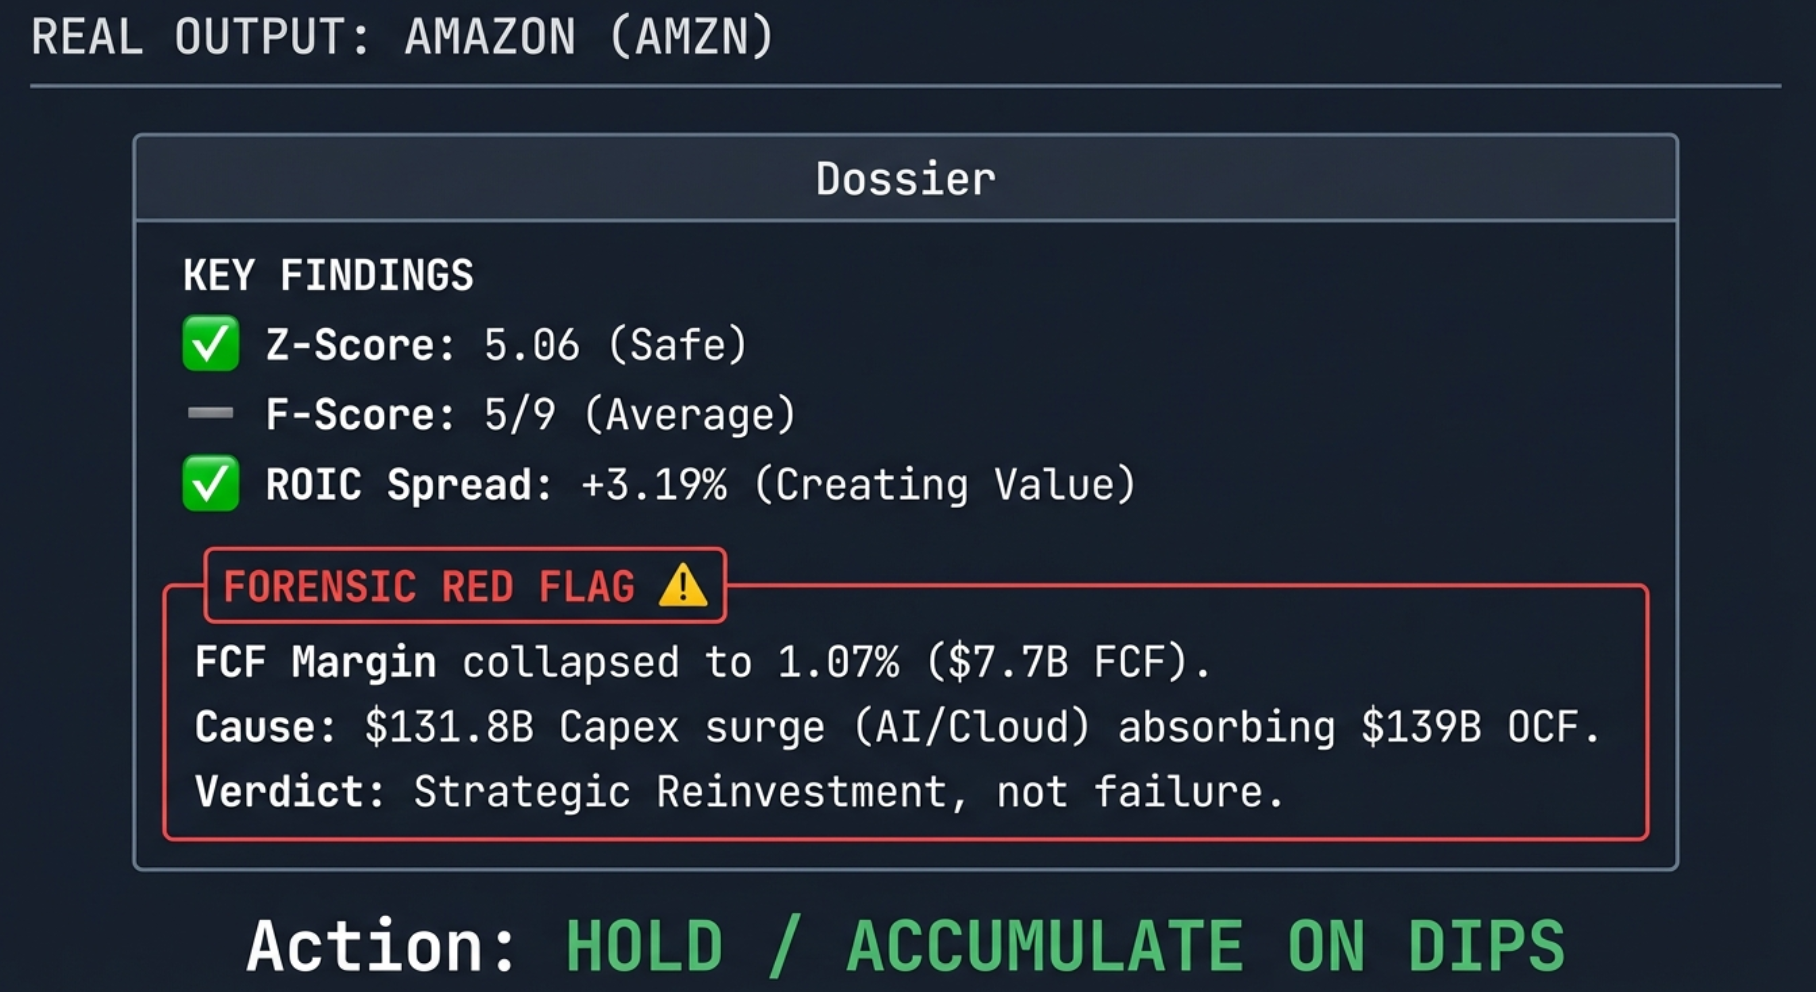
The AMZN Forensic Dossier: three green checks on Z-Score, F-Score, and ROIC-WACC — but one clear red flag. The FCF collapse is not a failure; it is Amazon's $131.8B bet on the AI infrastructure age. Verdict: Hold / Accumulate on dips.
Choosing Your Template — Forensic Analysis vs The Alternatives
The Finmagine AI Advisor offers four US templates. Each is designed for a different analytical objective. Here's how to choose:
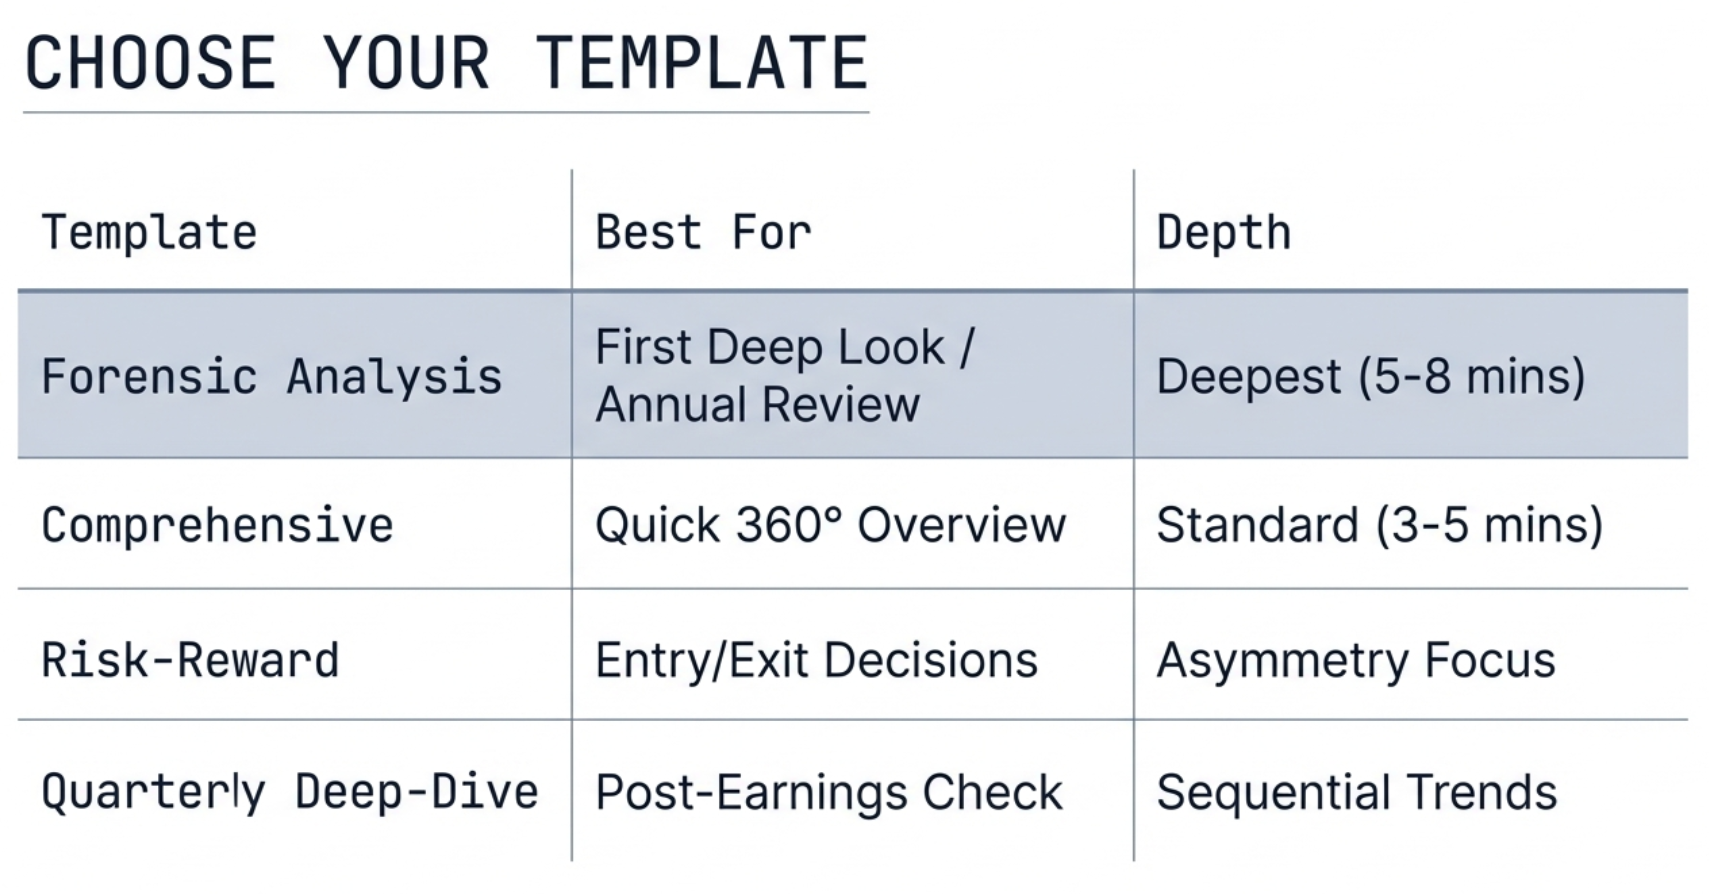
Template selector at a glance: Forensic Analysis is the deepest (5–8 min); Comprehensive is the fastest for a balanced view; Risk-Reward is optimised for entry/exit asymmetry; Quarterly tracks post-earnings sequential trends.
| Your Goal | Best Template | Why |
|---|---|---|
| First deep look at a US stock | Forensic Analysis ⬅ Featured | Exhaustive quantitative baseline across all 7 dimensions |
| Quick balanced overview | Comprehensive | Full 360° without the forensic depth; faster (3–5 min) |
| Deciding entry/exit on a position | Risk-Reward | Explicitly models upside/downside; asymmetry ratio output |
| Post-earnings monitoring | Quarterly Deep-Dive | Focused on most recent 8 quarters; sequential trend analysis |
| Annual portfolio review | Forensic Analysis | Complete reassessment of investment thesis with forward estimates |
| Checking analyst consensus quality | Forensic Analysis | Part 5 specifically dissects trend, spread, and estimate credibility |
| Evaluating a turnaround story | Risk-Reward | Bull/bear asymmetry is the key output for turnaround decisions |
| Tracking a cyclical stock | Quarterly Deep-Dive | Margin trajectory quarter-by-quarter reveals cycle position |
What Forensic Analysis Cannot Do
It is important to be clear about the boundaries of this template. Because US stocks on stockanalysis.com don't provide concall transcripts or investor presentation PDFs, Forensic Analysis cannot:
- Verify management's stated strategy against actual execution
- Analyse management communication quality or tone
- Track guidance given in concalls vs actual delivery
- Assess governance red flags from annual report disclosures
- Build a Management Integrity Scorecard (that's India's Deep Research)
The Management Quality parameter in the Five-Parameter Score is necessarily based on capital allocation patterns and insider ownership signals — proxies for management quality rather than direct evidence. This is a limitation of data availability, not of the template design.
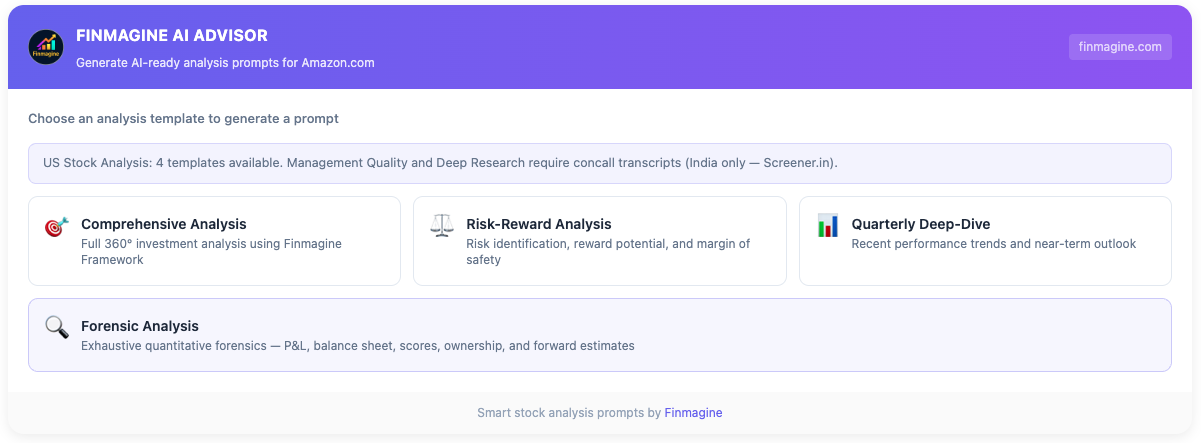
All four US templates in the AI Advisor panel: Forensic Analysis (featured), Comprehensive, Risk-Reward, and Quarterly Deep-Dive — each designed for a distinct analytical objective
Your Turn — Run Your First Forensic Investigation
Forensic Analysis exists because the best investing decisions aren't made by reading headlines or following consensus. They're made by examining evidence systematically — the same way a forensic accountant approaches a set of books. The 7-part framework doesn't just summarise what happened. It interrogates what the numbers prove, what the analysts assume, and what the valuation implies about the future.
What you now know how to do:
- Extract 11 pages of data from stockanalysis.com, including forward analyst estimates from the /forecast/ page
- Interpret Altman Z-Score and Piotroski F-Score as diagnostic tools, not binary pass/fail signals
- Use ROIC-WACC spread to distinguish true value creators from companies that look profitable but aren't earning their cost of capital
- Detect when analyst consensus is quietly cooling before price targets are cut
- Identify when P/FCF or P/E metrics are temporarily distorted and which alternative metric to trust instead
- Synthesise 7 parts of forensic evidence into a bull/base/bear thesis with the Five-Parameter Score
Install the extension: Search for "Finmagine AI Advisor" on the Chrome Web Store or visit finmagine.com for more tools and resources.
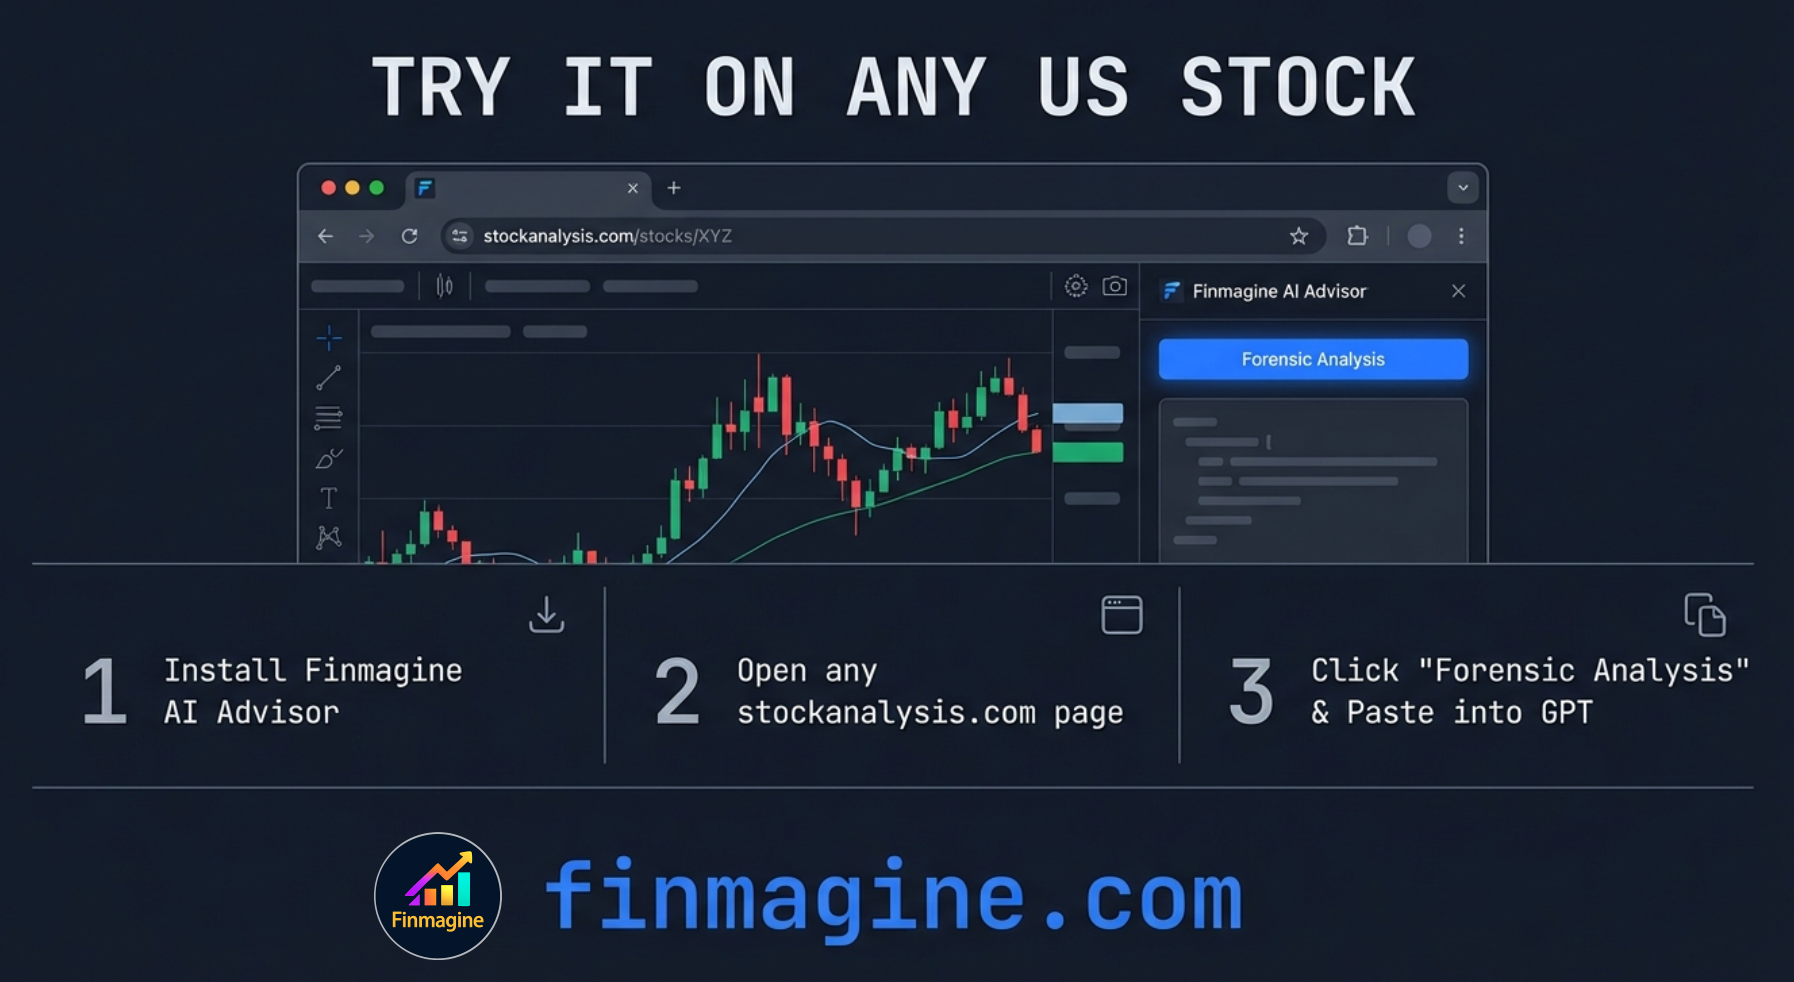
Three steps to your first forensic investigation: install → open any stockanalysis.com page → click Forensic Analysis and paste the generated prompt into Finmagine Extension Analyst GPT.
Explore the Complete AI Advisor Hub
Discover all AI Advisor resources — Forensic Analysis, all templates, sector-aware intelligence, health scoring, and everything you need to transform any stock page into institutional-grade research.
Visit AI Advisor Hub →Free Chrome Extension
Ready to try this yourself?
Install the Finmagine AI Advisor and generate institutional-grade research prompts from any Screener.in or stockanalysis.com company page in seconds.
Install from Chrome Web Store →No account required • Works on Chrome, Edge, Brave, Opera