Following along? Open the live page
Finmagine — free to explore • premium for full access • no app needed
1. What Is My Watchlist Feed?
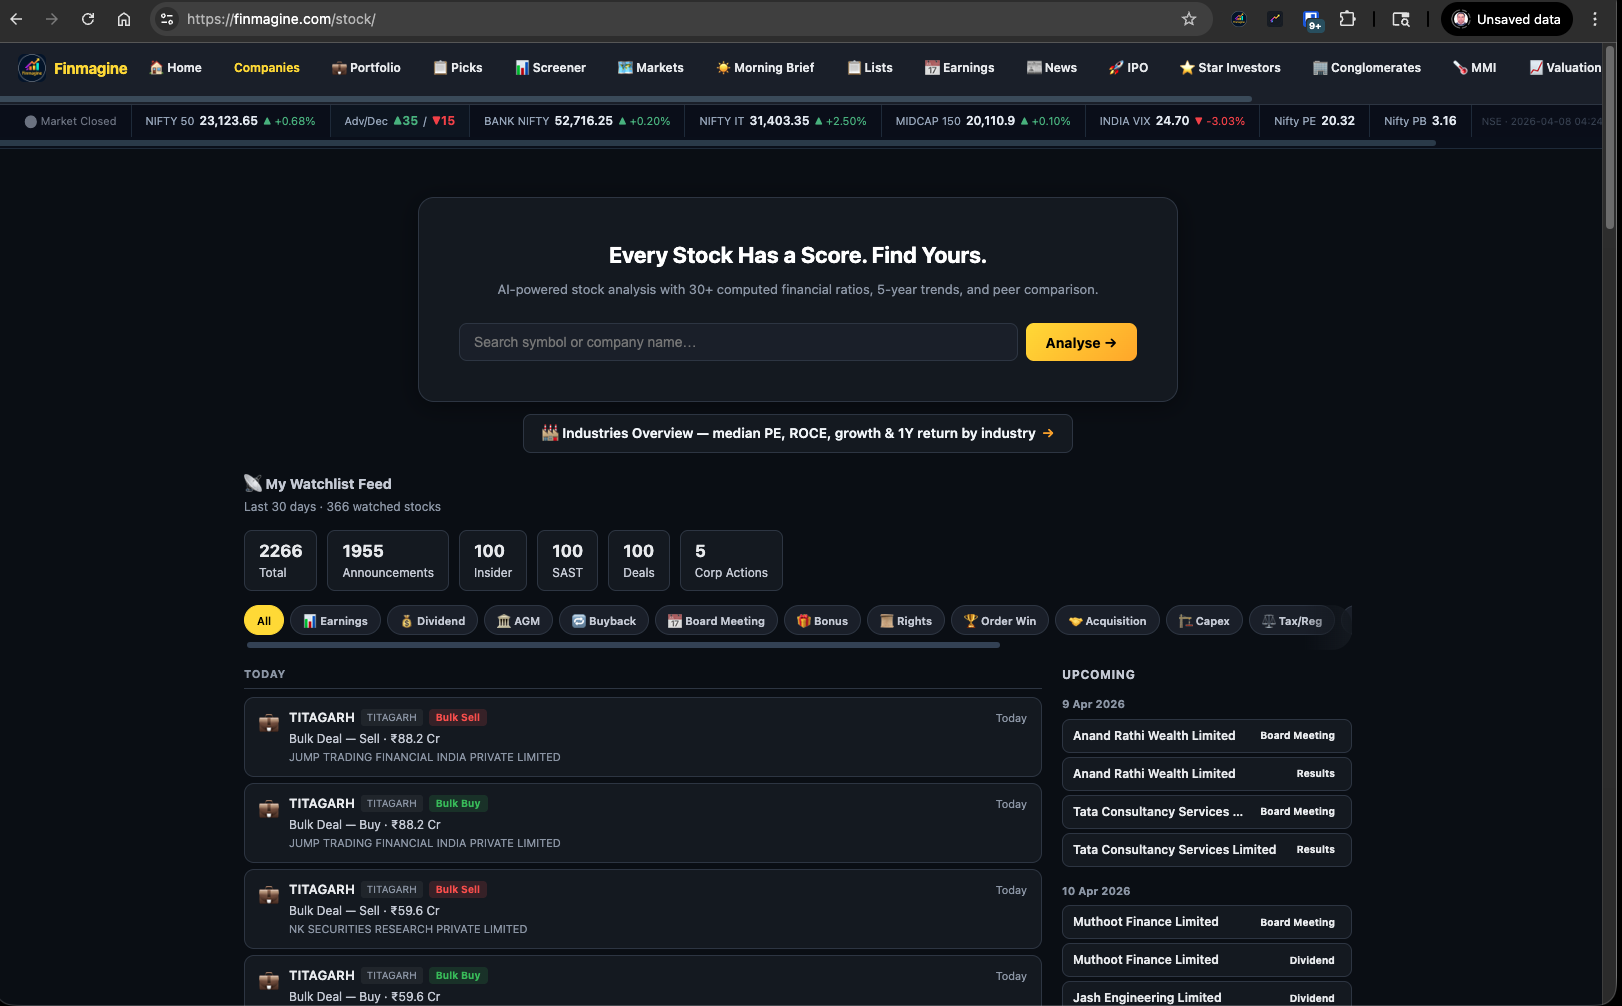
My Watchlist Feed is Finmagine's answer to a problem every investor has: how do you stay on top of material events across 20, 30, or 50 stocks without spending an hour checking each company page individually?
The feed pulls together every publicly disclosed event for all stocks in your watchlist — earnings filings, dividend announcements, board meeting outcomes, order wins, insider trades, SAST disclosures, bulk deals, and promoter pledging changes — into a single chronological stream. Events from the last 30 days are shown.
The Stats Bar
The stats bar gives you a 30-day activity summary at a glance. A watchlist that generates 2,266 events in 30 days is watching ~300 stocks. A watchlist with 50 stocks might see 200–400 events. The Insider, SAST, and Deals categories are capped at 100 each to keep the feed readable — the full history is always available on each company's Activity tab.
2. The 15 Filter Tabs — A Category Breakdown
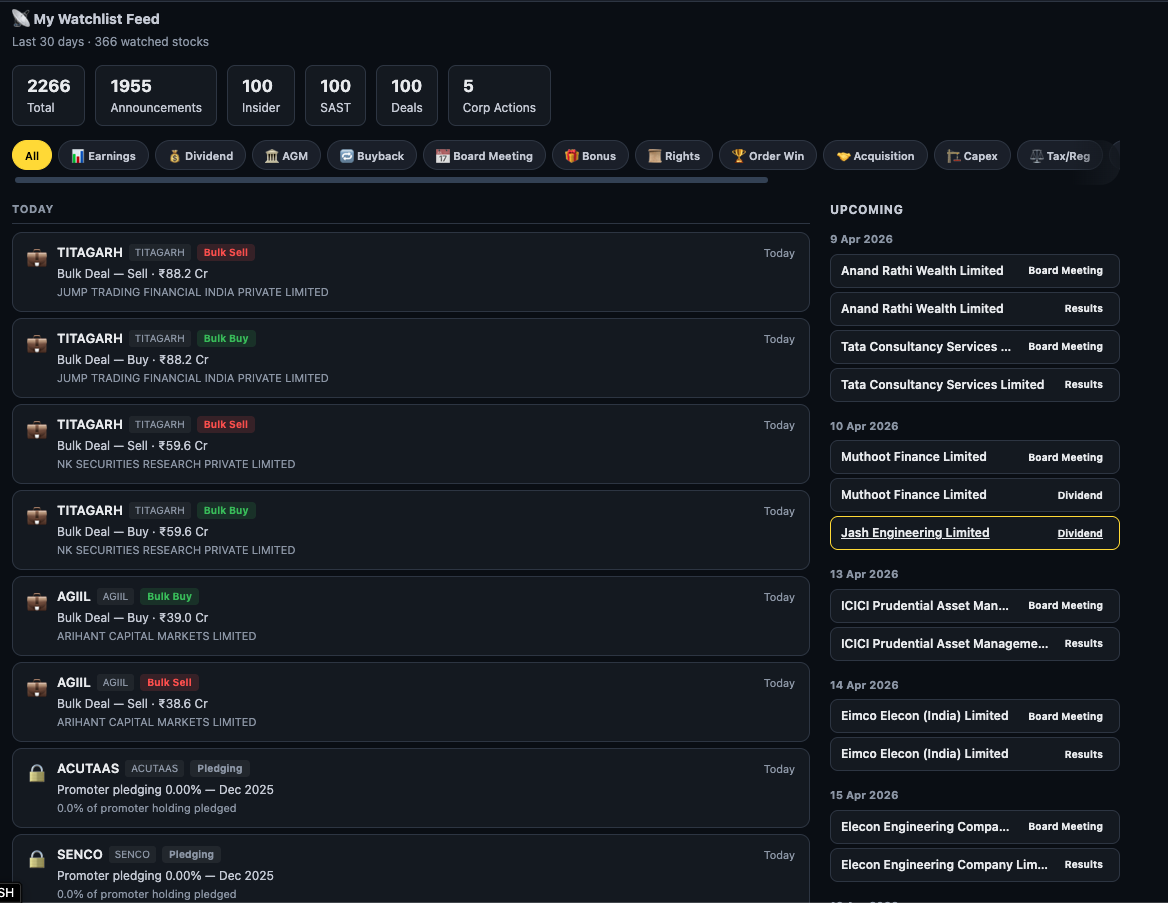
The 15 tabs fall into three logical groups. Understanding the grouping helps you know which tabs to check first depending on your purpose — are you tracking corporate actions, monitoring news flow, or watching governance signals?
- Earnings
- Dividend
- AGM
- Buyback
- Board Meeting
- Bonus
- Rights
- Order Win
- Acquisition
- Capex
- Tax / Reg
- Other
- Insider
- SAST
- Deals
- Pledging
3. Corporate Action Filters
Earnings
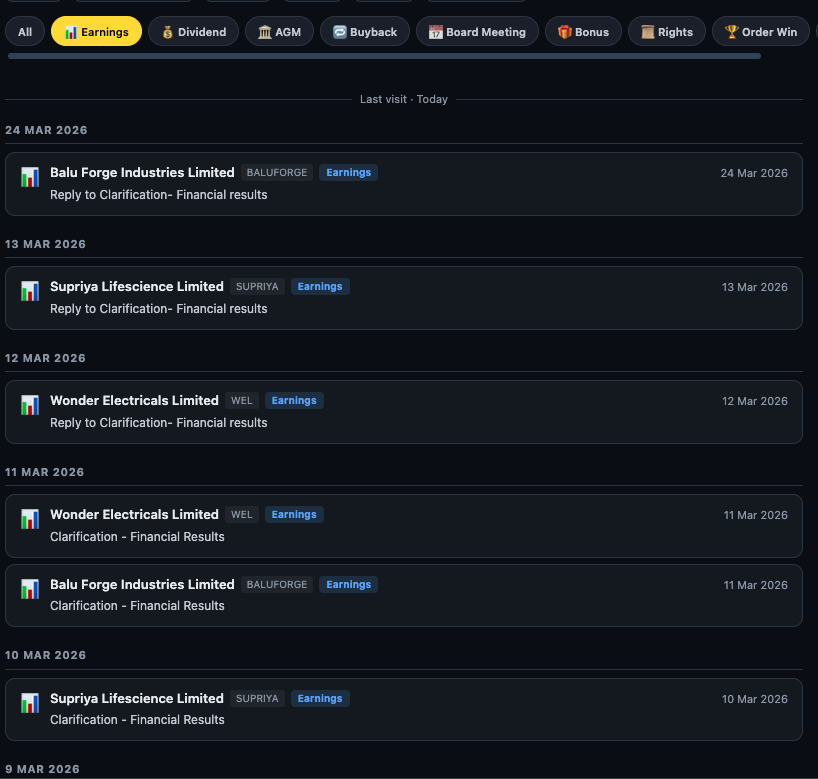
The Earnings tab shows quarterly and annual results filings from the exchange. When a company files its P&L with NSE, it appears here. Multiple entries from the same company around the same date typically indicate a clarification or revised filing after the initial submission.
Dividend
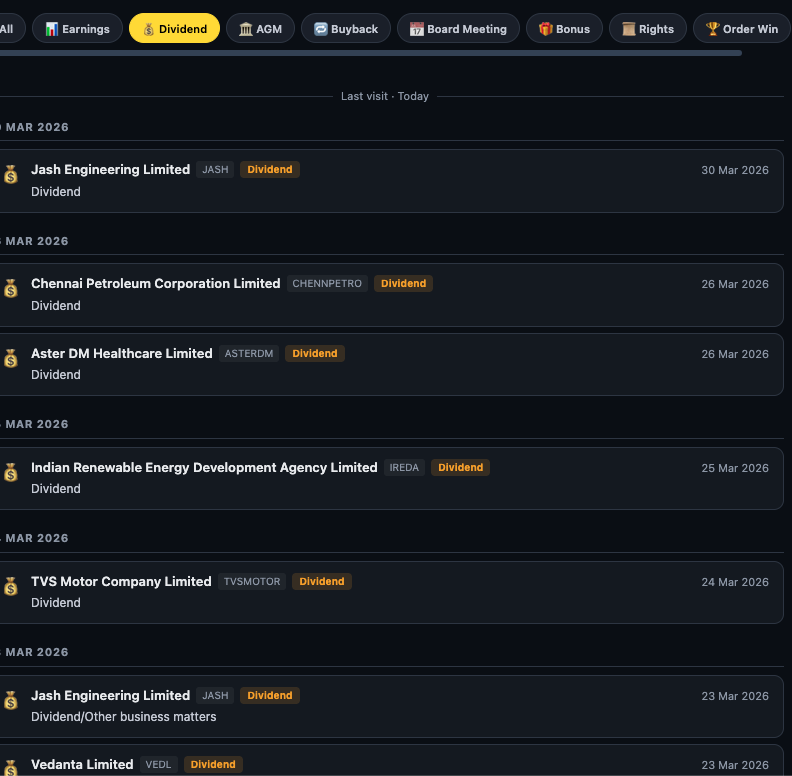
Every dividend announcement — interim or final — for your watchlist appears here. Use this tab in the week before ex-dates to confirm which stocks are paying and whether you hold them for the record date.
Buyback
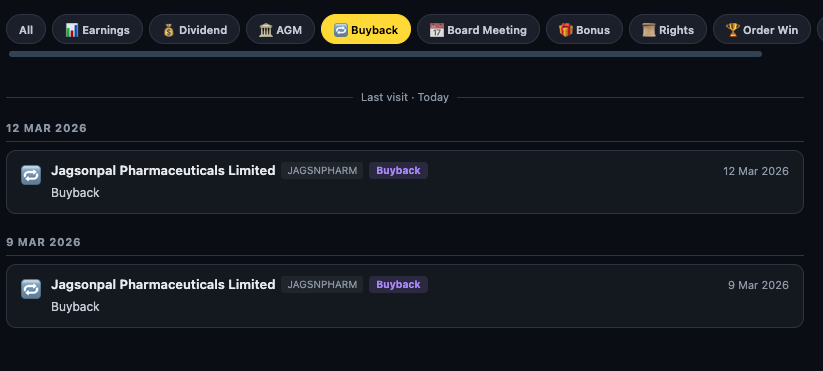
A buyback generates multiple exchange filings across its lifecycle — announcement, opening date, progress disclosures, and closure. All appear in the Buyback filter. Multiple entries from the same company within weeks of each other are normal for an active buyback programme.
Board Meeting
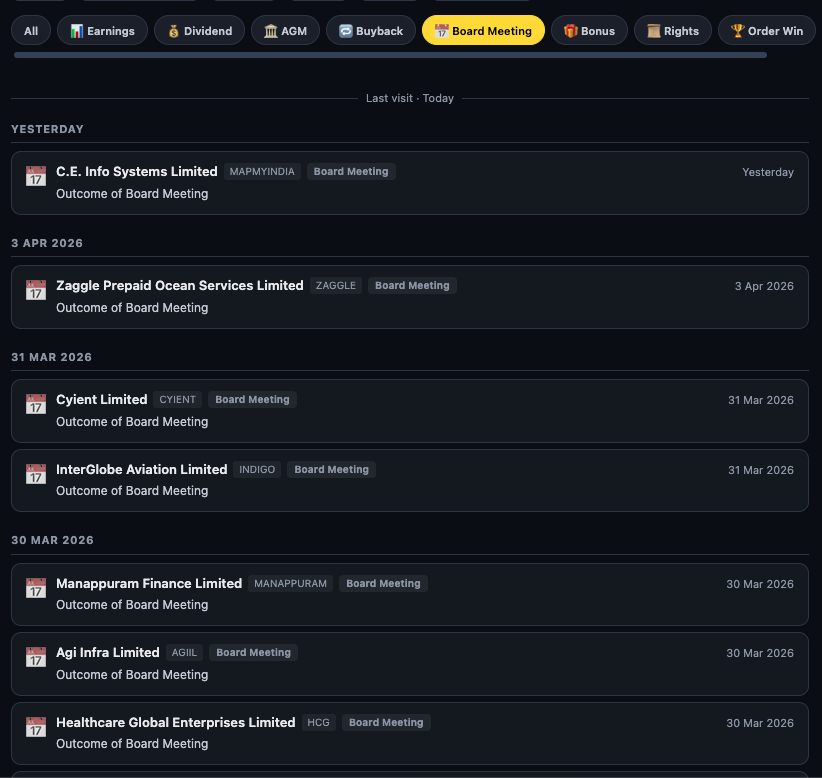
Board Meeting entries come in two flavours: advance notices (the company has scheduled a meeting) and outcomes (what the board decided). The outcome filing is the one that matters — it confirms whether a dividend was declared, results were approved, or a major corporate action was initiated.
Rights Issue
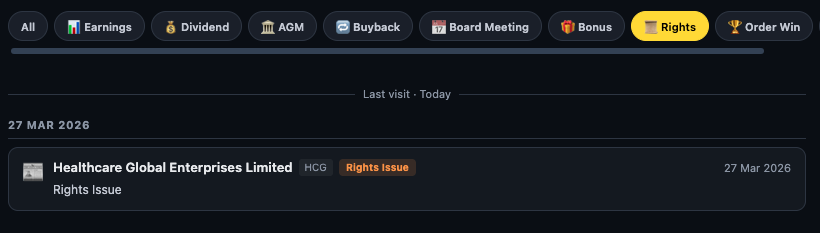
Rights issues are capital raises where the company offers new shares to existing shareholders at a discount. They require participation decisions — you subscribe, sell your rights entitlement, or let it lapse. Spotting a rights issue filing in the feed early gives you maximum time to decide.
4. Announcement Filters
Order Win
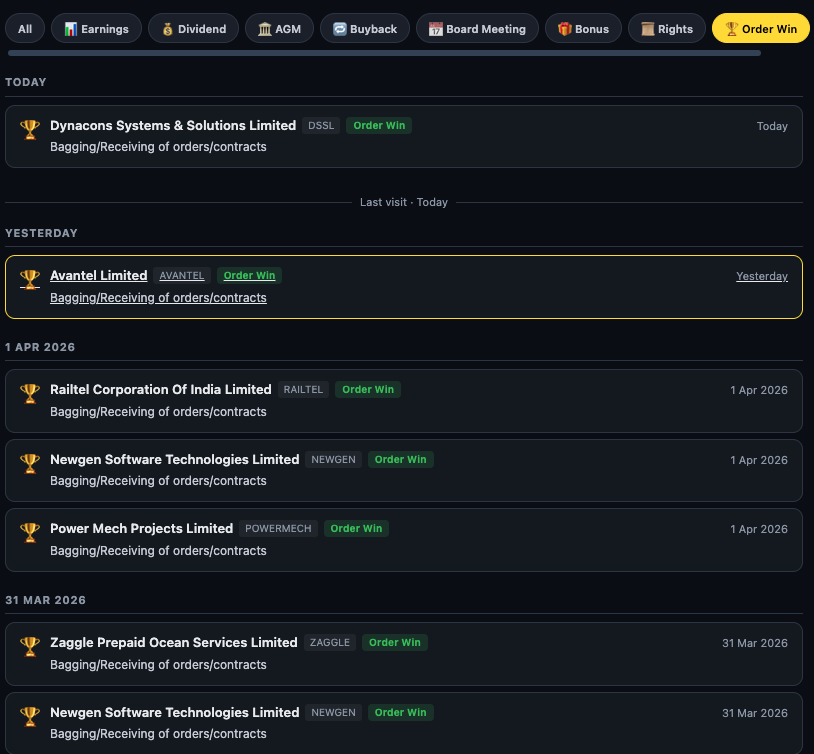
SEBI requires companies to disclose material order wins to the exchange. The threshold for "material" varies — some companies disclose every contract above ₹1Cr; others only above ₹100Cr. Over time you will learn each company's disclosure threshold and calibrate the signal accordingly.
Acquisition
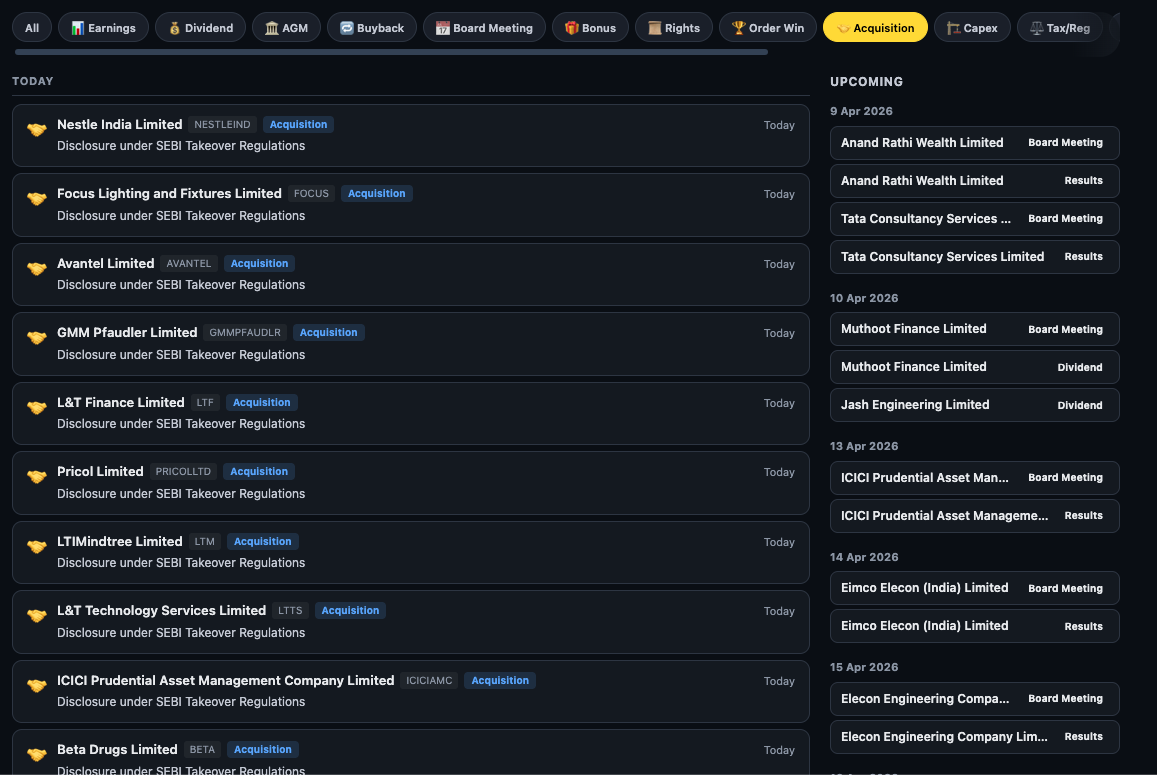
Two types of events appear under Acquisition: a company announcing it is acquiring another business, and SEBI Takeover Regulation disclosures where an entity has acquired a stake crossing a threshold. Read the sub-description to distinguish which type you are looking at.
Tax / Reg
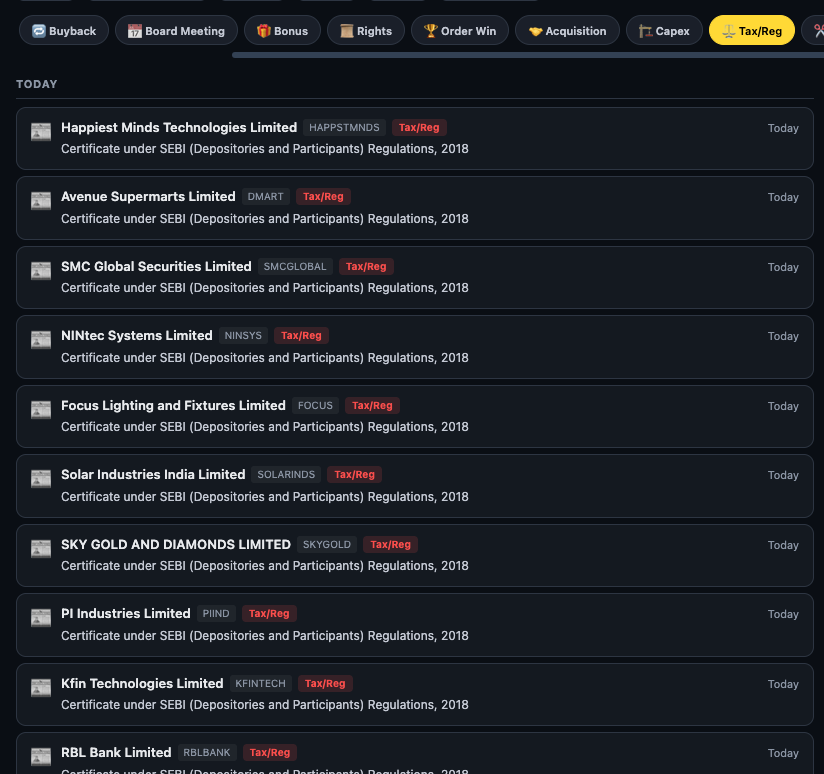
Tax/Reg is the highest-volume announcement category for most watchlists. The majority of entries are routine compliance filings under SEBI Depositories Regulations or income tax disclosures. You can usually skim this tab quickly — look for unusual spikes in activity from a single company, which can indicate a regulatory scrutiny event.
Other
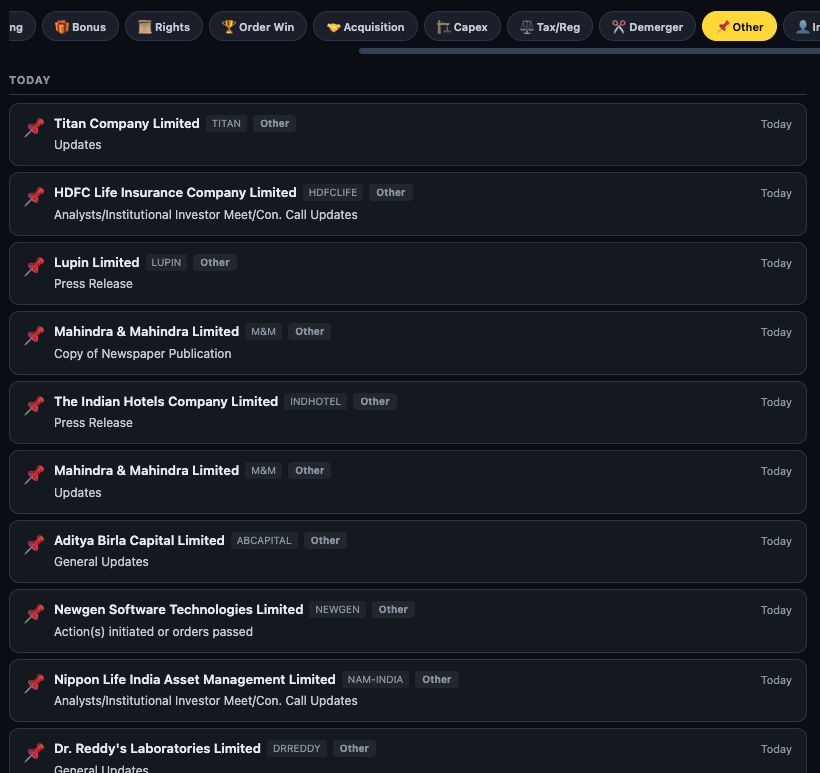
Other covers everything that does not fit the specific categories: ESOP grant notices, newspaper ad submissions, press releases, arbitration filings, and miscellaneous regulatory disclosures. It is worth a weekly scan — the Hexagon Software "Arbitration / Initiation of legal process" entry visible in the screenshot is exactly the kind of event that can get buried but matters to investors.
5. Governance Signal Filters
The four governance tabs — Insider, SAST, Deals, and Pledging — are where the most actionable signals live. These are the same data sources covered in the Governance Signals guide, but surfaced across your entire watchlist rather than one company at a time.
Insider
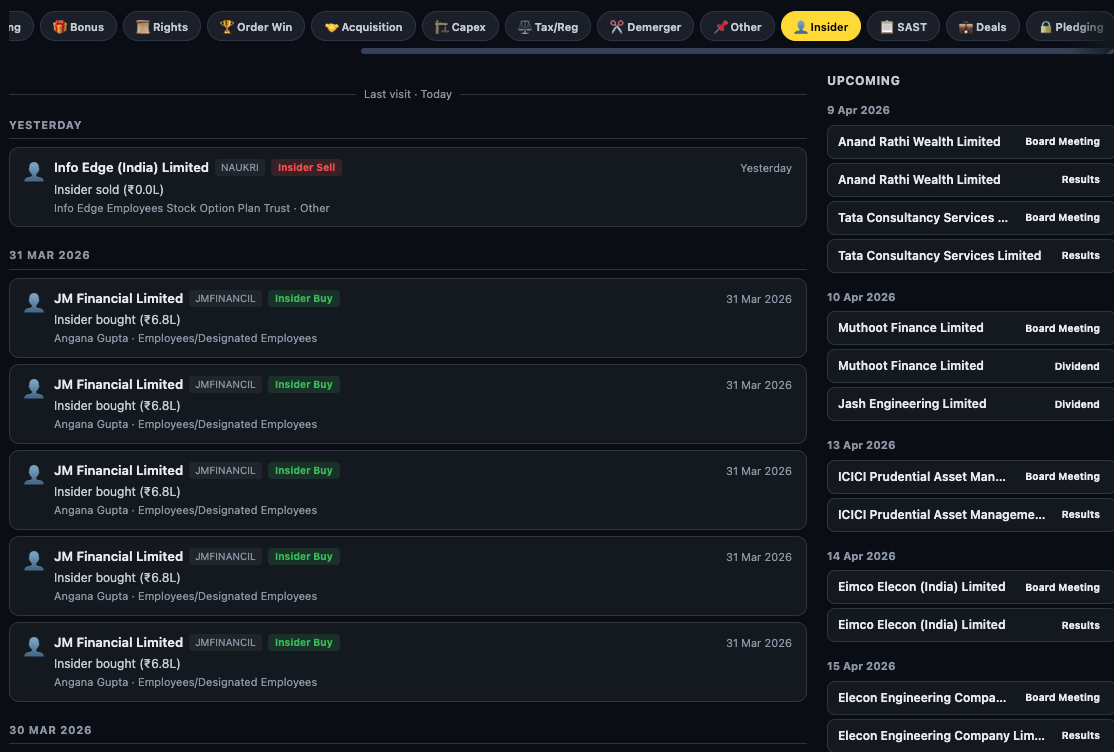
The Insider tab aggregates all SEBI PIT Regulation disclosures across your watchlist. Look for:
- Cluster buying — multiple people at the same company buying within 1–2 weeks independently
- Promoter buying — highest-signal category; promoters have full business visibility
- Size relative to company scale — a ₹5Cr insider buy in a ₹200Cr company is more significant than the same amount in a ₹50,000Cr company
SAST
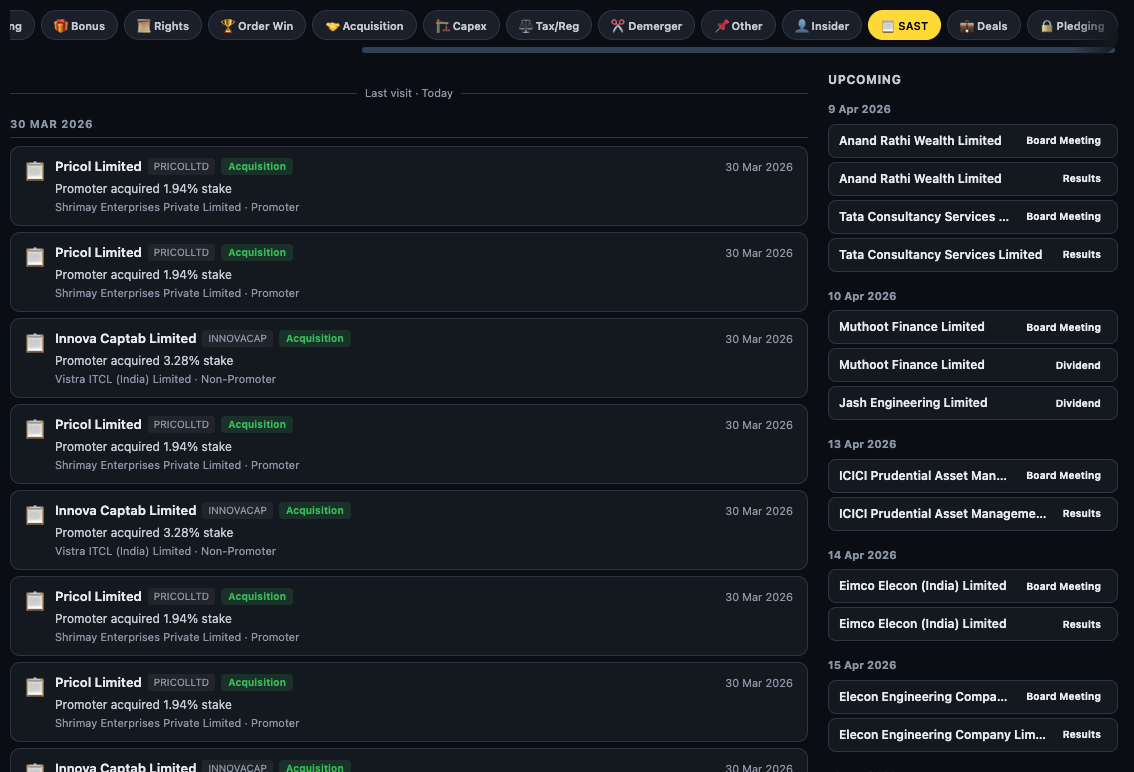
The SAST tab shows substantial acquisition and disposal filings. Multiple entries from the same company (like Pitract Limited above) indicate a promoter or institutional investor systematically building a position via creeping acquisition — buying in small tranches to stay below the open-offer threshold. This is a patient, high-conviction accumulation signal.
Deals
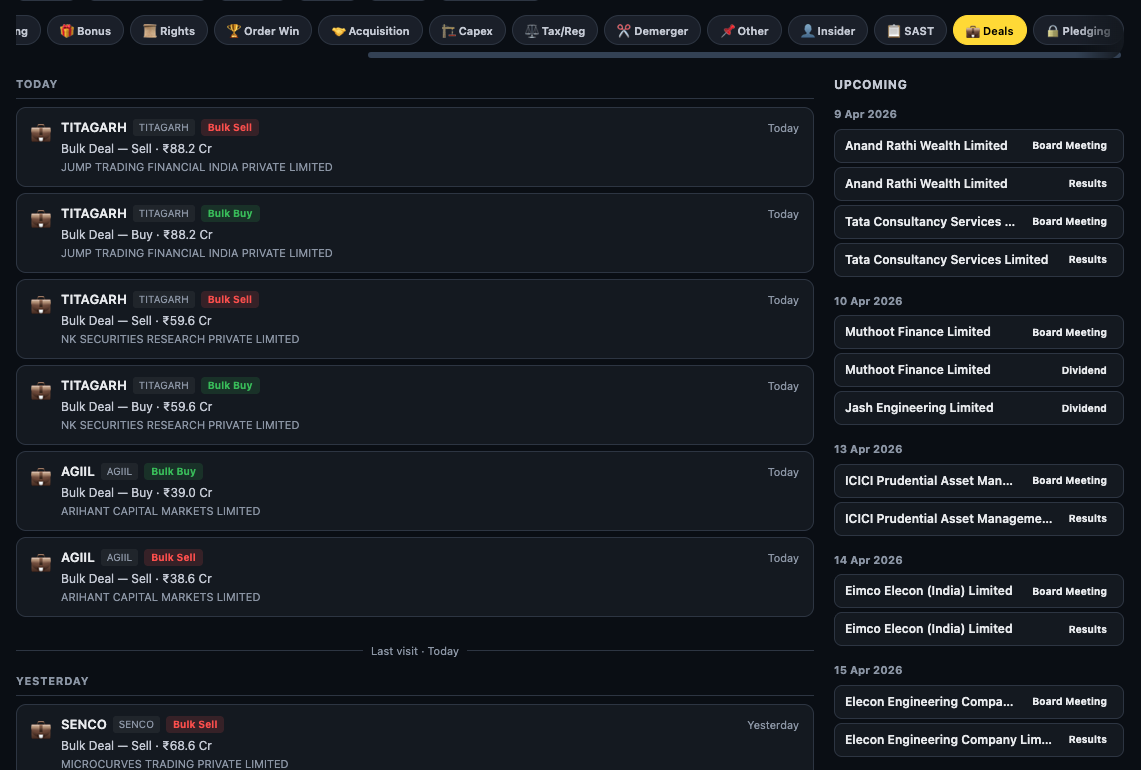
Named institutional buyers in the Deals tab carry real signal. When Marcellus Capital, a known quality-focused portfolio manager, appears as a bulk deal buyer in your watchlist, it confirms professional money found value at that price level. Conversely, when the same name appears as a seller, it warrants investigating whether their thesis has changed.
Pledging
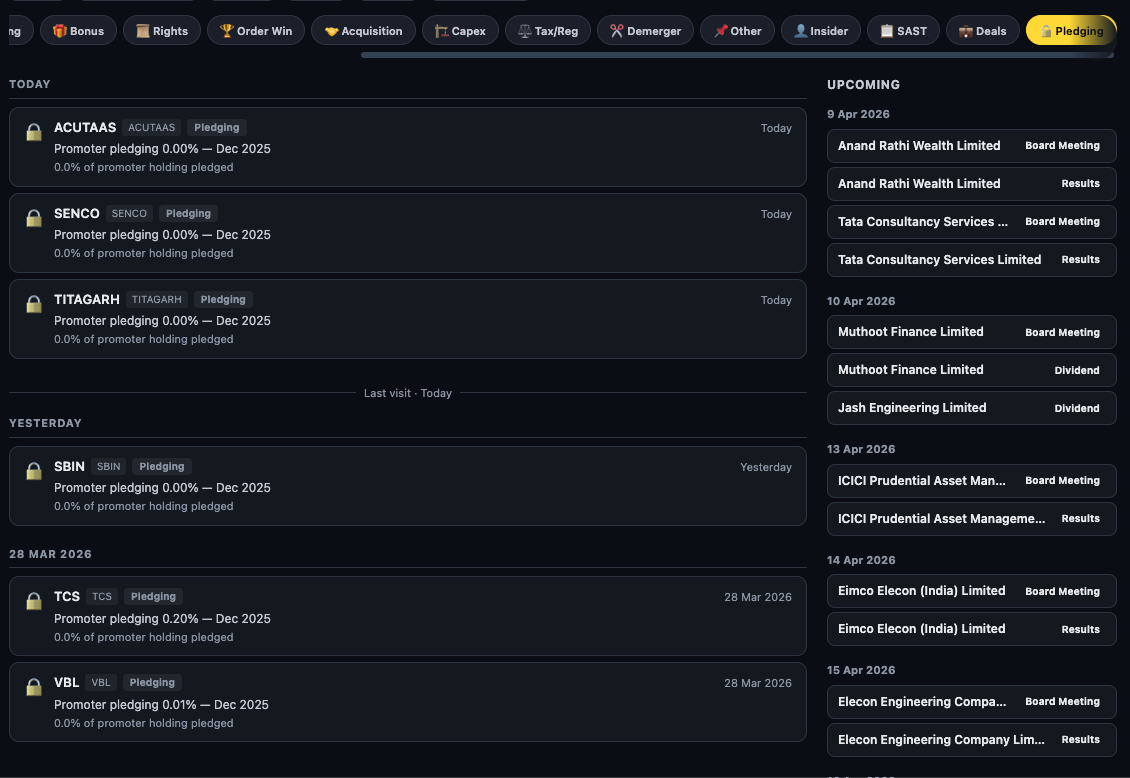
Pledging entries in the feed are quarterly disclosure events — they appear when a company files its shareholding pattern update showing a change in pledged shares. If you see a stock appear in the Pledging tab for the first time, or see it appear repeatedly with increasing percentages, open the company's Activity → Pledging tab immediately to read the full quarterly trend.
6. The "Last Visit" Marker — Your Feed Memory
The "Last visit" divider is one of the most practically useful features of the feed. It remembers when you last opened the page and draws a horizontal line at that point in the chronological stream.
Everything above the line is new since you were last here. Everything below is already seen. This means you can:
- Open the feed each morning and immediately see only today's events
- Return after a weekend and see exactly three days of events above the line
- Switch to a specific filter (e.g. Insider) and still see the last-visit marker in that filtered view
7. The Upcoming Events Sidebar
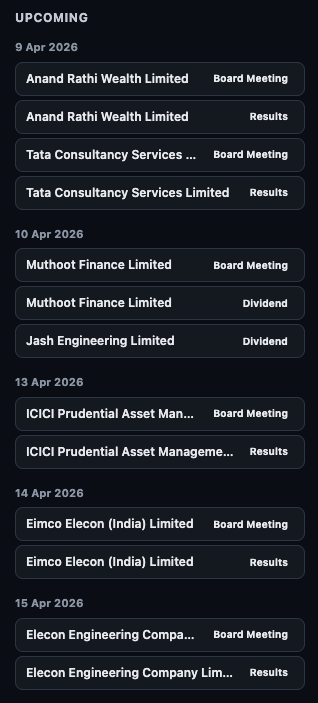
The Upcoming sidebar is a forward-looking complement to the backward-looking feed. While the main stream shows what has happened in the last 30 days, Upcoming shows what is scheduled to happen in the next 7–14 days for your watchlisted stocks.
Three event types appear: Board Meetings (when key decisions will be made), Results (when financial results will be published), and Dividends (ex-dates or payment dates). These are sourced from exchange filings where companies announce schedules in advance.
8. Building a Daily Routine Around the Feed
The full value of the feed comes from consistency — treating it as a quick daily checkpoint rather than an occasional deep dive. Here is a workflow that takes under 5 minutes:
- Open the feed. Note the total count above the Last Visit line — if it is 0, nothing new happened. If it is 30+, there is material to process.
- Scan the All view. Skim company names and event tags. You are not reading every entry — you are pattern-matching for anything unexpected.
- Switch to Insider → SAST → Deals. These three tabs are the governance pulse. New insider buying in a correction is the most actionable signal in the entire feed.
- Check Order Win and Acquisition for companies in your watchlist that are in growth mode — these feed into revenue visibility.
- Glance at Upcoming before you close. Note which companies are reporting results or holding board meetings this week. That is your prep list.
Ready to Analyse Indian Stocks Like a Pro?
Finmagine gives you 30+ computed financial ratios, sector benchmarks, FII/DII flows, the Finmagine Score, and AI-powered analysis — all in one place.