Following along? Open the live page
Finmagine — free to explore • premium for full access • no app needed
1. Why Governance Signals Need a Different Framework
The other Activity sub-tabs — Returns, Delivery, Deals, Holdings, Dividends — tell you what is happening around a stock in the market. The three governance sub-tabs answer a fundamentally different question: what are the people who control the company doing with their own shares?
Promoters, directors, and senior management have access to information you do not. Their trading and pledging decisions are not random. They are legally required to disclose these actions — which means you can observe them. This guide teaches you how to read those signals without misinterpreting routine activity as red flags, or missing genuine warnings.
2. Pledging — The Promoter's Leverage Exposure
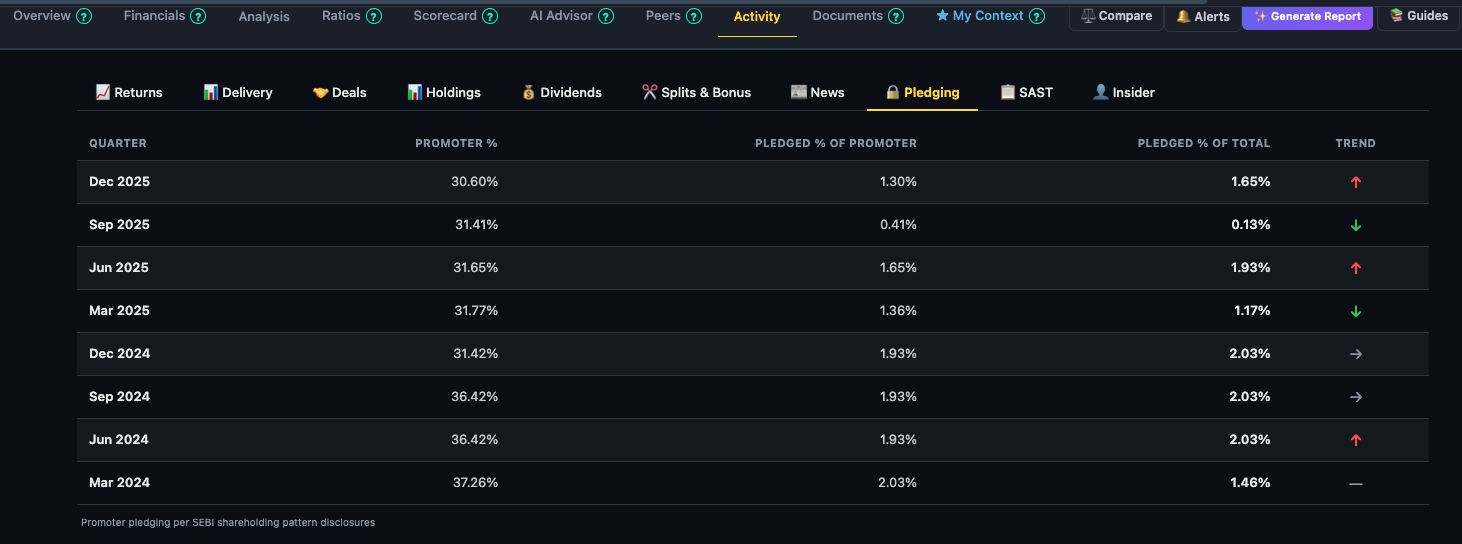
Understanding the Three Columns
- Promoter % — the total promoter + promoter group shareholding that quarter. This is your base. A promoter with 50% stake who pledges 10% of their holding has pledged 5% of total company shares.
- Pledged % of Promoter Holdings — what fraction of the promoter's own shares are pledged. A promoter with 51% stake pledging 5% of their holding has pledged 2.55% of total. High % of promoter holdings pledged = high personal leverage.
- Pledged % of Total Shares — the most market-relevant number. This is what % of the entire company's equity is encumbered. Always anchor on this column.
Reading the Quarterly Trend
The Pledging tab shows data for the last 8 quarters — roughly two years — so you can spot the direction, not just the level. A reading of 3% pledged of total is very different if:
- It was 8% two years ago and is declining → promoter reducing leverage, positive
- It was 0% two years ago and is rising → promoter taking on new debt secured against company shares, investigate why
The trend arrows in the final column capture quarter-on-quarter direction, but always read the full 8-quarter arc.
Risk Levels
| Pledged % of Total Shares | Risk Level | What to do |
|---|---|---|
| 0–5% | Low | No action needed. Note the trend direction for completeness. |
| 5–15% | Moderate — Monitor | Check whether it is rising or falling. Read annual report for borrowing context. Not a sell trigger alone. |
| 15–25% | High — Investigate | Understand why pledging is this high. Check promoter's other business ventures. Stress-test what a 30–40% stock price fall would trigger. |
| 25%+ | Critical Risk | Margin call spiral risk is real. Ensure conviction is exceptionally high before holding. Many high-pledge stocks have seen forced promoter selling that accelerated declines. |
3. SAST — Substantial Acquisition & Stake Change Disclosures
What Triggers a SAST Disclosure
SEBI's Substantial Acquisition of Shares and Takeovers Regulations, 2011 require mandatory public disclosure whenever:
- Any entity acquires or disposes of ≥2% of shares or voting rights in a financial year
- Any holder crosses specific thresholds: 5%, 10%, 15%, 20%, or 25% of total shares
- Any holder already above 25% acquires or disposes of shares
The disclosure must happen within 2 working days of the triggering transaction. This makes SAST one of the most timely regulatory disclosures available.
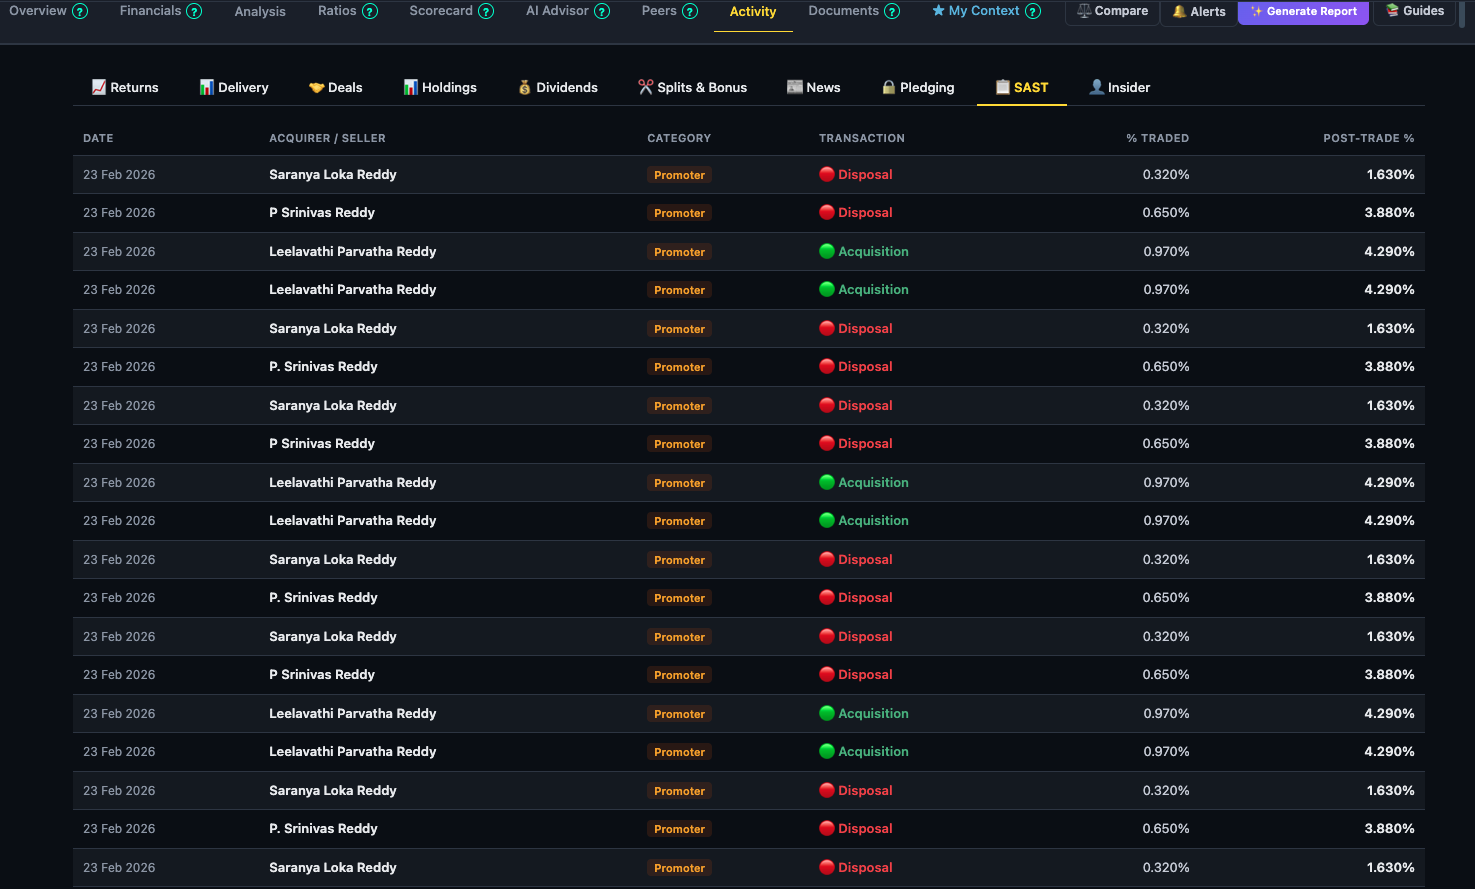
Reading the SAST Table
Each row in the table shows:
- Acquirer Name — the entity making the disclosure. Multiple rows from the same person mean they crossed the threshold via several trades.
- Category badge — Promoter means a controlling group member is involved. FII/Institutional means a large investor is crossing a threshold.
- Transaction badge — Acquisition is buying; Disposal is selling.
- % Traded — the fraction of company equity this transaction represents.
- Post-Trade % — the acquirer's total holding after this transaction. This is the key number — track it across rows to see net movement.
The Two Patterns Worth Tracking
- Promoter Post-Trade % rising over consecutive filings
- Promoter creeping acquisition (buying ~1–5% per year steadily)
- Promoter buying back shares after a price correction
- Large institutional acquirer crossing a new threshold upward
- Promoter Post-Trade % declining in consecutive filings
- Large promoter disposal at a fixed price (block deal exit)
- PE/VC firm crossing a threshold downward (exit in progress)
- Multiple promoter entities all selling within a short window
4. Insider Trading — Designated Person & Promoter Group Transactions
Who Must Disclose Under SEBI PIT Regulations 2015
Every trade by a "designated person" must be disclosed within 2 trading days. The company's board decides who qualifies, but the minimum includes:
- All Directors and KMPs (Key Managerial Personnel)
- CFO, Company Secretary, Head of IR
- Anyone whose role gives them access to quarterly results before announcement
- All promoter group entities and individuals
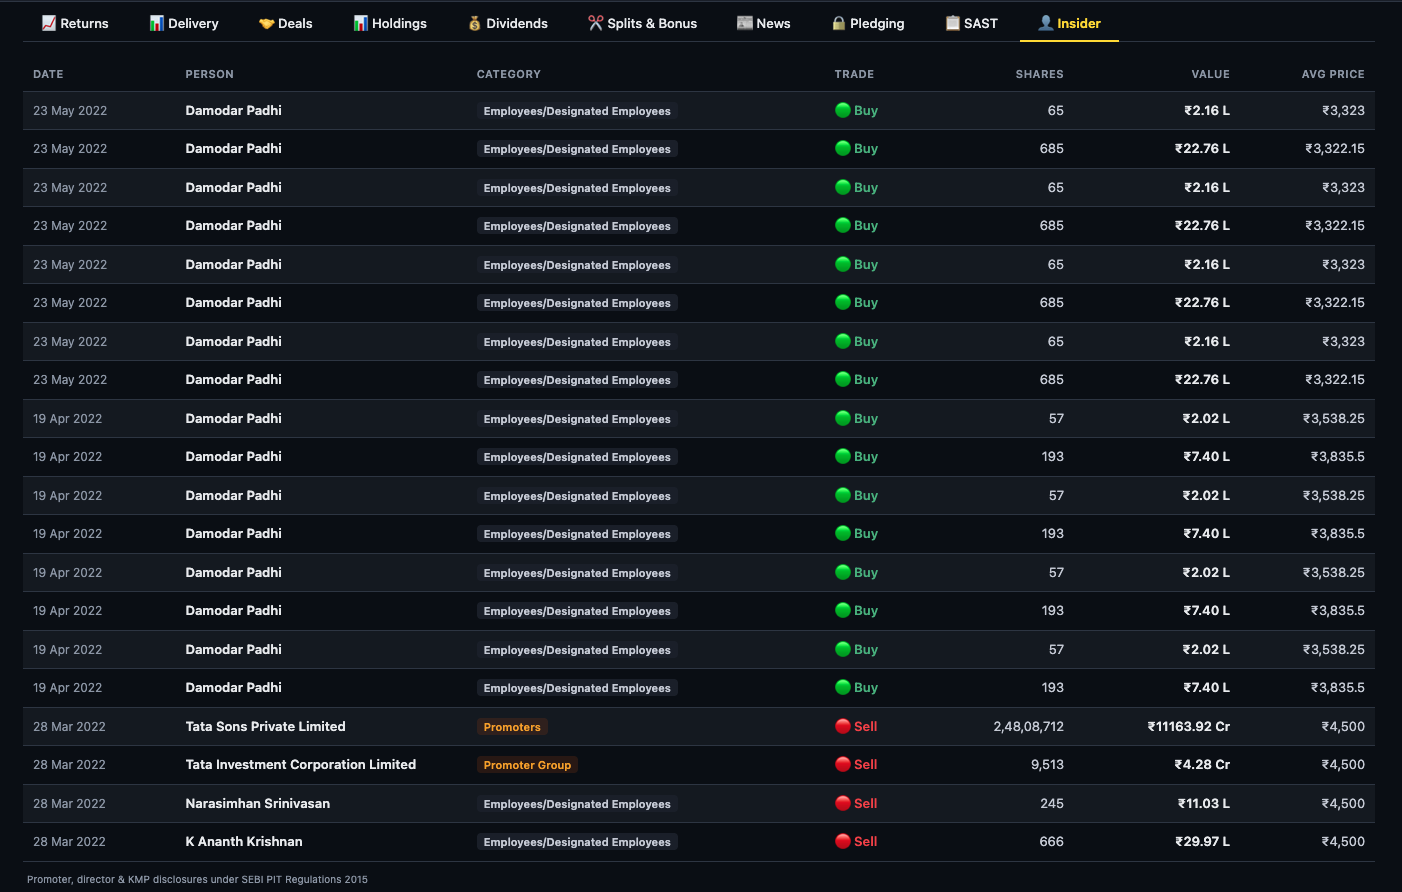
Finmagine displays each disclosure as a row with the person's name, their category, the trade direction, number of shares, value, and average price.
Reading the Signal Correctly
The most common mistake when reading the Insider tab is treating all sell entries as negative signals. They are not. You need to distinguish between:
- Promoter group open-market Buy transactions — their money, their conviction
- Multiple directors buying independently within 1–2 weeks
- Insider buying near 52-week lows or after a sharp correction
- Large-value purchases relative to the insider's known compensation
- Large promoter group Sell at market price (not block deal)
- Multiple promoter entities all selling within a short window
- CFO or CEO selling a large % of their holding after a strong rally
- Selling volume that exceeds what ESOP exercise alone would explain
Routine Activity to Discount
The same logic applies to small routine sales by employees — ₹2–10L transactions by middle management are typically personal financial needs. Focus your analytical attention on:
- Transaction size — ₹1Cr+ transactions from senior insiders carry signal. ₹5L from a junior employee does not.
- Category — Promoter group buys/sells >> Director buys/sells >> Employee buys/sells in terms of signal strength.
- Cluster timing — Multiple insiders trading in the same direction within 2–3 weeks of each other. When that happens without a lock-up expiry or ESOP vest date explaining it, something is being communicated.
The Promoter Block Sale Case
The screenshot shows a notable example: Tata Sons selling ₹11,163.92 Cr of TCS at ₹4,500. This is a promoter block sale — Tata Sons, which holds ~72% of TCS, periodically monetises part of its stake. These sales happen at a negotiated discount to the market price and are bought by institutions in the block deal window.
In isolation, a promoter block sale looks alarming. In context — Tata Sons needs capital to fund group-level obligations and has been a serial block seller in TCS for years — it is corporate treasury management, not a view on TCS's business. Always layer in context.
5. Putting All Three Together — A Governance Scorecard
The three governance sub-tabs are most powerful when read together. Here is a quick mental model:
| Signal Combination | Interpretation |
|---|---|
| Pledging declining + SAST shows acquisition + Insider shows buy | Promoter is strengthening control and reducing leverage simultaneously. Very bullish governance posture. |
| Pledging stable <5% + No SAST activity + Insider shows routine ESOP sales | Neutral. Normal lifecycle for a well-governed company. No governance flags. |
| Pledging rising + SAST shows disposal + Insider shows promoter selling | All three governance signals point in the same direction. Promoter is reducing exposure while increasing leverage — major red flag requiring deep investigation. |
| Pledging high but stable + No SAST + Insider shows directors buying | Mixed. Pledging concern exists, but directors buying suggests they see value despite leverage. Needs individual context. |
Ready to Analyse Indian Stocks Like a Pro?
Finmagine gives you 30+ computed financial ratios, sector benchmarks, FII/DII flows, the Finmagine Score, and AI-powered analysis — all in one place.