📋 Contents
- The Problem Worth Solving
- Workflows, Not a Feature List
- Stock Intelligence & Valuation
- AI & Data Automation
- Scanners & Momentum
- Market Sentiment & Macro
- Ratings & Valuation
- Portfolio, Risk & Planning
- 🇺🇸 US Markets
- 🤖 Agentic Research & Developer Platform
- Chrome Extensions
- Education & NISM XV
- Why This Is Different
- What Finmagine Is Not
- Free Starting Points
- Test Your Knowledge
- What Users Say
- Free vs Premium
Read This If…
- You invest long term and want a repeatable research process, not one-off spreadsheets.
- You swing trade and need a market → sector → stock sequence, not a single indicator.
- You use AI for research but want it to know the company already — and let you choose the provider.
- You build agents or scripts and need structured, documented market data, not scraped pages.
Prefer to watch? A 4-minute walkthrough of the framework below — market regime, sector strength, stock selection, and valuation.
🎧 Inside Finmagine 2026 — Audio Commentary
A conversational deep dive into the full platform framework, start to finish
• Bottom-up fundamentals: Scorecard Pro's five weighted dimensions, Reverse DCF, and the Forward Financial Model.
• Top-down macro: the Market Mood Index's six factors and how the Sector Rotation Graph tracks capital rotation.
• AI with guardrails: Bring Your Own Key, the Intelligence Block, and the Investment Committee's multi-agent debate.
• Taking it to the browser: the four Chrome extensions, and closing thoughts on discipline over data.
The Problem Worth Solving
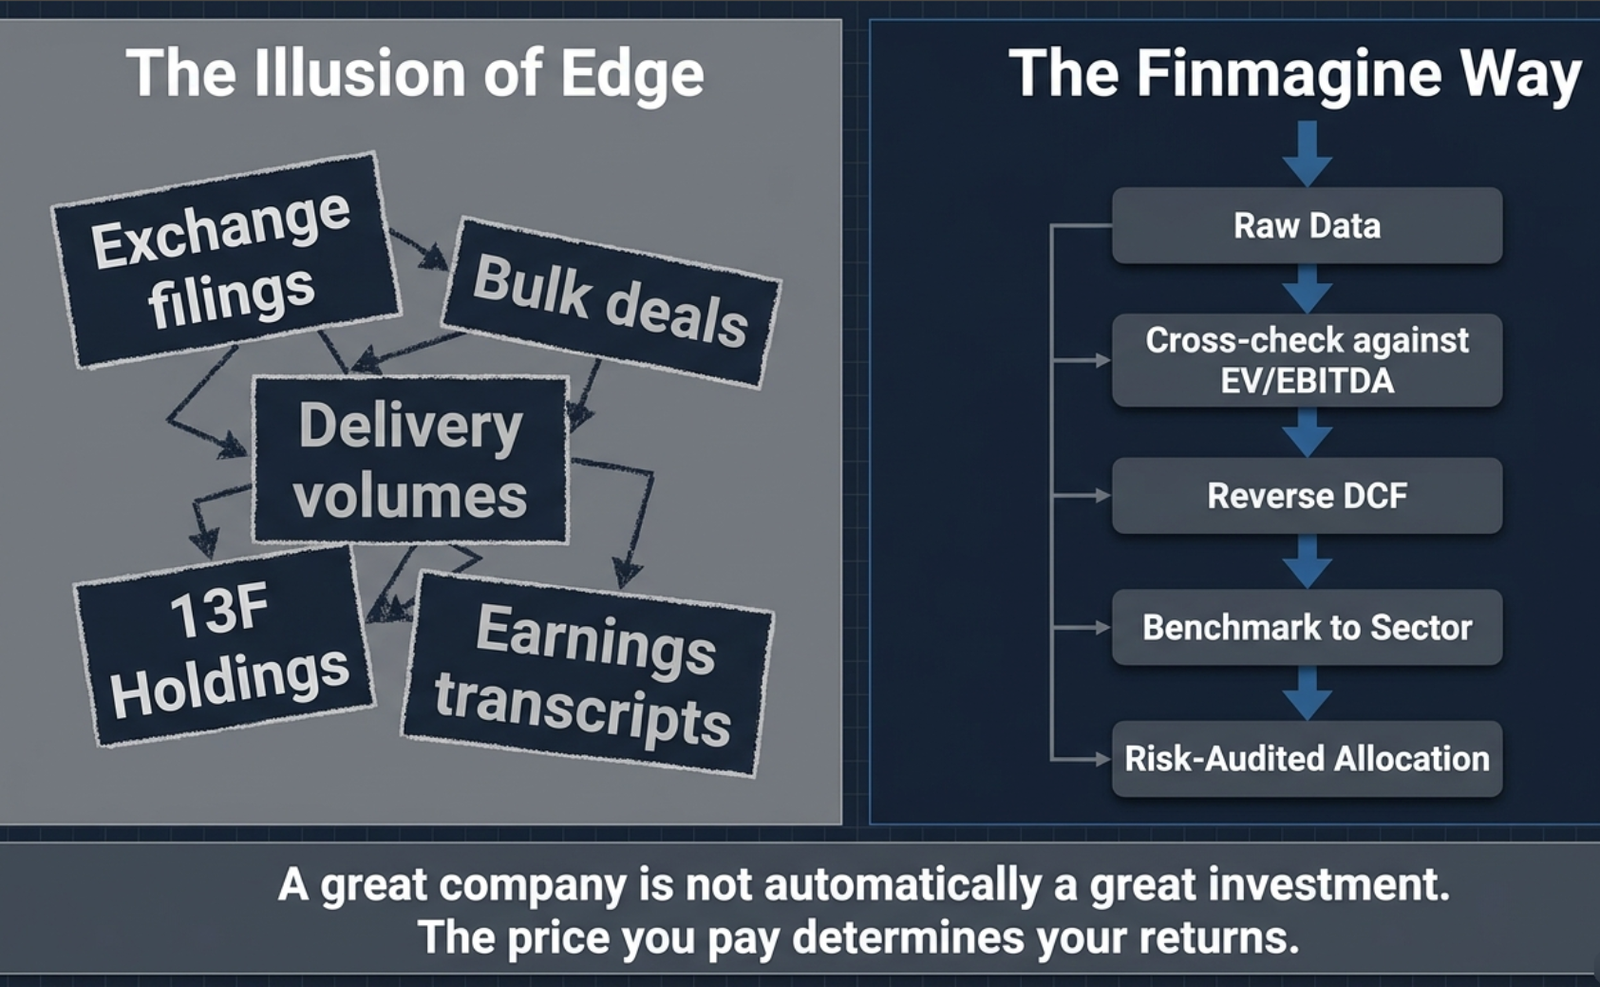
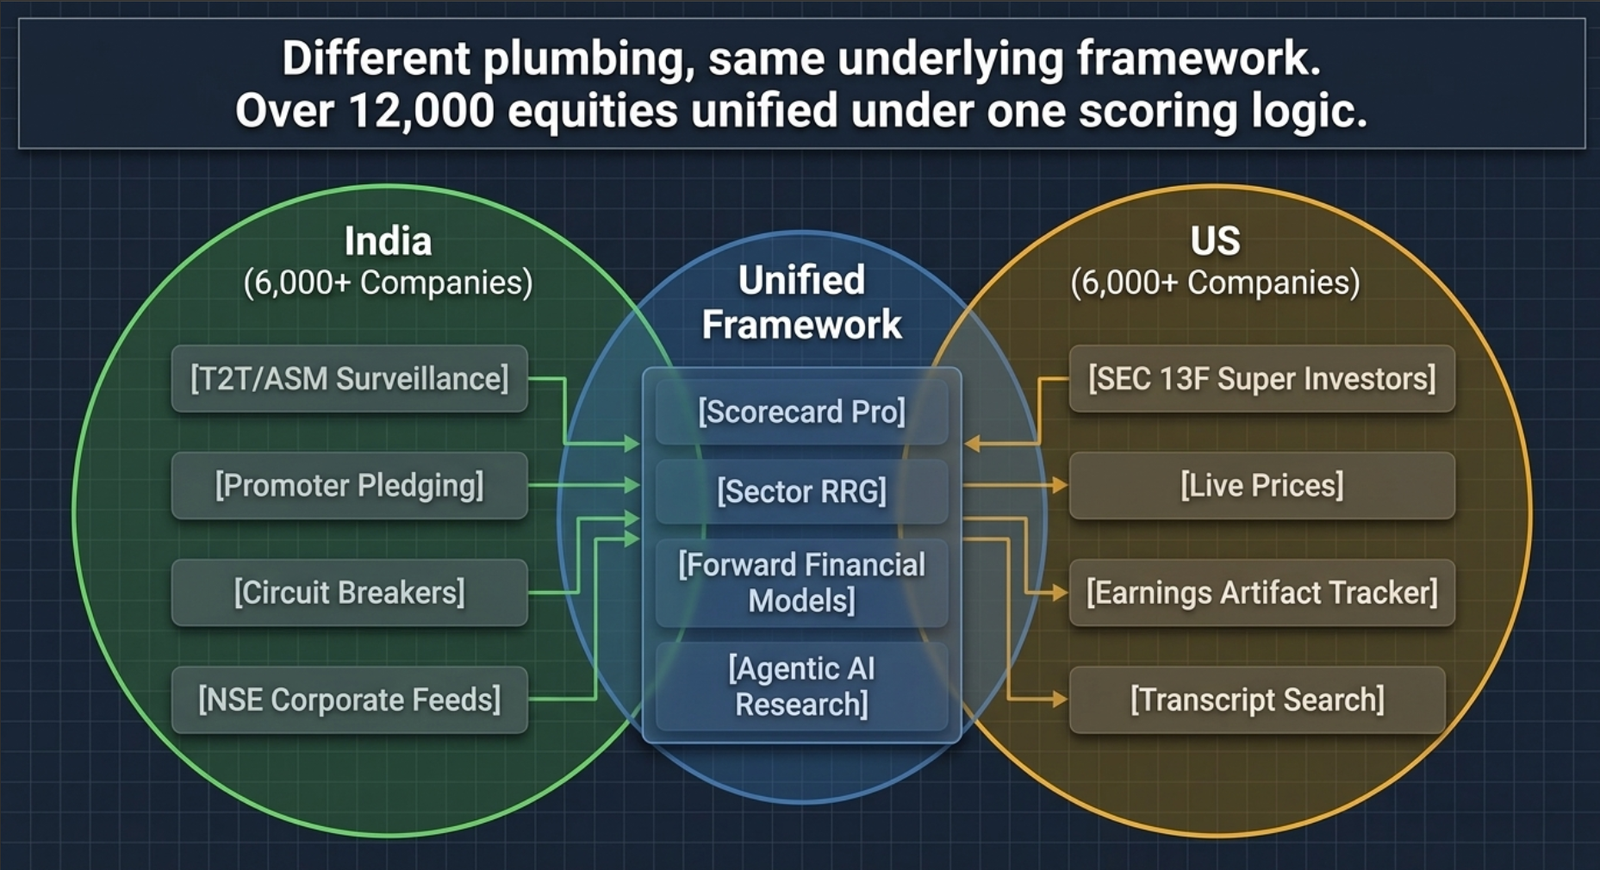
Every piece of data a fund manager uses to analyse a stock is publicly available — it's just scattered across different sources depending on the market. In India: exchange filings, bulk and block deals, delivery volumes, shareholding patterns, concall transcripts. In the US: SEC filings, 13F institutional holdings, earnings call transcripts, market data. Different plumbing, same underlying idea — you have access to essentially the same raw material a fund manager does.
What you don't have, by default, is the framework to interpret it. A fund manager doesn't read a P/E ratio in isolation. They cross-check it against EV/EBITDA, normalise it for debt structure, run it against a reverse DCF, benchmark it to the sector, and overlay earnings growth trajectory — systematically, not occasionally.
The core insight
A great company is not automatically a great investment. The price you pay determines your returns. Finmagine shows you not just what a stock is trading at, but why the market is pricing it that way — and whether that pricing makes sense given the business.
In 2026 that framework spans a web platform covering 6,000+ Indian companies and 6,000+ US companies, four Chrome extensions that work directly on Screener.in, a multi-agent research and consensus platform, and a REST/MCP API for developers and quantitative researchers.
Workflows, Not a Feature List
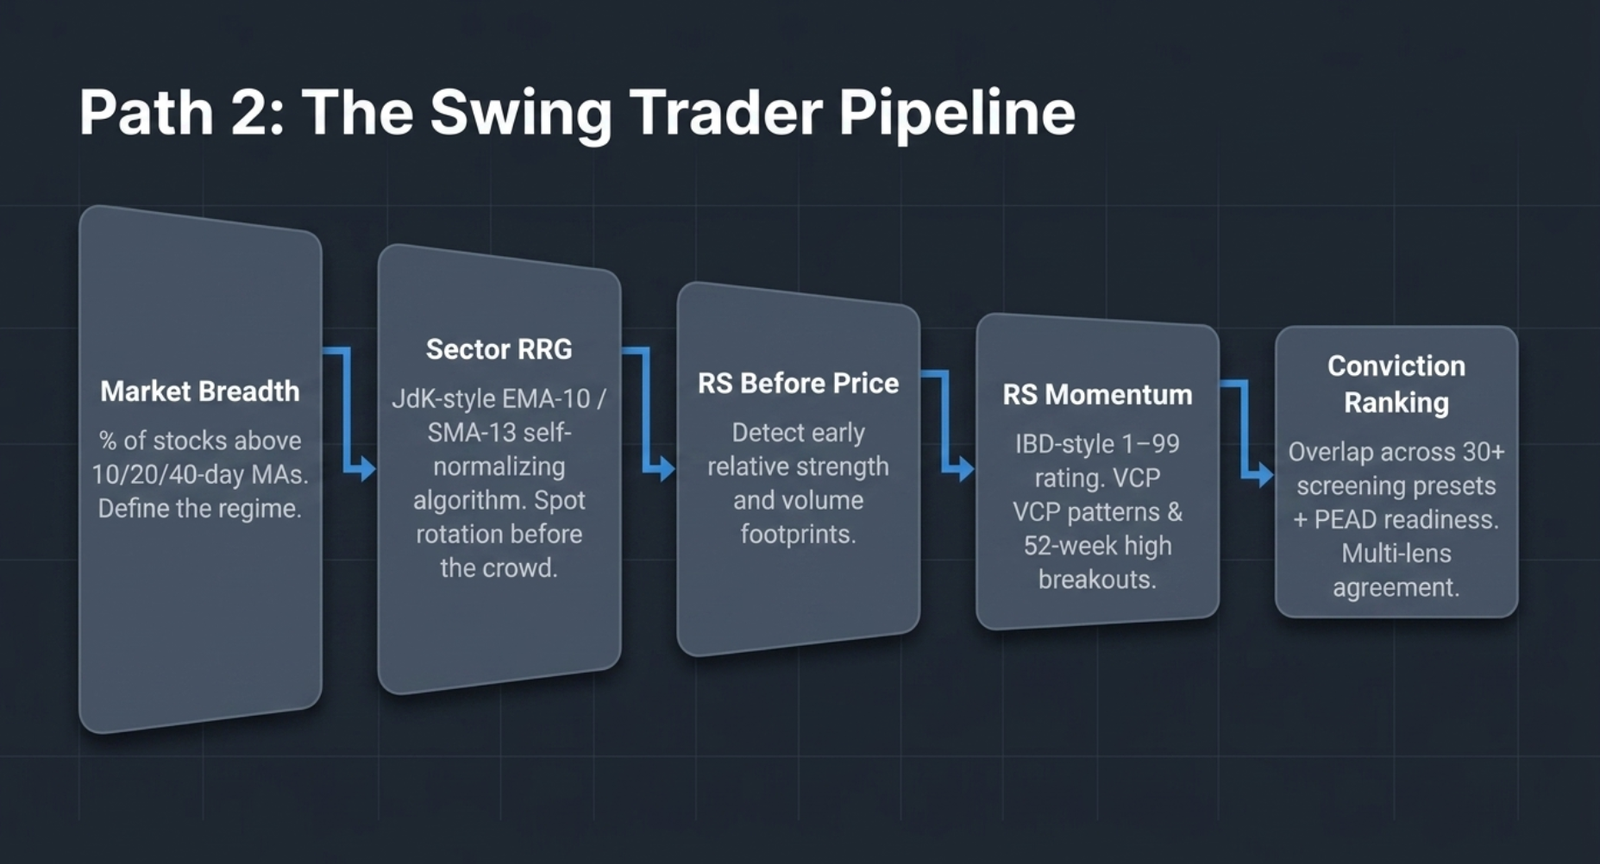
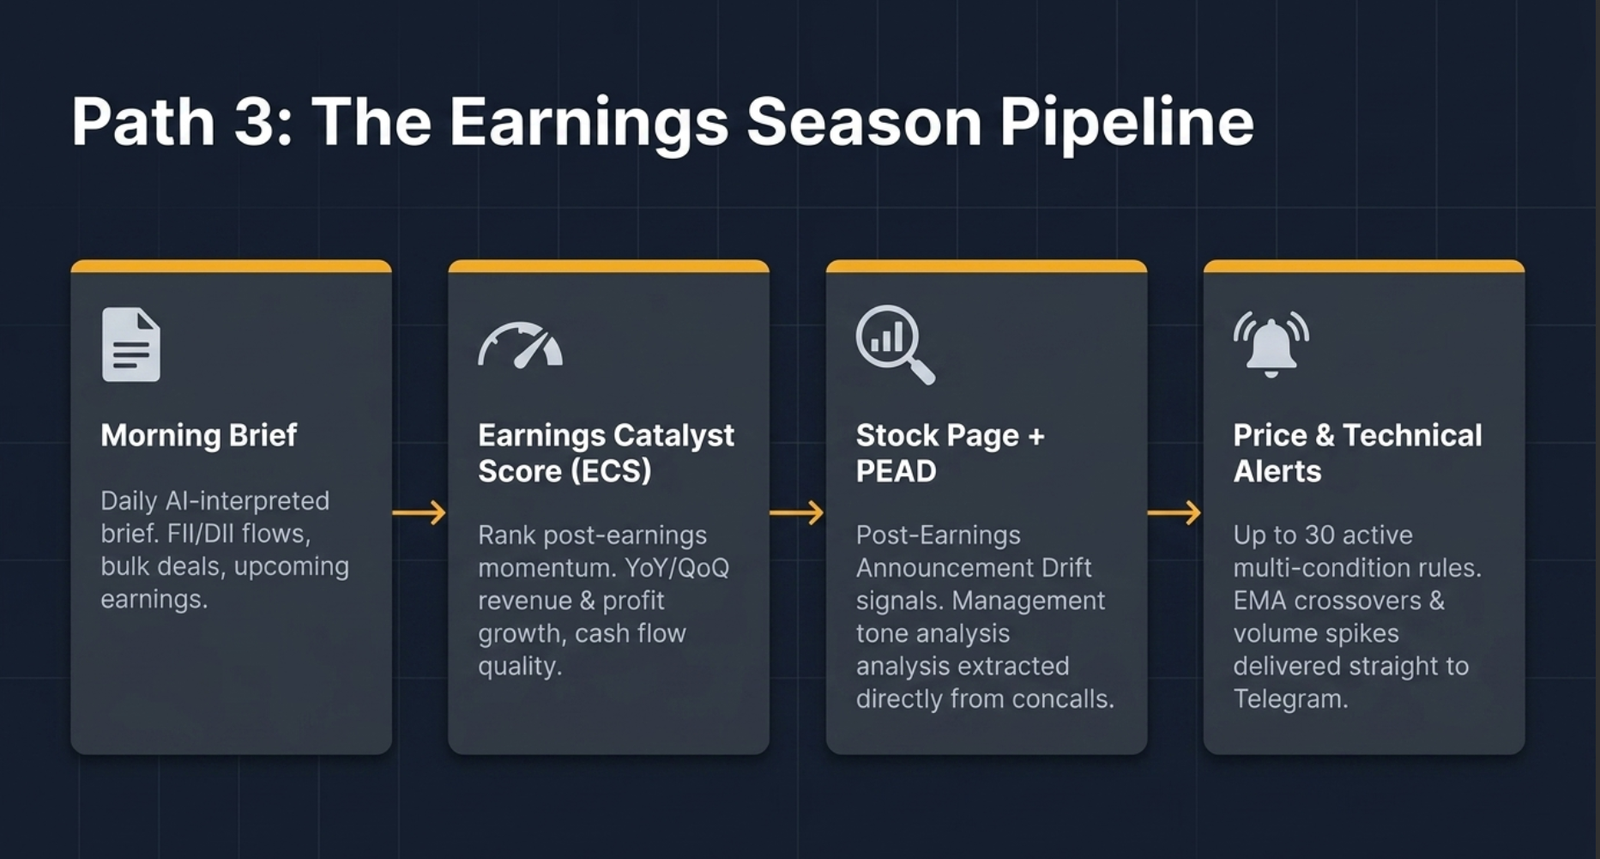
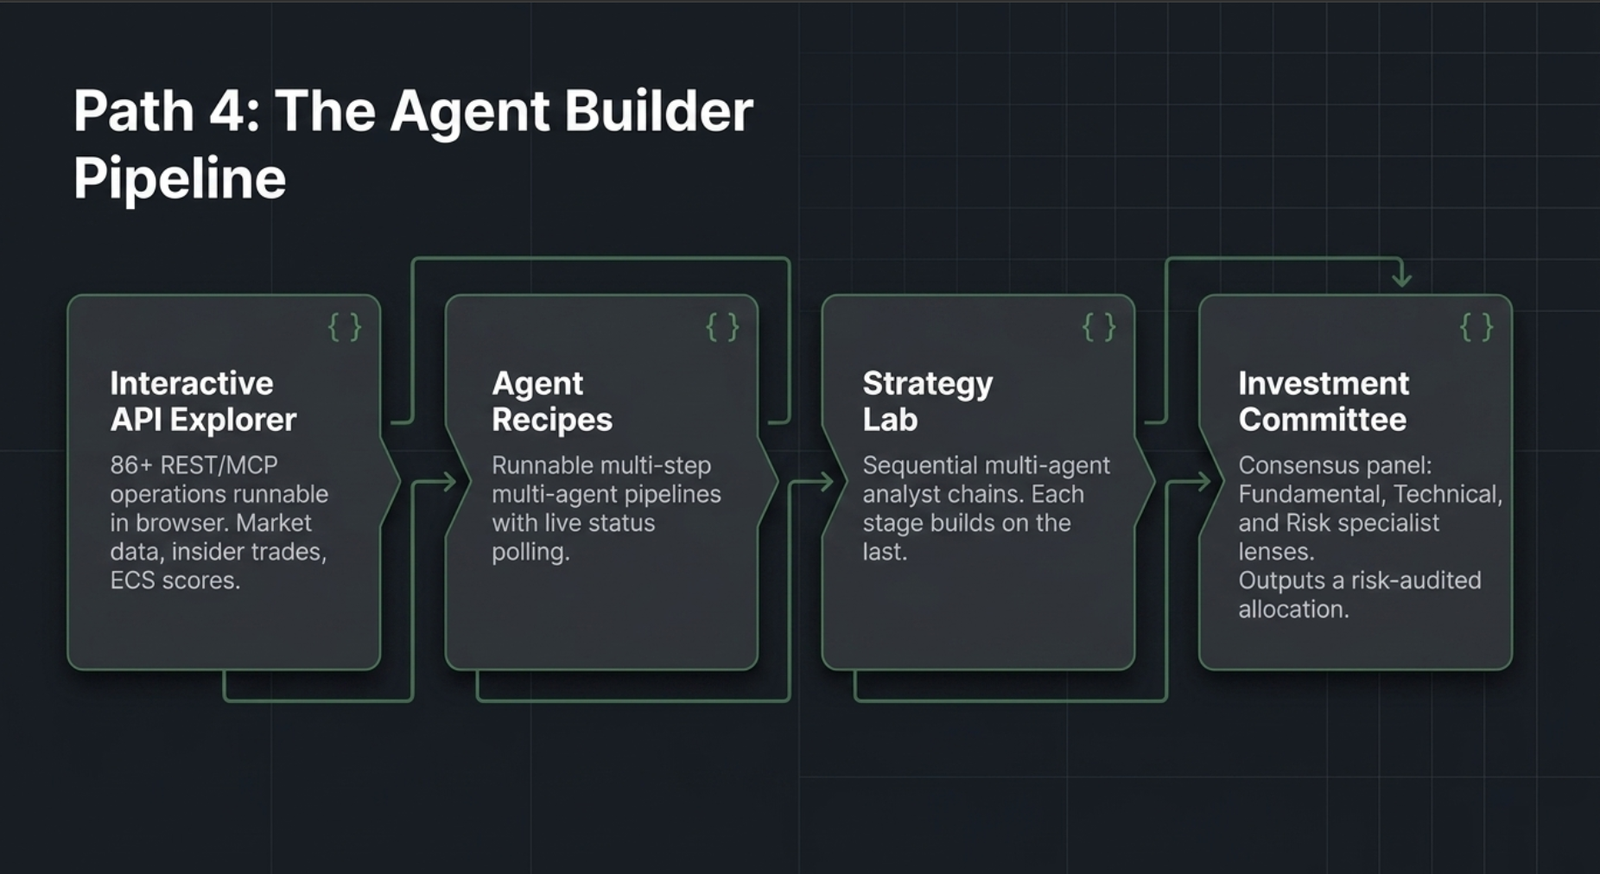
Most platforms are a pile of dashboards. Finmagine is built around four repeatable paths — pick the one that matches how you actually operate, then read the module sections below for the detail on each step.
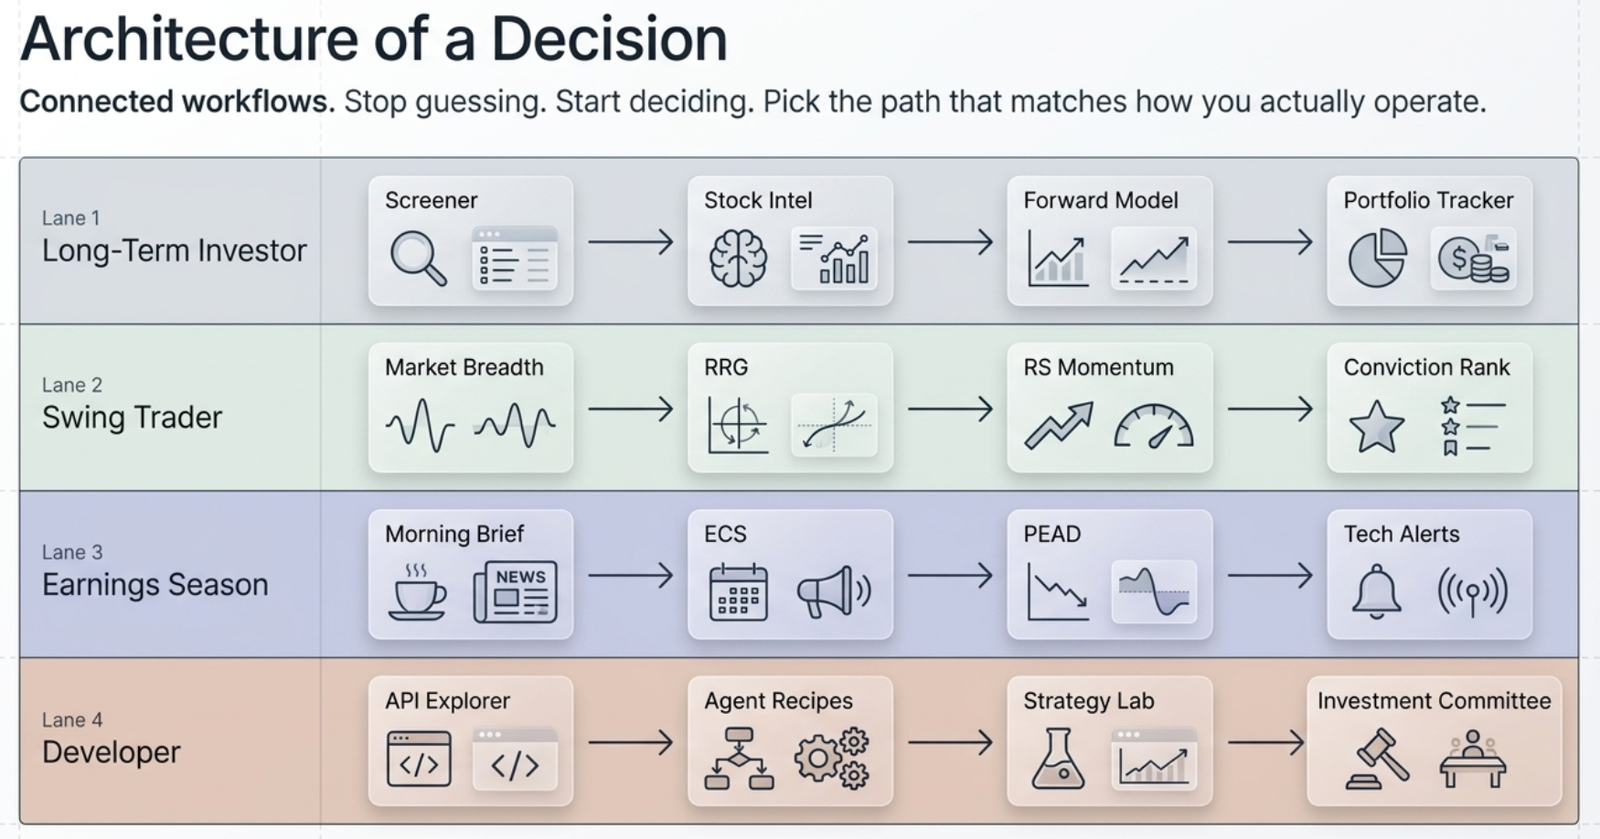
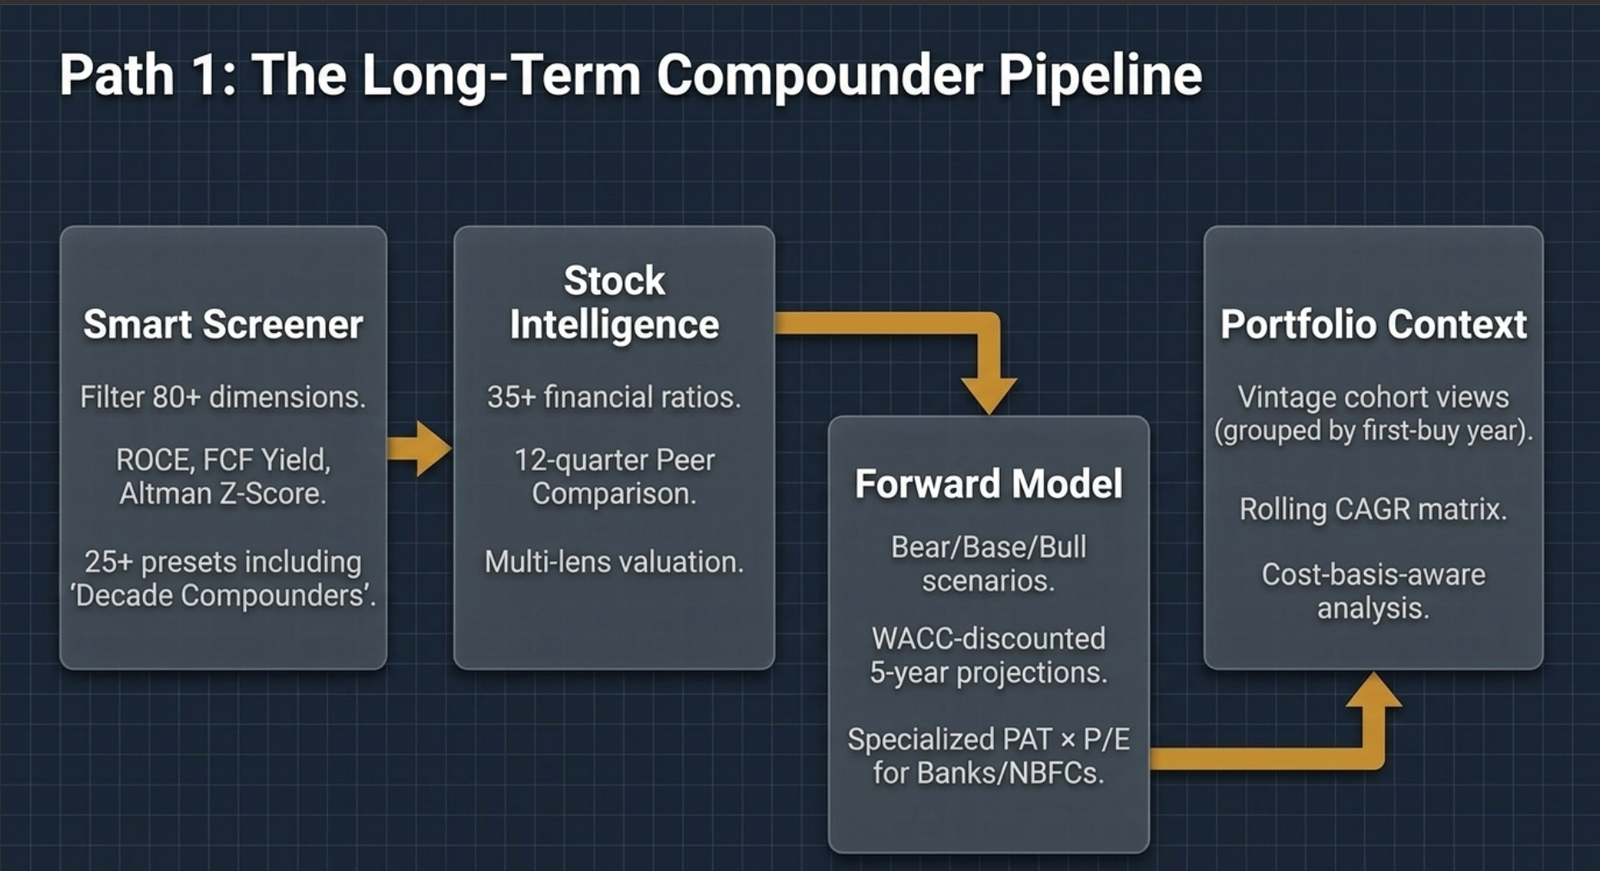
📈 Long-Term Investor
🚀 Swing Trader
📊 Earnings Season
🤖 Developer / Agent Builder
Not sure which lane fits? Start at /stock/ when you already know the company. Start at /screen/, /momentum/, or /picks/ when you need ideas, not a specific name. Start at /markets/ or /breadth/ when you need regime context before either.
Stock Intelligence & Valuation
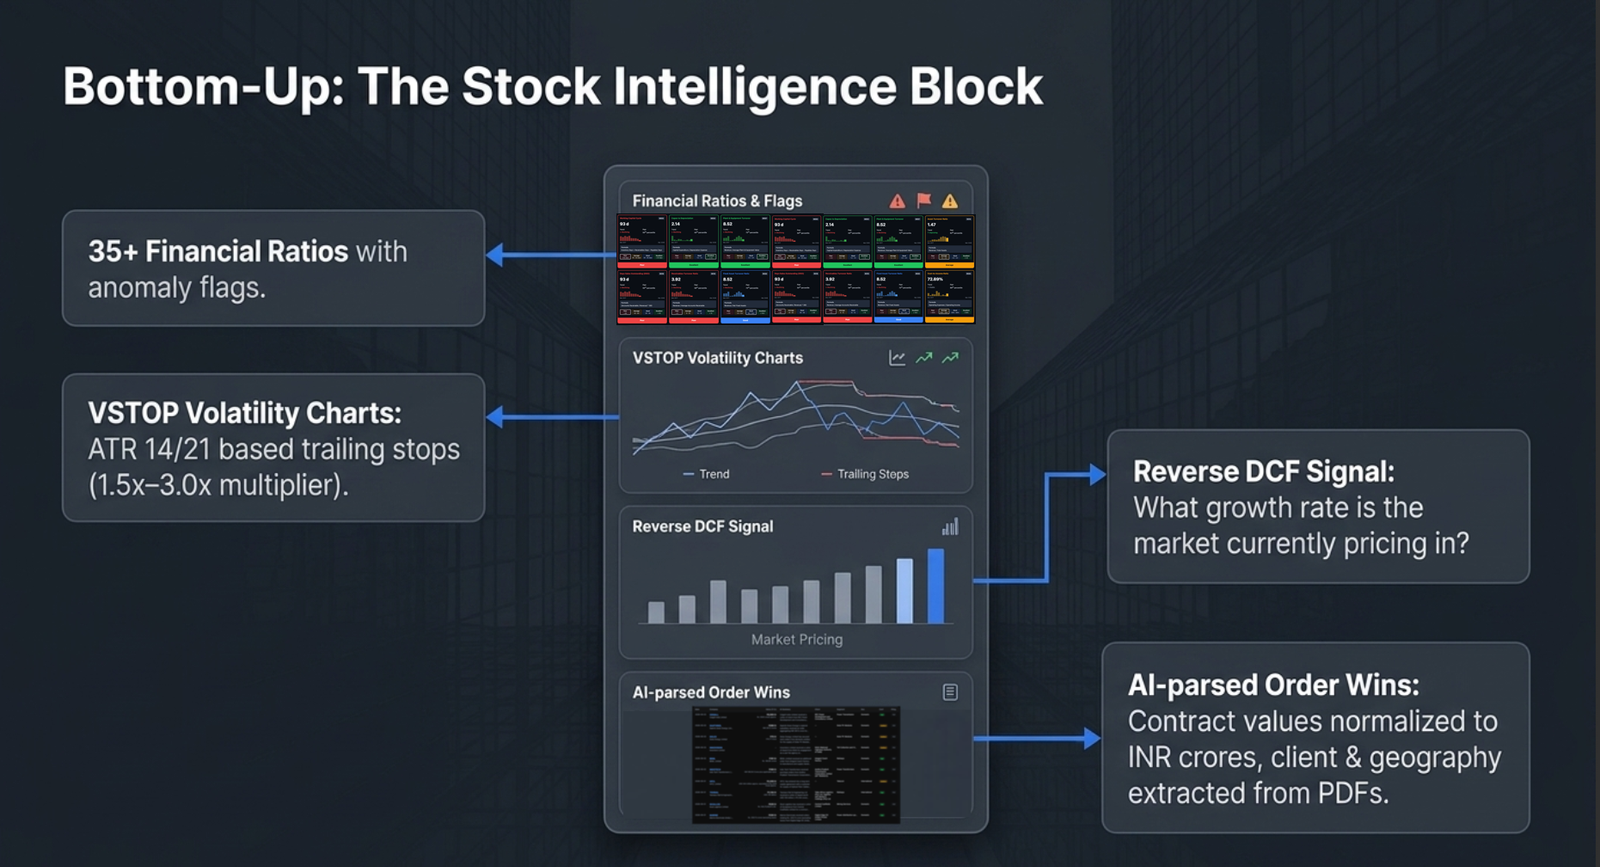
finmagine.com/stock/?symbol=SYMBOLEvery covered company gets a dedicated Intelligence page — 35+ financial ratios with health flags, multi-lens valuation (PE, EV/EBITDA, PEG, Reversed DCF, Scenario), RS Rating, institutional activity tracking, delivery volume analysis, shareholding trends, Order Wins detection, management tone from concall transcripts, AI quarterly summaries, and PEAD + Earnings Catalyst signals — one page, not six browser tabs.
Stock Discovery Hub /stock/ · /us/stock/
Visit either page without a symbol and you land on a 5-tab discovery hub instead of a bare search box. Feed shows activity from your watchlist. Find Ideas bundles Trader scans, curated lists, Momentum & Breadth shortcuts (Sector RRG, Market Mood, Market Valuation, Earnings Catalyst Score), Strategy Lab shortcuts, and Ratings & Scorecard jump-offs. Run Screens launches preset screener configurations in one click. Ask AI bundles the ChatGPT and Claude connector guides, Document & Transcript Search, the AI Research Agent, and Ask Finmagine guides. Get Set Up is a personal onboarding checklist — watchlist, alerts, your AI key, your developer key — 4 rows on India (an Alerts+Telegram row included), 3 on US (no Telegram row exists there yet).
Forward Financial Model /model/
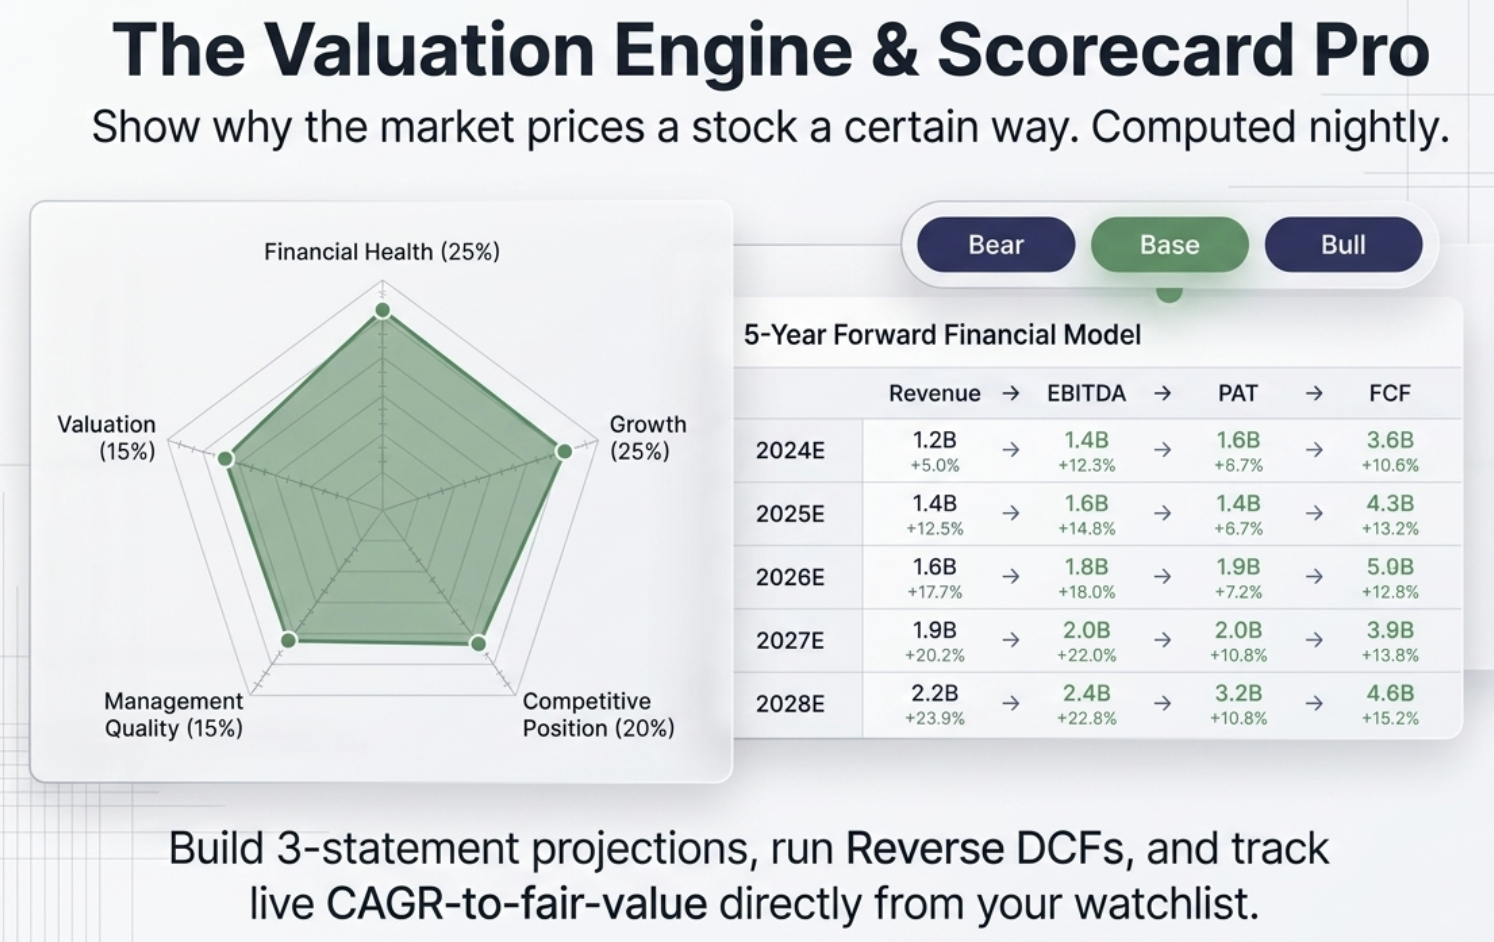
Build your own Bear/Base/Bull scenario — 5-year 3-statement projections (Revenue → EBITDA → PAT → FCF) discounted at WACC for operating companies, or a specialised PAT × P/E model for banks and NBFCs. Pre-loaded with AI-generated assumptions for every covered company; save your own and track live CAGR-to-fair-value from your watchlist.
VSTOP Volatility Charts /charts/
An ATR-based trailing stop overlaid on price and volume — pick the ATR period and multiplier, and a direction-change table tracks the last 6 flips with the return captured between each signal, so you can backtest the indicator on any stock instantly.
Compare & Scorecard /compare/ · /scorecard/
Compare puts any two stocks side by side — 12 quarters of revenue/profit/margins, a ₹10,000-invested returns chart, and ratio health flags across 35+ metrics. Scorecard is a separate tool: a 5-dimension weighted score computed nightly for every NSE-listed stock — Financial Health (25%), Growth (25%), Competitive Position (20%), Management Quality (15%), Valuation (15%) — each rolled up from ratio classifications (Excellent/Good/Average/Poor). Sortable across the full market. Pro.
AI & Data Automation
AI Advisor /ai-advisor.php
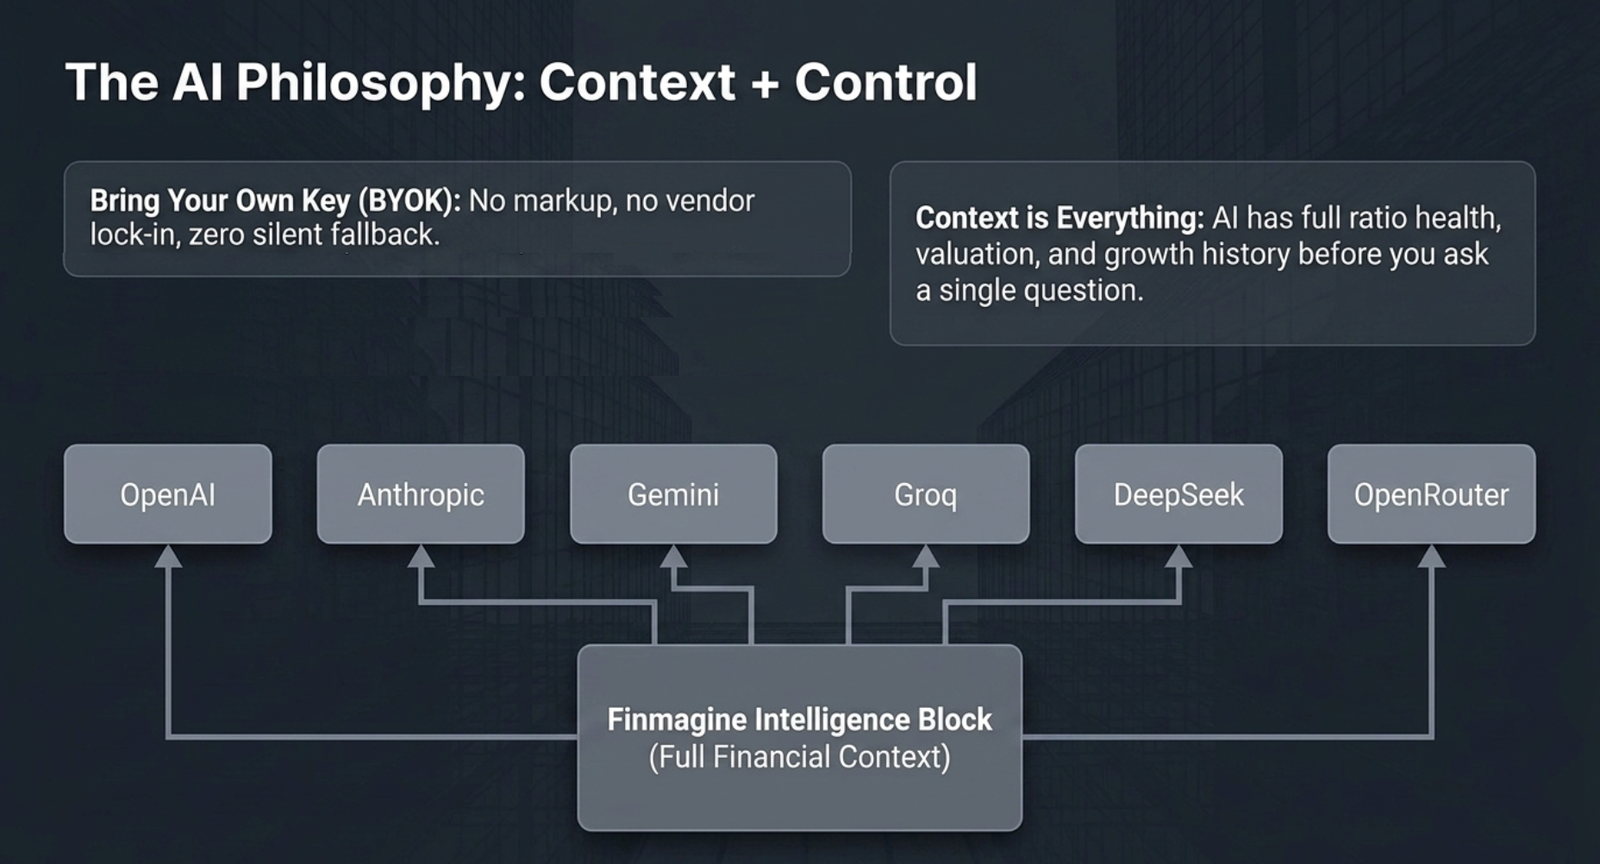
25 structured prompt templates — Comprehensive Analysis, Red Flag Detector, Peer Comparison, IPO Decoder, Porter's Five Forces, MOAT Analysis, and more — pre-loaded with the company's Intelligence Block, so the AI has full context before you ask a single question. Web tool and Chrome Extension, using whichever AI provider you've connected.
Corporate Feeds /insider/ · /order-wins/
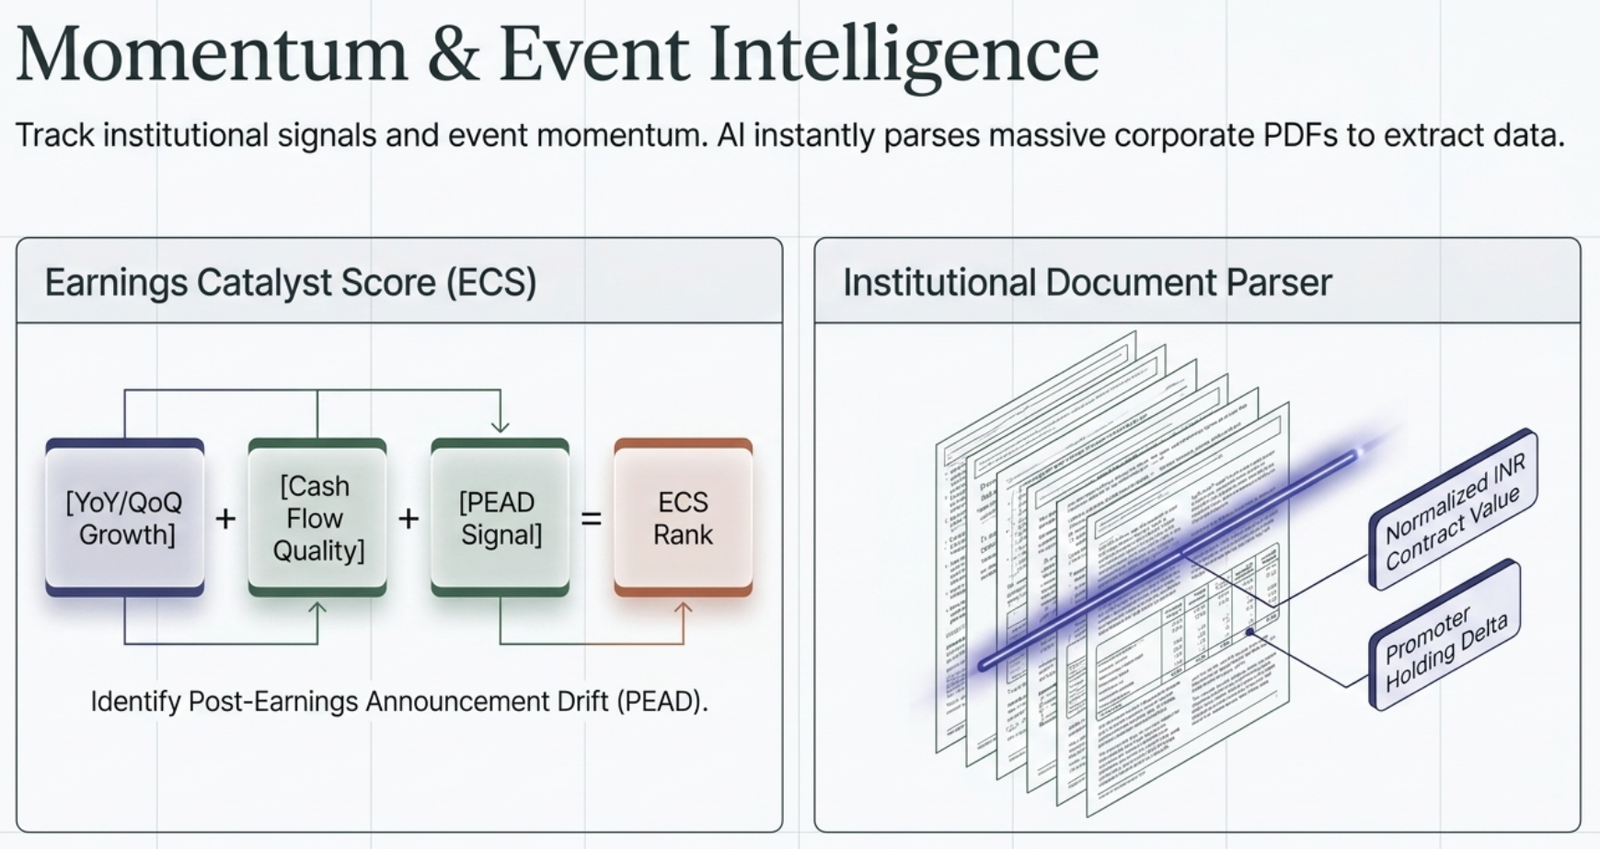
Daily AI-parsed feeds from corporate filings. Insider trades classified by promoter/director/KMP category with shareholding delta. Order wins extracted from announcement PDFs — contract value normalised to INR crores, client/segment/geography identified. Filterable by watchlist, value threshold, and confidence level.
Document & Transcript Search /research/ · /us/research/
Search company filings by keyword or company name. India is full-text search across the complete archive — concalls, annual reports, credit-rating reports, and investor presentations. US search currently covers earnings-call transcripts only — a real, current gap, not a design choice to hide. An AI Research Agent sits alongside it on both markets for cited Q&A over the same filings, and tells you plainly when it can't find an answer rather than guessing.
Earnings Catalyst Score /ecs/
Ranks stocks by post-earnings momentum potential — revenue and profit growth (YoY and QoQ), cash flow quality, and PEAD signal strength combined. AI quarterly summaries and management tone analysis feed into the same score. Premium.
Ask Finmagine /ask-guides/
A guided chat interface trained on Finmagine's own documentation and platform guides — ask how a tool works or what a metric means, and get an answer sourced from the actual site, not a generic model guess.
Scanners & Momentum
Smart Screener /screen/
Filter 6,000+ Indian companies across 80+ dimensions — ROCE, ROE, OPM, D/E, multi-year CAGRs, FCF yield, Altman Z-Score, promoter pledge, historical FY price/P-E range, margin-expansion/re-rating signals, and quarterly EPS/sales-acceleration filters — in both India and US screeners. 25+ named presets including Decade Compounders, FCF Machines, and Bulletproof Quality, each with a "Why It Screened" synthesis of the signals behind a match, using your chosen AI provider. Select up to 5 results and send them straight to the Investment Committee for a consensus review.
RS Momentum Scanner /momentum/ · /rs-high/
RS Rating (IBD-style 1–99 score) updated daily across the market. Swing Trader signals for VCP patterns, 52-week high breakouts, and near-high setups with Entry Readiness scoring. Premium.
Conviction Ranking /conviction/
Not a blended RS-plus-fundamentals formula. Conviction combines overlap across 30+ named screening presets — Fortress Balance, Magic Formula, Minervini VCP, Decade Compounders, and more — with readiness overlays from sector breadth, Earnings Catalyst Score, and PEAD candidacy. A stock ranks high when multiple independent lenses agree, not from one score.
Curated Picks /picks/
Stock of the Week, curated model portfolios, and a running set of editorial scans across ratings, PEAD candidates, and scorecard views — the same scan engine behind the Finmagine Trader Chrome extension, available on the web.
Market Sentiment & Macro
Market Intelligence /markets/
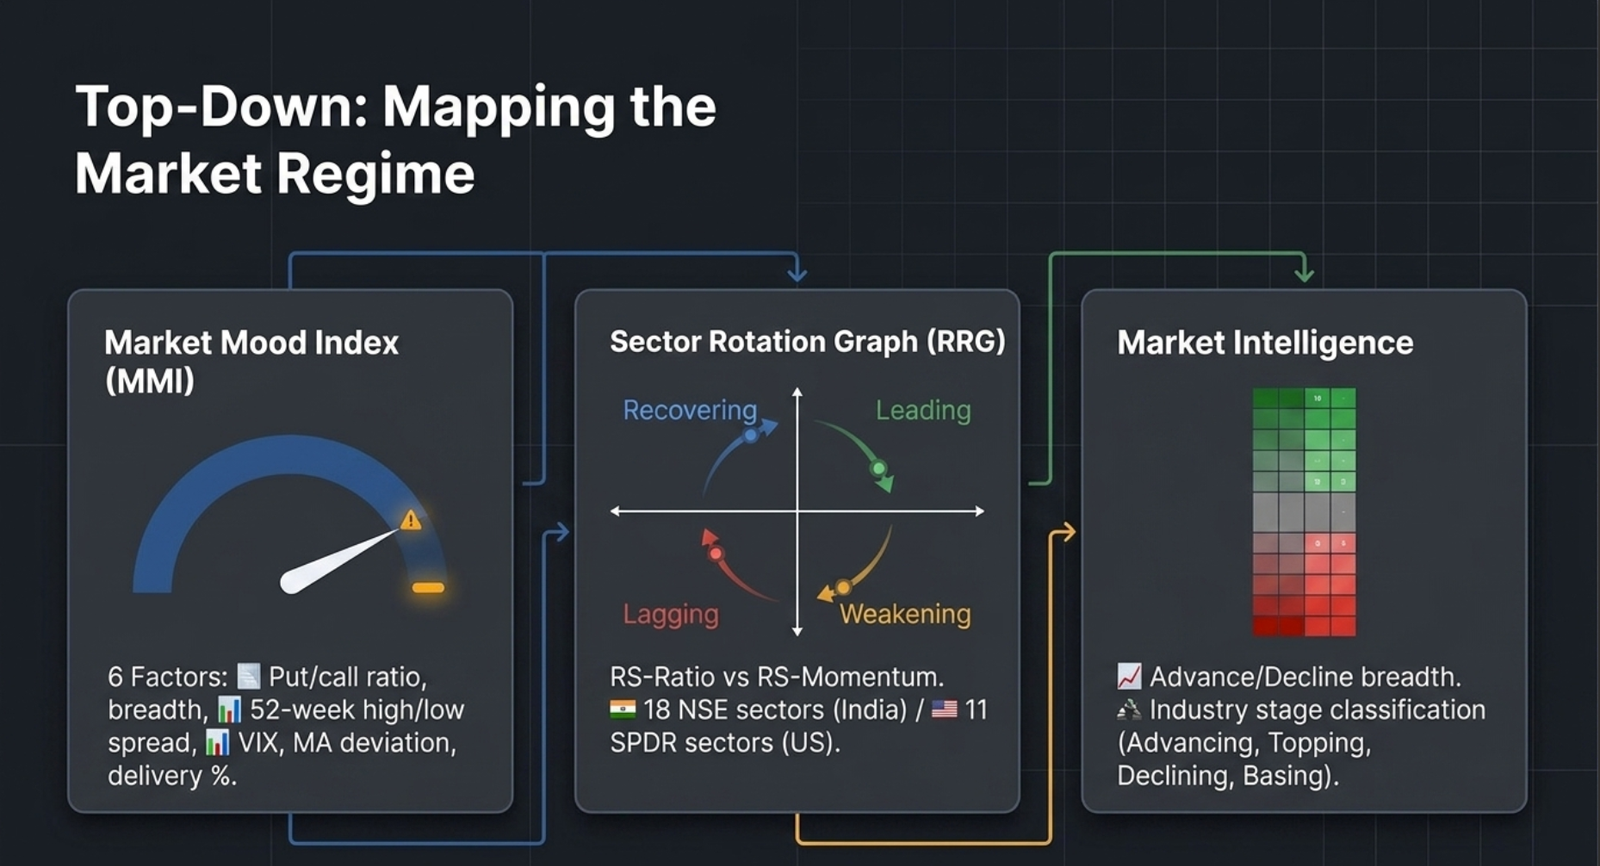
Top-down analysis across 12 tabs — advance/decline breadth, % of stocks above key moving averages, industry stage classification, 52-week high distribution, sector heatmaps. Know the regime before you pick stocks.
EOD Sector Rotation Graph /rrg/ · /us/rrg/
An end-of-day Relative Rotation Graph — RS-Ratio vs RS-Momentum per sector, self-normalised via a JdK-style EMA/SMA algorithm, so you see which sectors are leading, weakening, lagging, or recovering. Dynamic trails animate rotation across recent sessions. 18 NSE sectors for India, 11 SPDR sectors vs. SPY for the US.
Market Mood Index /mmi/
A daily fear/greed gauge from 6 factors — put/call ratio, breadth, 52-week high/low spread, VIX, moving-average deviation, delivery percentage. Tracked historically so you know whether the market is in extreme greed or panic.
Market Structure & Event Feeds /circuit/ · /pledging/ · /ipo/
Circuit breaker activity, volume footprint analysis, promoter pledging tracker, T2T/ASM surveillance flags, an IPO calendar, market news, and sector index trackers — the signals that don't fit a single dashboard, grouped in one place.
Ratings & Valuation
Stock Ratings /ratings/
A Fundamental Score (ratio-classification based) and a Reverse-DCF valuation signal, computed nightly for every NSE-listed stock. The "Top Picks" tab is free; the full sortable list is a Professional feature. This is a distinct tool from the Scorecard covered earlier — Stock Ratings is score-plus-valuation-signal classification; Scorecard is the 5-dimension weighted framework.
A note on how to read this
Finmagine is a self-directed research and education platform. The scores, classifications, and signals throughout this guide are decision-support inputs, not instructions — the final investment decision, including what to buy, hold, or sell, and when, remains entirely with the user. Consult a SEBI-registered investment adviser or other qualified professional before acting on any of it.
Portfolio, Risk & Planning
Portfolio Tracker /portfolio/
Cost-basis-aware analysis, vintage cohort view (group holdings by first-buy year), and a rolling CAGR matrix. An automatic corporate-action flag catches bonus issues and splits that haven't been applied to your cost basis yet — surfaced on the Alerts tab with a Telegram nudge, and only applied when you approve it. See which positions are dragging returns and which are compounding quietly.
Named Watchlists & Named Portfolios /portfolio/
Both live inside the Portfolio page's Watchlist tab — a named-watchlist switcher covers India and US/Global separately, and named portfolios let you group holdings by theme or strategy instead of one flat list.
Custom Index & Basket Builder /custom-index/
Build a custom index of up to 10 NSE stocks, assign weights, and simulate historical performance with monthly rebalancing. Save up to 20 baskets per account. Premium.
Price & Technical Alerts /alerts/
User-defined price levels, RSI conditions, EMA crossovers, and volume spike triggers — up to 30 active multi-condition rules per account, now across both India and US markets, run nightly after market close. Alerts can deliver straight to Telegram, and US positions get a tiered stop-loss digest. Premium.
Financial Calculators Suite /tools/tools.php
SIP, NPS (with Section 80CCD tax savings), Lumpsum, Compound Interest, Recurring Deposit, an Investment Risk Calculator (VaR, Kelly Criterion, Efficient Frontier, Monte Carlo), and a Financial Chart Builder.
Mutual Funds /mf/
NAV, returns, and category rankings for mutual fund schemes, with a dedicated detail page for every scheme — a companion research surface for investors who hold funds alongside direct equity.
🇺🇸 US Markets
The same scoring and workflow logic runs across both markets — 6,000+ US companies on NYSE/NASDAQ, covered by the same core toolkit. US brings deep stock/screener/earnings/transcript coverage; India adds exchange-surveillance and corporate-filing breadth (circuit breakers, T2T/ASM, promoter pledging) with no US equivalent yet.
US Screener & Scorecard /us/screen/ · /us/scorecard/
The same multi-dimension screening engine and Finmagine scoring system, rebuilt for US equities — including historical FY price/P-E range and re-rating filters, plus intelligence-signal filters (earnings momentum, management tone, insider activity) layered into results.
US Breadth, RRG & Market Mood /us/breadth/ · /us/mmi/
Advance/decline breadth, the 11-sector SPDR Rotation Graph, and a US Market Mood Index — the same top-down regime read, applied to the US market.
US Momentum, Conviction & 13F Investors /us/momentum/ · /us/star-investors/
RS-driven momentum scanning and Conviction Ranking for US equities, plus quarterly 13F tracking of major US funds — shareholding changes, new positions, exits — alongside AI-generated full company reports and a forward DCF model for every covered US stock.
US Live Prices & Earnings Artifact Tracker /us/earnings/
US stock pages now show live prices instead of a static nightly label, with technical charts updating from the same feed. A dedicated Earnings Artifact Tracker brings together earnings-related artifacts for US stocks in one place.
🤖 Agentic Research & Developer Platform
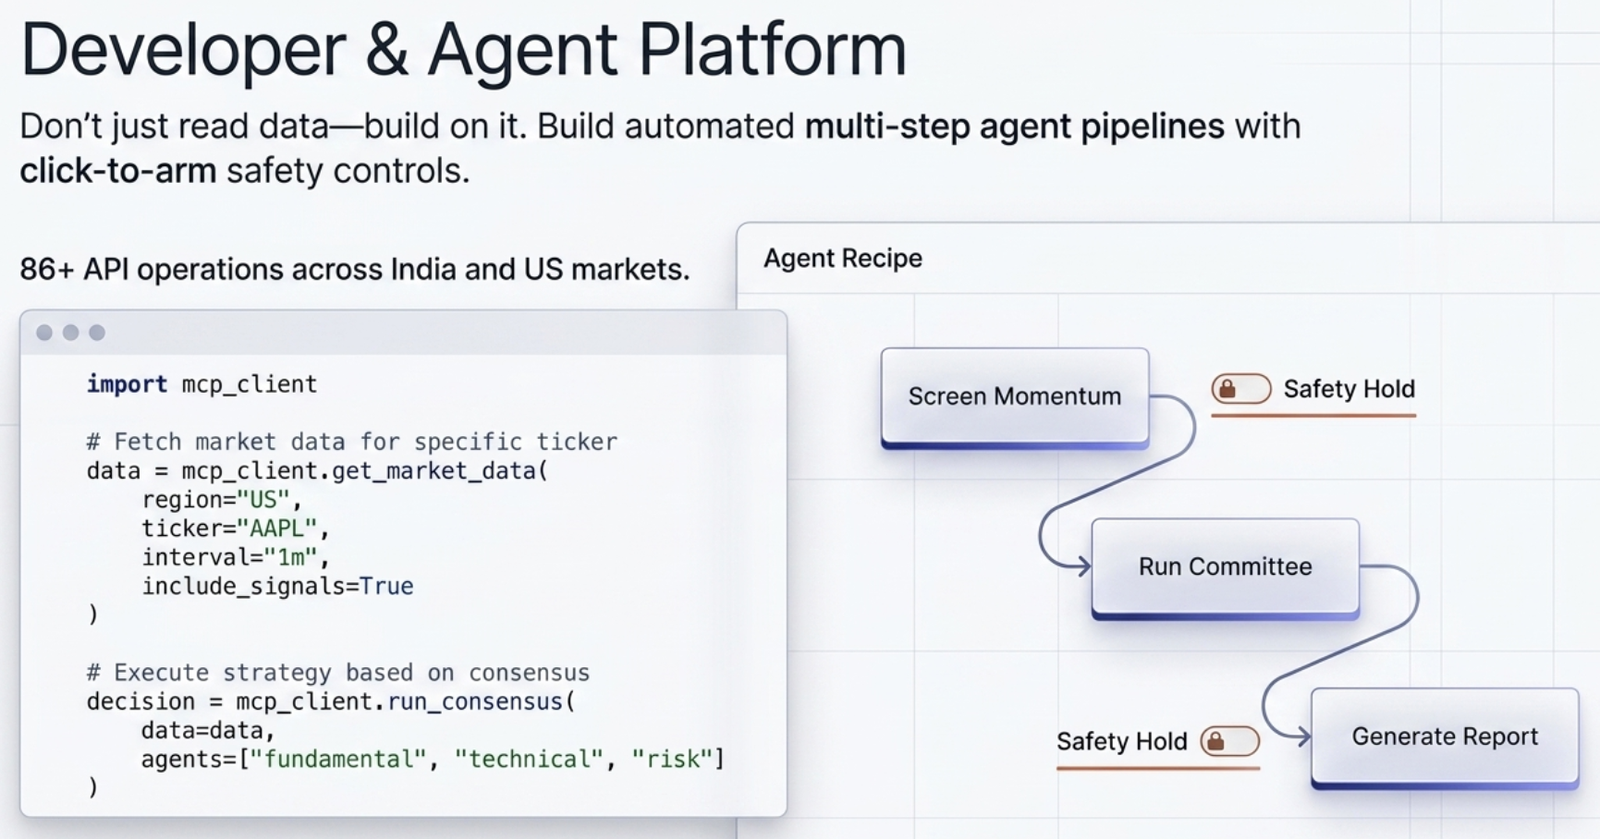
Beyond dashboards — programmatic access, multi-agent research, and consensus decision-making. One example end-to-end: Screen → Investment Committee → Risk-Audited Allocation, runnable via the UI or the API.
Interactive API Explorer /developer/api-explorer.php
Click-and-run REST/MCP endpoint testing directly in the browser — 86+ operations across India and US market data, company profiles, financials, ratios, momentum, insider trades, order wins, sector RRG coordinates, and more.
Agentic Workflow Explorer /developer/agentic-workflow-explorer.php
Runnable multi-step agent recipes — chain, configure, and execute pipelines like momentum screens, committee allocations, or research deep-dives, with click-to-arm safety controls and live status polling.
Agent-Ready Pages (WebMCP)
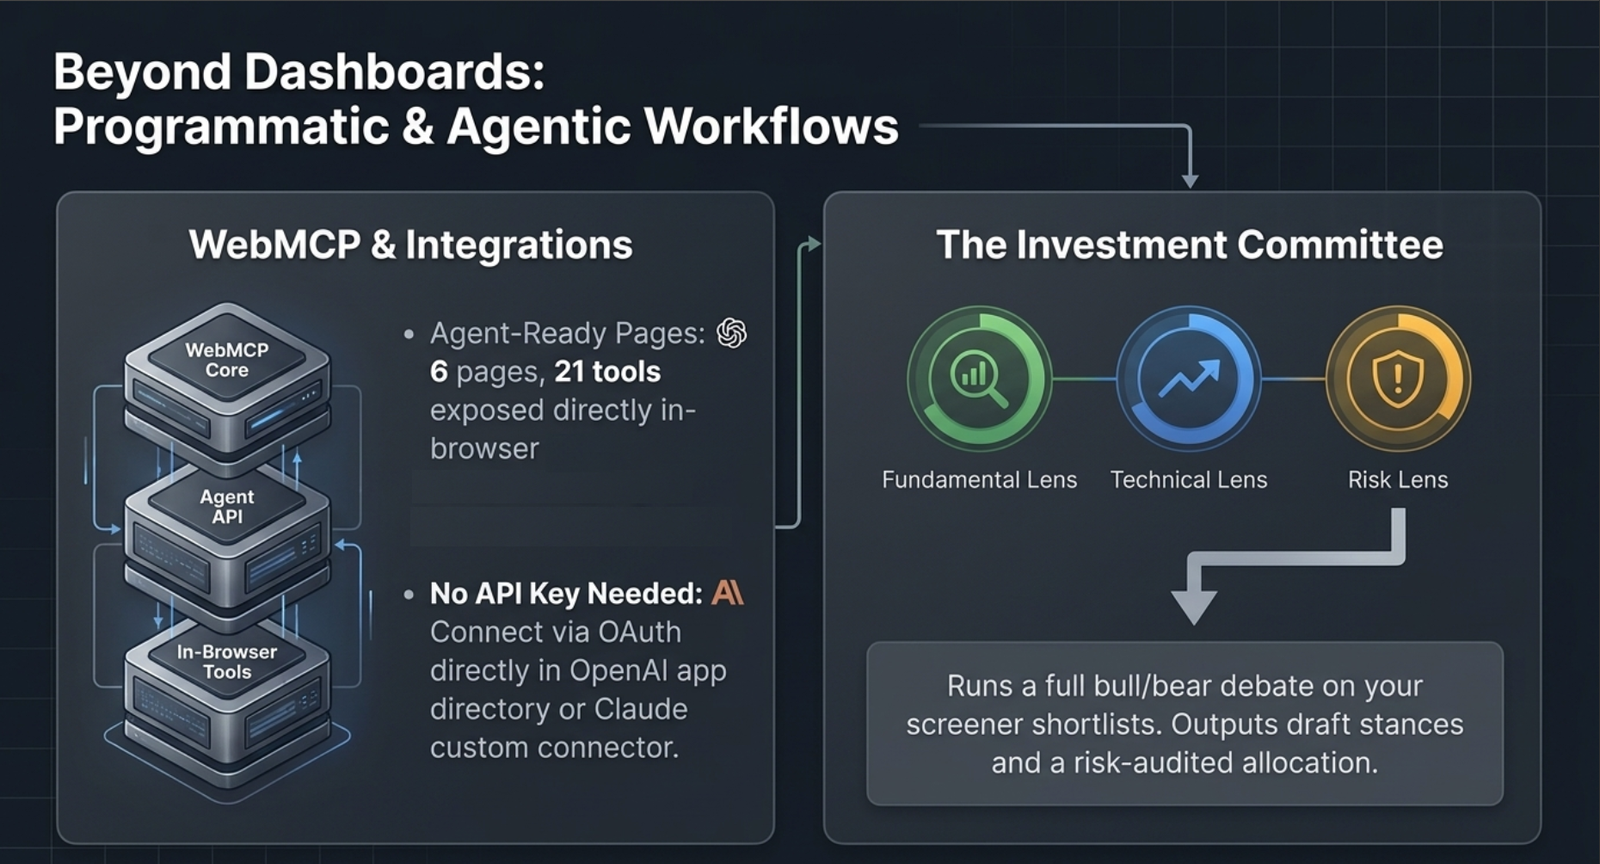
The API Explorer and Agentic Workflow Explorer above are for agents calling Finmagine from outside the browser. Selected pages go a step further: Screener, Stock Intelligence, and Picks — across both India and US, 6 pages, 21 tools in total — expose typed tools directly inside the page itself, so a supported AI browser can set filters, run a scan, switch tabs, or pull a financials summary without scraping the HTML or taking a screenshot. Confirmed working with ChatGPT's in-app browser. In public beta for Premium+ subscribers.
Finmagine in ChatGPT & Claude
Approved and live in OpenAI's app directory, and available as a Claude custom connector — connect either via OAuth, no API key to paste, then ask market questions, run screens, and pull AI research directly inside the chat app you already use.
Strategy Lab & Investment Committee /strategy-lab/
Strategy Lab runs sequential multi-agent research chains on a company or theme, each stage building on the last. Its Investment Committee tab runs a multi-agent consensus panel — Fundamental, Technical, and Risk specialist lenses — against companies you enter directly, or a shortlist sent from the Screener. A full bull/bear debate panel lays out both cases side by side, with opt-in toggles for news and macro context. Produces a draft stance per stock plus a risk-audited allocation. Premium.

Bring Your Own LLM Key /account/ai-keys.php
Every AI feature — Advisor, Strategy Lab, Investment Committee, quarterly summaries — runs on your own key across 6 providers: OpenAI, Anthropic, Gemini, Groq, DeepSeek, OpenRouter. No Finmagine-paid fallback and no silent usage: you always see which provider and model is active before it runs, and can switch anytime. A separate Alpha Vantage data-source key is also available for Investment Committee's News & Sentiment context on US stocks — off until you configure it.
Developer Corner — try a real API call
curl -H "Authorization: Bearer fmk_YOUR_KEY" \
  "https://finmagine.com/api/v1/presets/catalog"
Chrome Extensions
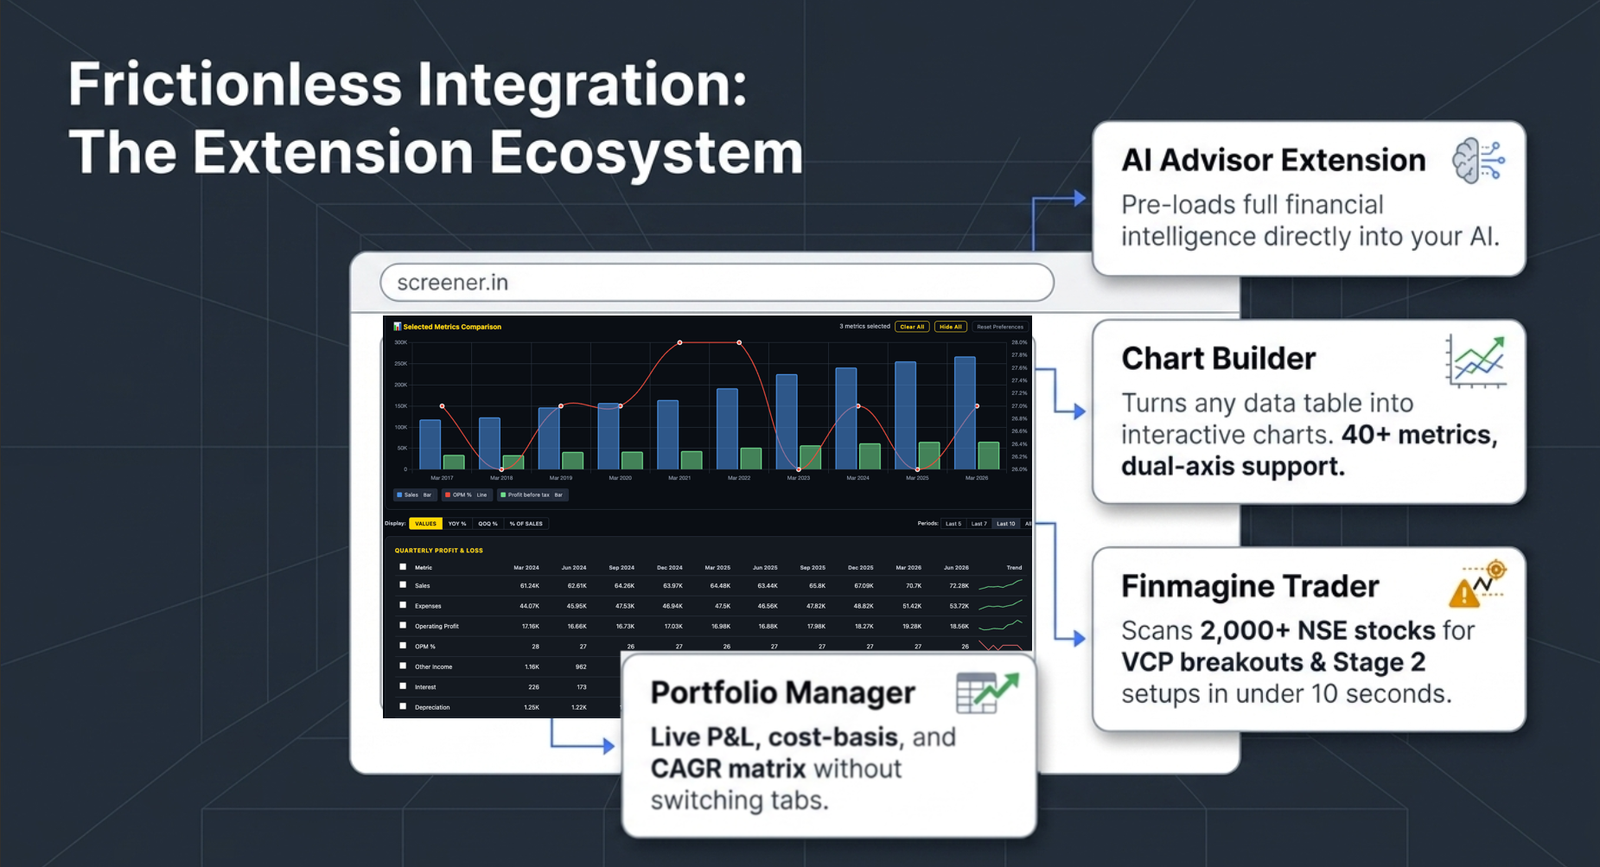
Chart Builder
Turns any Screener.in or Google Finance data table into an interactive chart in one click. No data leaves your browser.
AI Advisor Extension
Pre-loads a company's full financial intelligence into your AI before you ask a single question. Works on Screener.in.
Finmagine Trader
Scans 2,000+ NSE stocks for VCP breakouts, Stage 2 setups, and 52-week high candidates in under 10 seconds, directly inside Screener.in.
Portfolio Manager
Live P&L, cost-basis tracking, and CAGR matrix in a browser sidebar — no tab switching.
Education & NISM XV
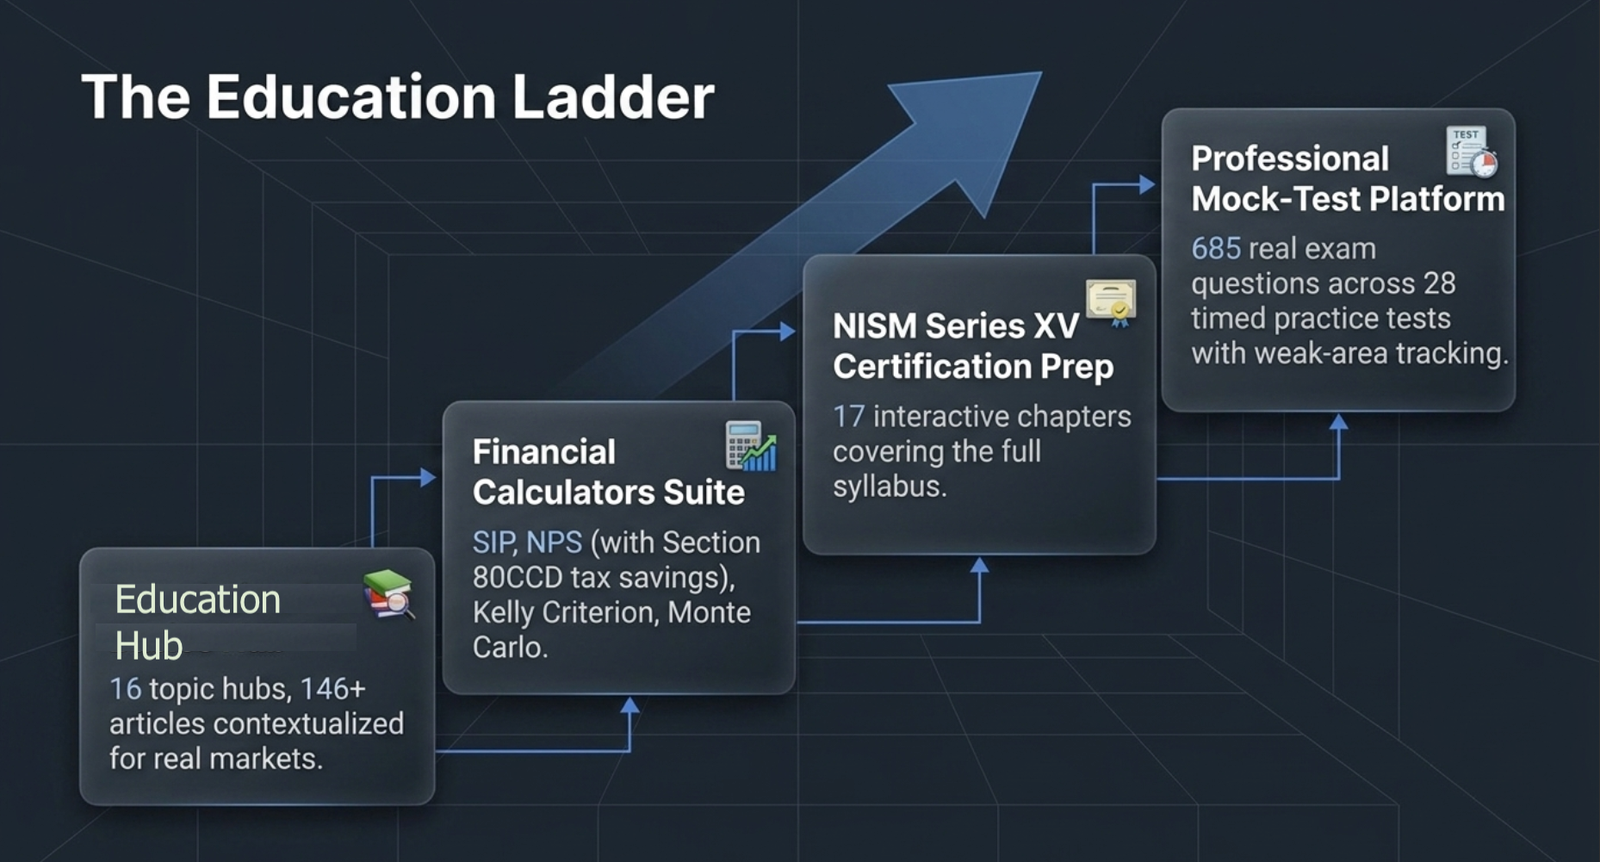
16 topic hubs, 146+ articles, from market basics to advanced analysis — every concept explained in the context of real markets, then applied directly in the tools above. The NISM Series XV Research Analyst certification prep is a complete interactive study guide — 17 chapters, sequential navigation, concept summaries, practice questions — free to access. A full mock-test platform — 685 real exam questions across 28 timed practice tests, with per-question weak-area tracking — is available to Professional subscribers.
Why This Is Different
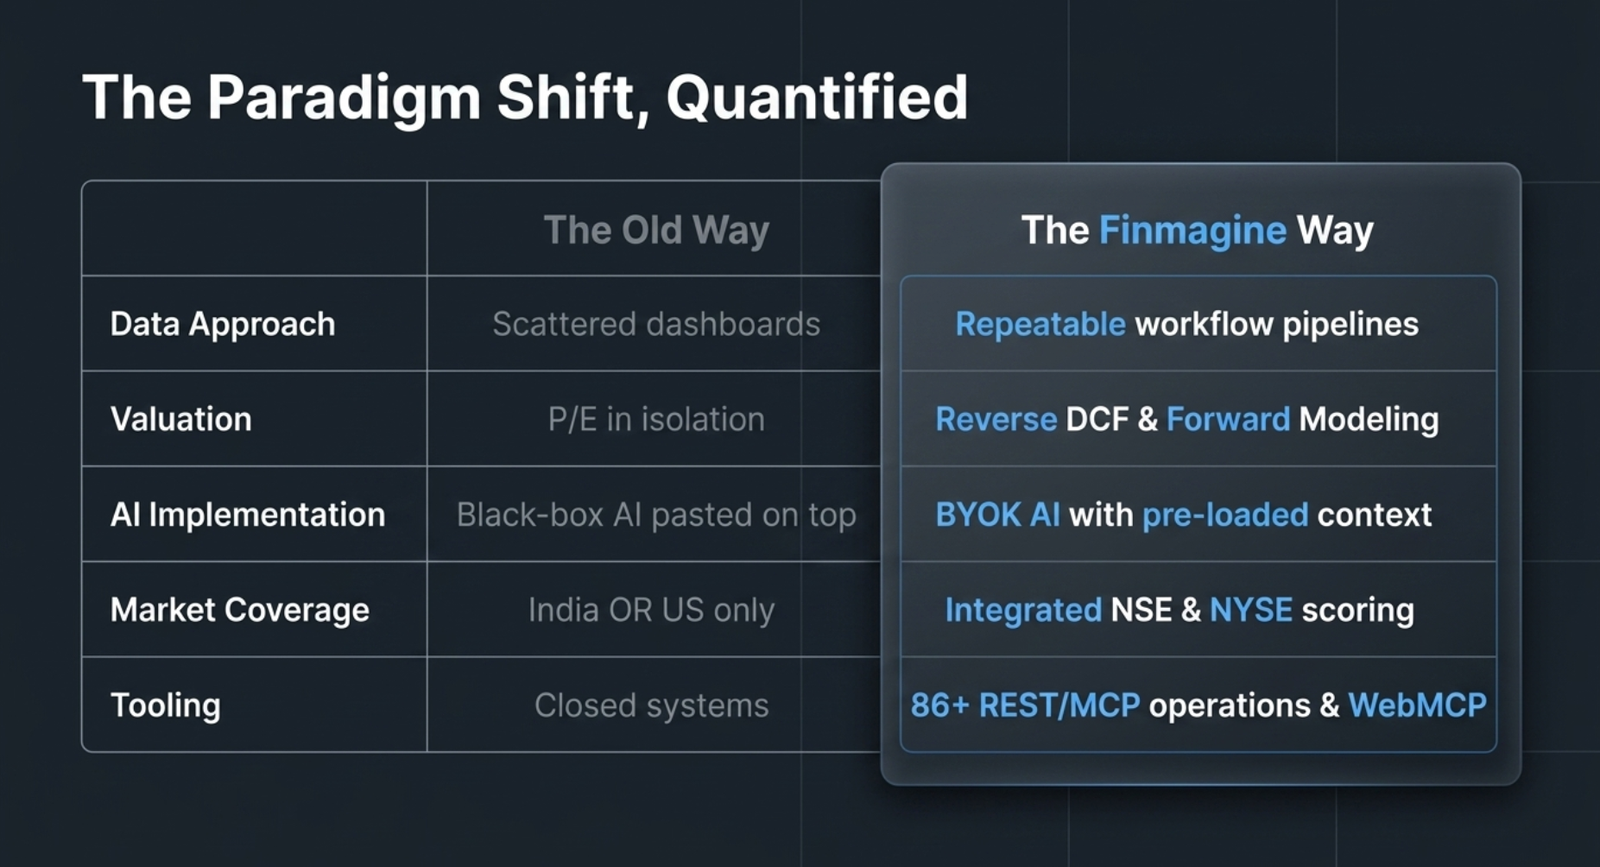
- Top-down and bottom-up in one workflow. Market breadth → sector rotation → stock selection → valuation, not four separate tools you have to stitch together yourself.
- India and US under one framework. Not a US platform retrofitted, and not an India tool with a US tab bolted on — the same scoring and workflow logic across both.
- Agent and API access, not only dashboards. Every core dataset is also a documented REST/MCP operation, so your own scripts or AI agents can use it directly.
- You control AI provider cost. Bring your own key across 6 providers — no markup, no silent usage, no vendor lock-in.
What Finmagine Is Not
Free Starting Points
None of these require a paid subscription — some don't even require an account:
- All 4 Chrome extensions (AI Advisor, Chart Builder, Trader, Portfolio Manager)
- NISM XV Research Analyst Study Guide (17 chapters)
- Foundation & Basics Education Hub
- Public preview tabs on Market Breadth, Sector RRG, and Market Mood Index (deeper history and some views unlock with Premium)
- Top 20 Company Rankings, Stock Ratings' Top Picks tab
Test Your Knowledge
A comprehensive knowledge check covering every module above — click to reveal each answer.
What is the core philosophical difference between Finmagine and traditional data platforms?
Finmagine provides a framework to interpret data systematically rather than just providing raw material.
What are the four primary repeatable workflow paths built into the Finmagine platform?
Long-Term Investor, Swing Trader, Earnings Season, and Developer/Agent Builder.
Identify the four steps in the Long-Term Investor workflow.
Screener, Stock Intelligence, Forward Model, and Portfolio.
Identify the sequence of tools used in the Swing Trader workflow.
Market Breadth, Sector RRG, RS Before Price, RS Momentum, and Conviction.
Which specific valuation model does Finmagine use for banks and NBFCs?
A specialized PAT × P/E model.
On what technical indicator are the VSTOP Volatility Charts based?
Average True Range (ATR).
What five dimensions are used to compute the nightly Scorecard for NSE-listed stocks?
Financial Health, Growth, Competitive Position, Management Quality, and Valuation.
What data is pre-loaded into the AI Advisor to prevent hallucinations?
The company's full financial "Intelligence Block."
Which tool extracts contract values, clients, and geographies from corporate announcement PDFs?
Order Wins (Corporate Feeds).
The Earnings Catalyst Score (ECS) ranks stocks based on what primary outcome?
Post-earnings momentum potential.
Name the six AI providers supported by Finmagine's "Bring Your Own Key" feature.
OpenAI, Anthropic, Gemini, Groq, DeepSeek, and OpenRouter.
What is the purpose of the Conviction Ranking tool?
To find stocks where multiple independent screening lenses and readiness overlays agree.
The Sector Rotation Graph (RRG) plots sectors based on which two relative strength metrics?
RS-Ratio and RS-Momentum.
How many market factors are aggregated to calculate the daily Market Mood Index (MMI)?
6.
Which market factors contribute to the calculation of the Market Mood Index (MMI)?
Put/call ratio, breadth, 52-week high/low spread, VIX, moving-average deviation, and delivery percentage.
What does the Reverse DCF signal in Stock Ratings indicate?
The growth rate the market is currently pricing into a stock.
The Vintage Cohort View in the Portfolio Tracker groups holdings by which criteria?
The year of the first purchase.
Which tool allows users to build a basket of up to 10 NSE stocks and simulate historical performance?
Custom Index & Basket Builder.
What is the maximum number of active multi-condition rules allowed for Price & Technical Alerts?
30.
Which US market regulatory filing is tracked to monitor institutional "Star Investor" activity?
13F filings.
What is the primary function of the Strategy Lab?
Running sequential multi-agent research chains on a company or theme.
Which three specialist lenses are used in the Investment Committee consensus panel?
Fundamental, Technical, and Risk specialist lenses.
How many REST/MCP operations are available in the Interactive API Explorer?
86+.
Identify the four Finmagine Chrome Extensions.
Chart Builder, AI Advisor, Finmagine Trader, and Portfolio Manager.
Which Chrome extension scans 2,000+ NSE stocks for VCP breakouts and Stage 2 setups inside Screener.in?
Finmagine Trader.
The platform provides free study material for which SEBI certification?
NISM Series XV (Research Analyst).
What range is used for the Relative Strength (RS) Rating?
1 to 99.
What does the Altman Z-Score measure within the Smart Screener?
The financial health and bankruptcy risk of a company.
Which feature tracks the portfolios and entry/exit signals of India's super investors?
Star Investors.
What are the four industry stage classifications used in Market Intelligence?
Advancing, Topping, Declining, and Basing.
In the Forward Financial Model, what three scenarios can a user project?
Bear, Base, and Bull scenarios.
What is the duration of the multi-statement projections in the Forward Financial Model?
5 years.
How many NSE sectors are covered in the India Sector Rotation Graph?
18.
What base amount is used for the simulation in the Basket Builder?
₹10,000.
Which calculator includes Section 80CCD tax savings analysis?
NPS (National Pension System) Calculator.
What are T2T and ASM surveillance flags?
Exchange-mandated monitoring for stocks with high volatility or speculative activity.
What is the Kelly Criterion used for in the Investment Risk Calculator?
Determining optimal position sizing based on risk and reward.
Which specific AI protocol does the API Explorer support for agentic research?
Model Context Protocol (MCP).
What is PEAD in the context of stock intelligence?
Post-Earnings Announcement Drift.
How many business groups are tracked in the Conglomerate section?
14.
Which specific pricing/volume setup is the Trader extension designed to find in under 10 seconds?
VCP (Volatility Contraction Pattern) breakouts.
What is the purpose of RS Before Price?
To detect early relative strength in a stock before the actual price breakout occurs.
What does the Professional tier offer over the Premium tier?
A full sortable ranking of all NSE-listed stocks across five dimensions.
What is Ask Finmagine?
A guided chat interface trained on the platform's internal documentation and metric definitions.
What does the Portfolio Manager browser sidebar show?
Live P&L, cost-basis tracking, and CAGR matrix.
Which tool provides a daily interpreted brief of India indices, FII/DII flows, and upcoming earnings?
Morning Market Brief.
What is the primary objective of the Custom Index tool?
To simulate the performance of a weighted, rebalanced thematic portfolio over time.
How many Indian and US companies respectively are covered by Finmagine as of 2026?
Over 6,000+ in India and over 6,000+ in the US.
What algorithm is used to normalize coordinates in the Relative Rotation Graph?
A JdK-style EMA/SMA algorithm.
Which feature tracks promoter pledging and insider trade delta?
Market Structure & Event Feeds.
What is Management Tone Analysis used for in Earnings Intelligence?
Analyzing the sentiment of company leadership during concall transcripts.
In the Portfolio Tracker, what does a Rolling CAGR Matrix help evaluate?
The annualized growth rate of positions over varying time horizons.
What is Industry Stage Classification intended to show investors?
The current lifecycle phase of a specific market sector (e.g., Basing vs. Topping).
Identify one Named Preset available in the Smart Screener.
Decade Compounders (or FCF Machines, or Bulletproof Quality).
What is the maximum number of custom baskets a user can save per account?
20.
What specific technical events can trigger a Price & Technical Alert?
User-defined price levels, RSI conditions, EMA crossovers, and volume spikes.
The Scorecard assigns weights of 25% to which two dimensions?
Financial Health and Growth.
What ATR period and multiplier options are used to calibrate VSTOP charts?
Periods of 14/21 and multipliers of 1.5× to 3.0×.
Which free section of the platform contains 17 chapters for professional licensing preparation?
NISM XV Research Analyst Study Guide.
What is the primary benefit of using a Strategy Lab research chain over a standard AI prompt?
It uses sequential analyst stages where each stage builds on the findings of the previous one.
How does Finmagine define Market Breadth?
The percentage of stocks participating in a market move, such as those above key moving averages.
Which tool provides a side-by-side comparison of two stocks' 12-quarter financial performance?
Compare & Peer Analysis.
What does the Top Picks tab in Stock Ratings represent?
A free list of stocks with high fundamental scores and favorable valuation signals.
The Investment Committee provides a _____ allocation for stocks based on specialist consensus.
Risk-audited.
What is the purpose of the Financial Chart Builder tool?
Visualizing any company's multi-year financials as interactive charts.
In the Portfolio Tracker, what automatically flags bonus issues and splits that haven't been applied to a user's cost basis?
An automatic corporate-action flag — surfaced on the Alerts tab with a Telegram nudge, applied only when the user approves it.
What does the "Why It Screened" feature in the Smart Screener use to explain a match?
A synthesis of the signals behind the match, generated using the user's own chosen AI provider.
Which feature brings together earnings-related artifacts for US stocks in one place?
The US Earnings Artifact Tracker.
What Users Say
These are verbatim comments from public forums — linked to the original posts, not curated summaries.
"I run a Python script daily where I get a subset of this result set since mine is tighter and it takes around 30 mins to scan through and fetch all data. I can see this saving lots of hours for me. Brilliant work!"
— Gaurav Bhatnagar, Chrome Web Store review, Finmagine Trader
"There is this Chrome extension which gives a list of good stocks with four types of signals: stage 2 uptrend, near 52-week high, high volume and VCP breakout setup. Very useful even if you are not a trader."
— Bhavesh Parmar, Chrome Web Store review, Finmagine Trader
"Once again, you have hit the ball out of the park in uplifting the general investing community."
— vivek_lakhani, ValuePickr forum, AI Advisor thread
"It helps a lot in lowering the cognitive load when looking at the numbers."
— Rahul_Behera, ValuePickr forum, Chart Builder thread
Chrome Web Store reviews (★★★★★): AI Advisor · Trader · Chart Builder
Free vs Premium
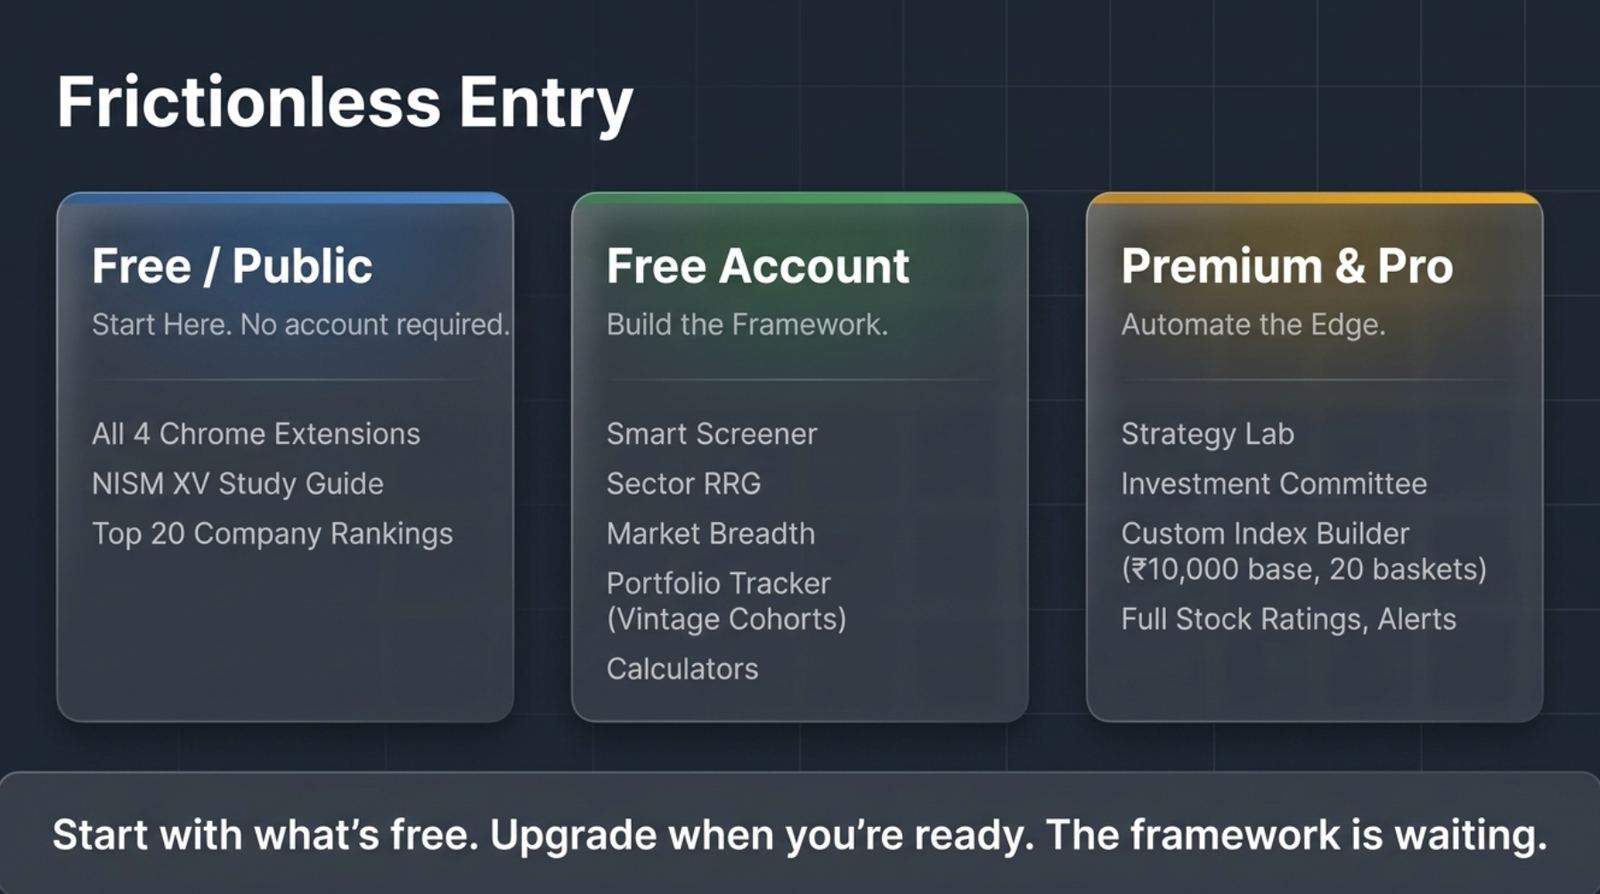
No account required — fully public
- All 4 Chrome extensions
- NISM XV Research Analyst Study Guide
- Foundation & Basics Education Hub
- Investment Blog
- Top 20 Company Rankings, Stock Ratings' Top Picks tab
Free account (login, no payment)
- Everything above
- Screener, Sector RRG, Conviction Ranking, Market Breadth
- Portfolio Tracker, Named Watchlists & Portfolios
- IPO Tracker and Calendar
- Financial Calculators
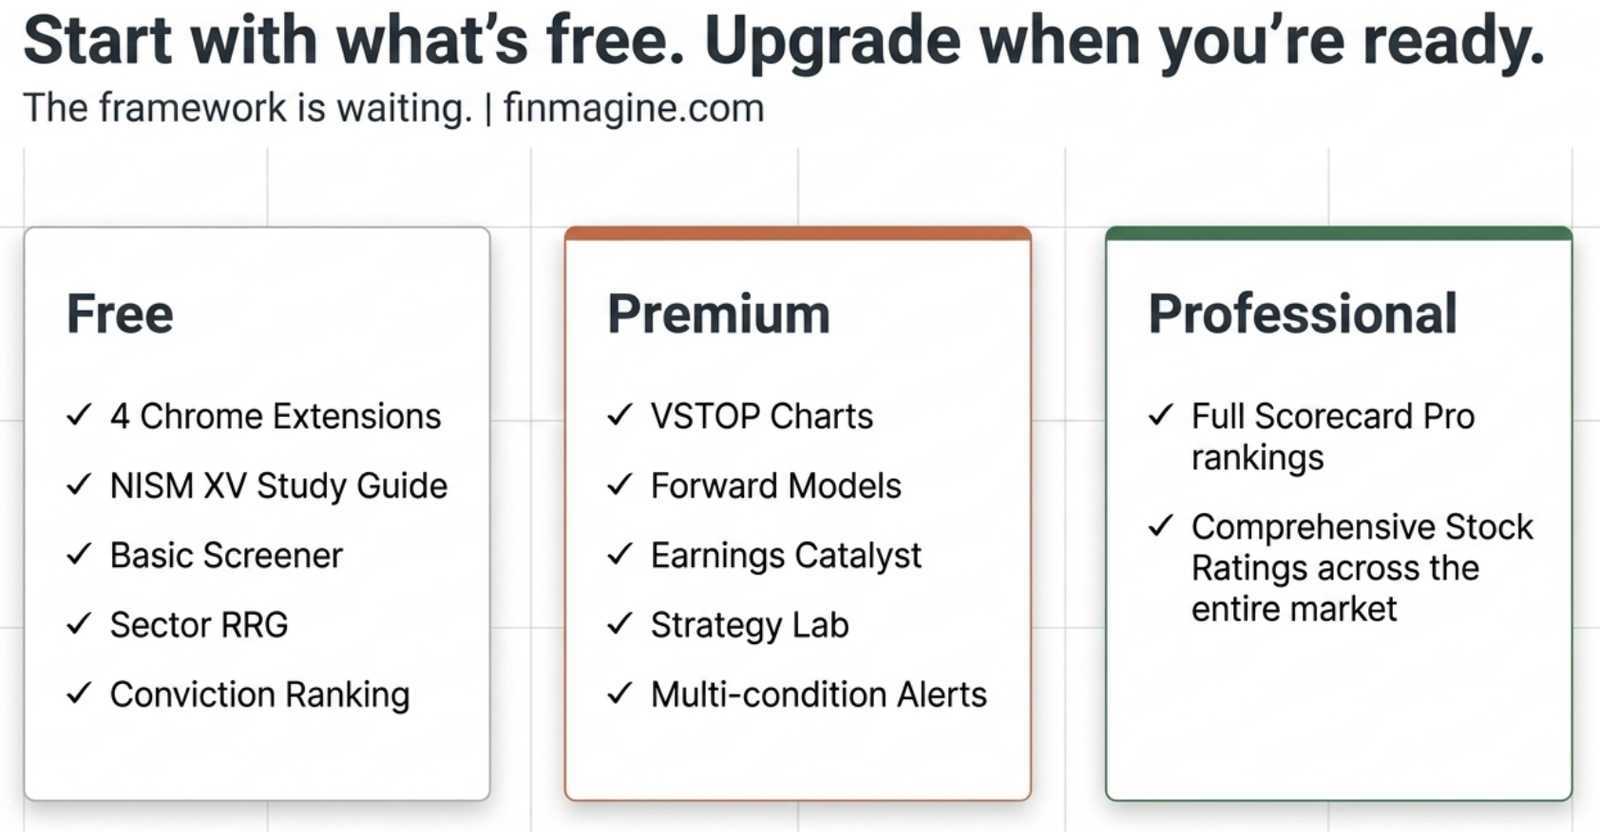
Premium
- Full Stock Ratings list
- VSTOP Charts, Forward Financial Model, Custom Index, Alerts
- Earnings Catalyst Score, RS Before Price
- Strategy Lab & Investment Committee
Professional
The highest tier — everything in Premium, plus the Scorecard's full sortable ranking across the entire market, and the NISM Mock Test Platform.
Start with what's free. Upgrade when you're ready.
The Chrome extensions, NISM workbook, Foundation & Basics hub, and several core market tools require no payment. Start there.
Create Free Account See All Features