Following along? Open the live page
Finmagine — free to explore • premium for full access • no app needed
Multimedia Learning Hub
Spot early institutional accumulation by tracking relative strength leading signals
What You Will Master
The RS High Before Price High scanner is designed to capture a unique momentum discrepancy: stocks that have already ascended to the top 20% of trailing price performance relative to the market (RS Rating >= 80) and achieved a new 52-week RS high, while their absolute price remains consolidating below its own 52-week high. This indicates quiet accumulation that often precedes major price breakouts.
What This Guide Covers:
- The CANSLIM breakout concept — why relative strength peaks before price
- The selection criteria — RS Rating >= 80, market cap >= ₹500 Cr, price >= 3% below 52W high
- Stale-data checks — date warnings to verify database freshness
- The table columns — Symbol, Company & Sector subtext, RS Rating, price metrics, Hold/Watch overlays
- Filtering by closeness — toggling the Near 52W High (within 15%) list
- Workflow integration — coordinating with Breadth and RRG
Video Walkthrough
Institutions buy quietly before price ever confirms it. This page is the centerpiece of a real, end-to-end workflow — checking CAN SLIM quality, confirming the sector on the RRG, and using Conviction Ranking to separate an early watchlist signal from a stock that's actually ready to trade.
Want the illustrated concept behind it? See the Trading Playbook tab.
Spotting the Institutional Footprint
The video above follows one core idea: the lag between relative strength and price is the setup, not the trade. Here's that same idea laid out step by step, illustrated with the same real example (Venus Remedies, Nifty Pharma) shown in the video.
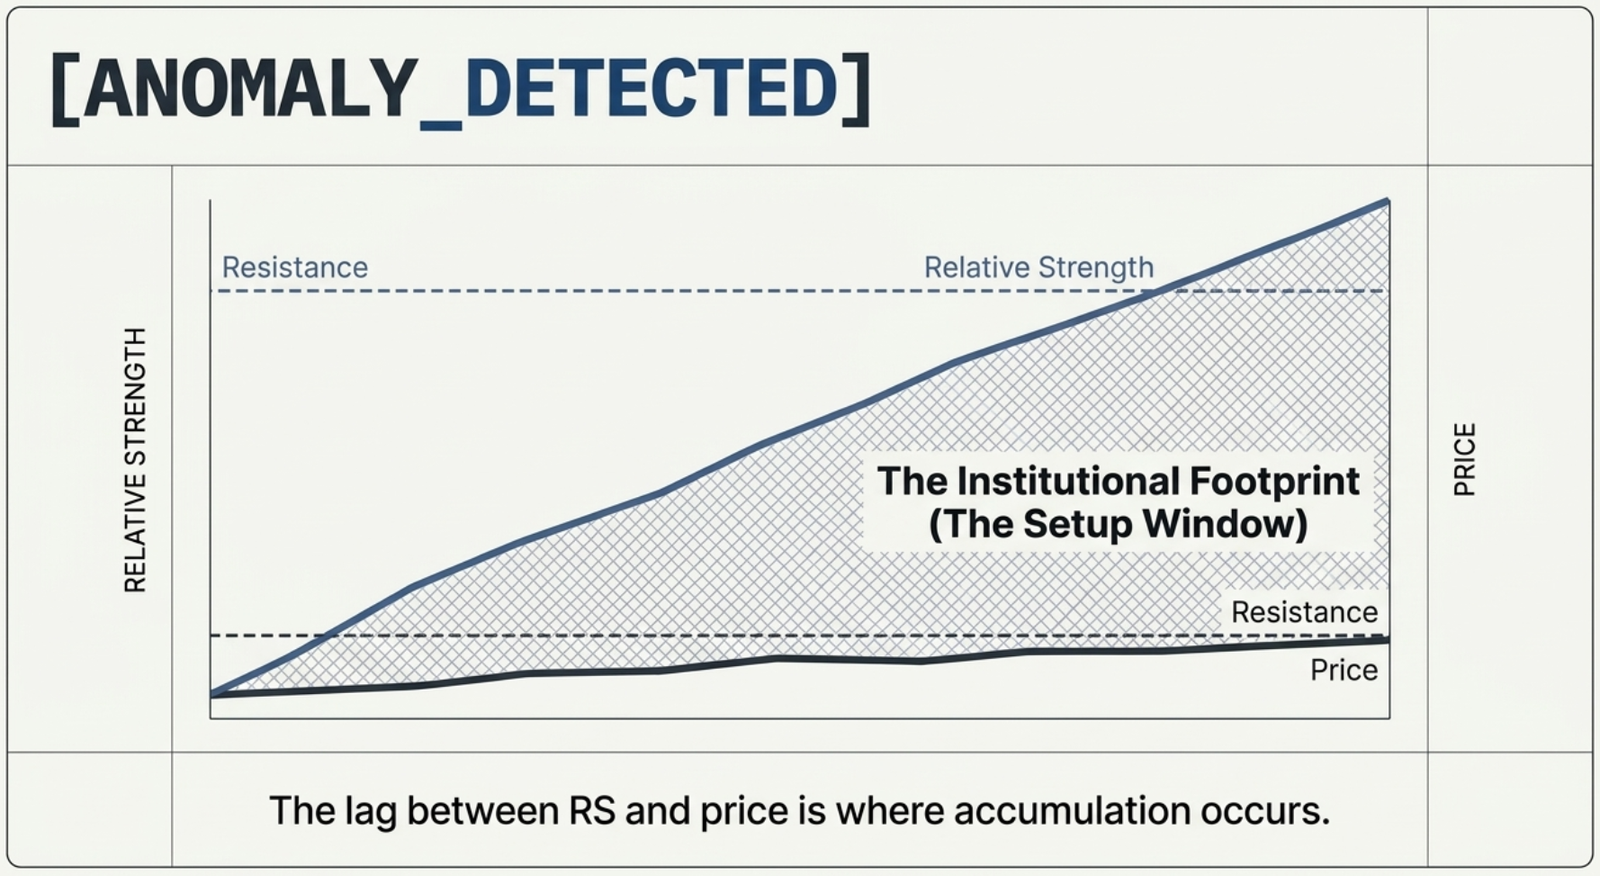
The Institutional Footprint
Large institutions accumulate positions before price ever confirms a breakout, and that quiet accumulation leaves a detectable footprint in Relative Strength. The gap between rising RS and the eventual price breakout is the "setup window" — and it's where the opportunity lives.
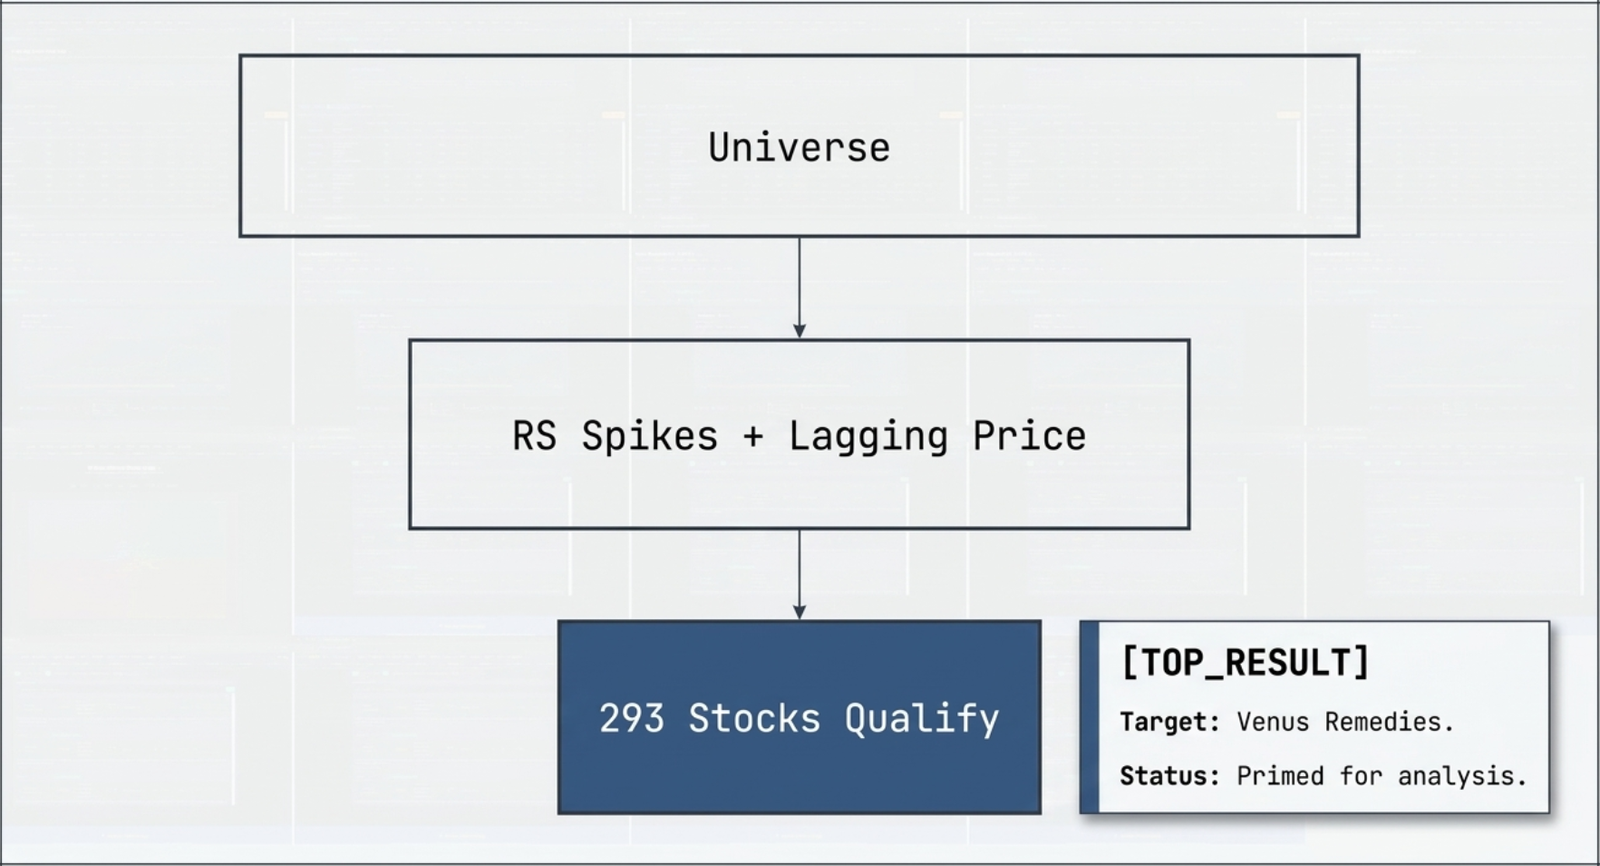
Narrowing the Universe
From the full market, the scan narrows to stocks where RS is spiking while price is still lagging behind.
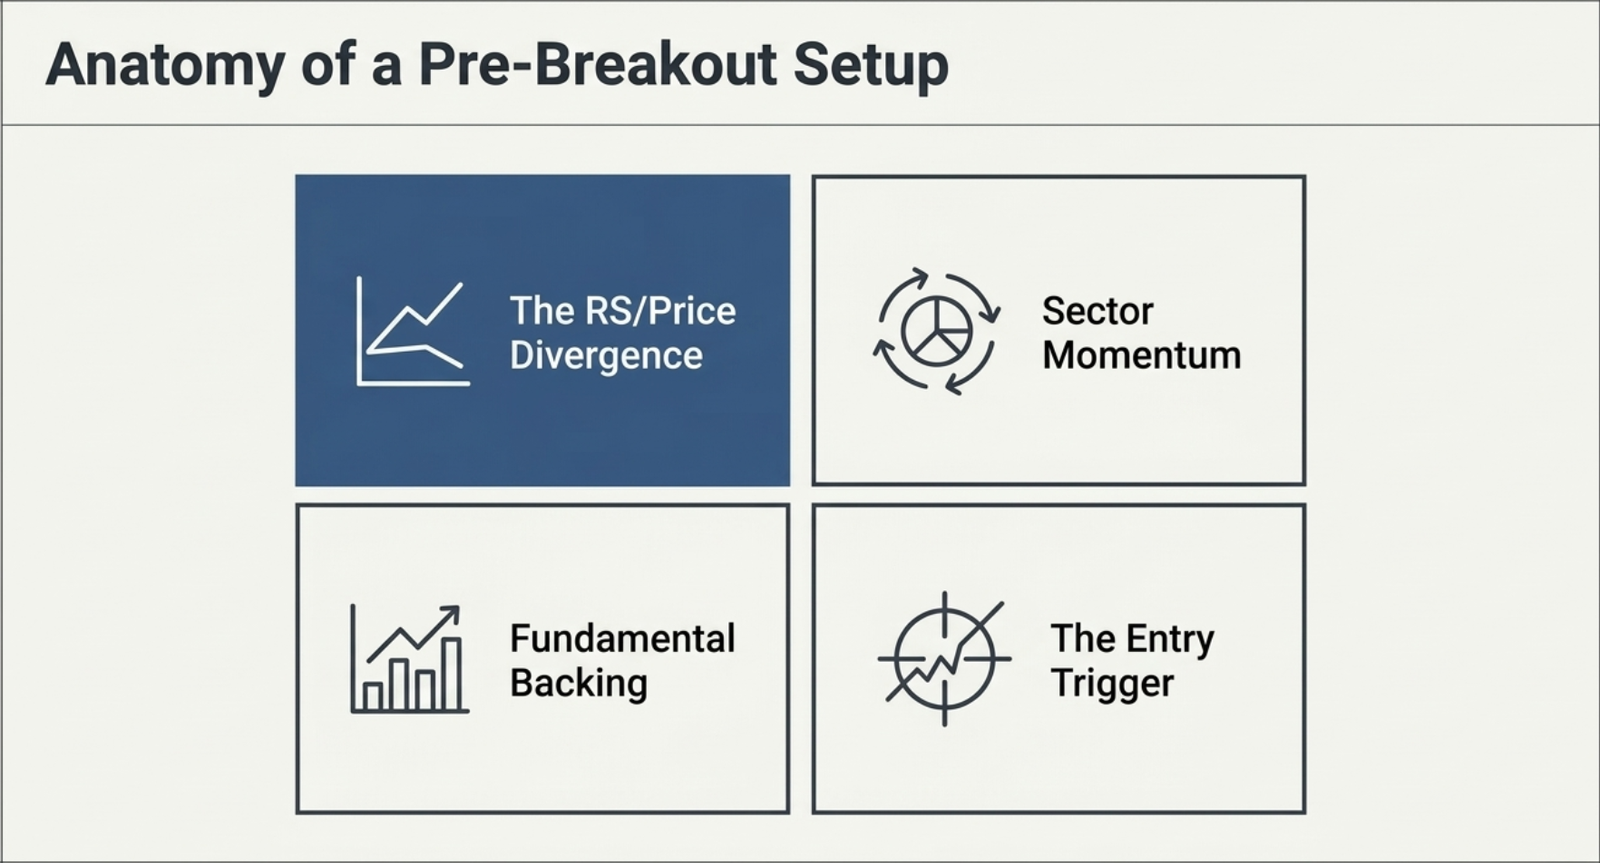
Anatomy of a Pre-Breakout Setup
Four checks make up a genuine setup: the RS/price divergence itself, sector momentum, fundamental backing, and the eventual entry trigger.
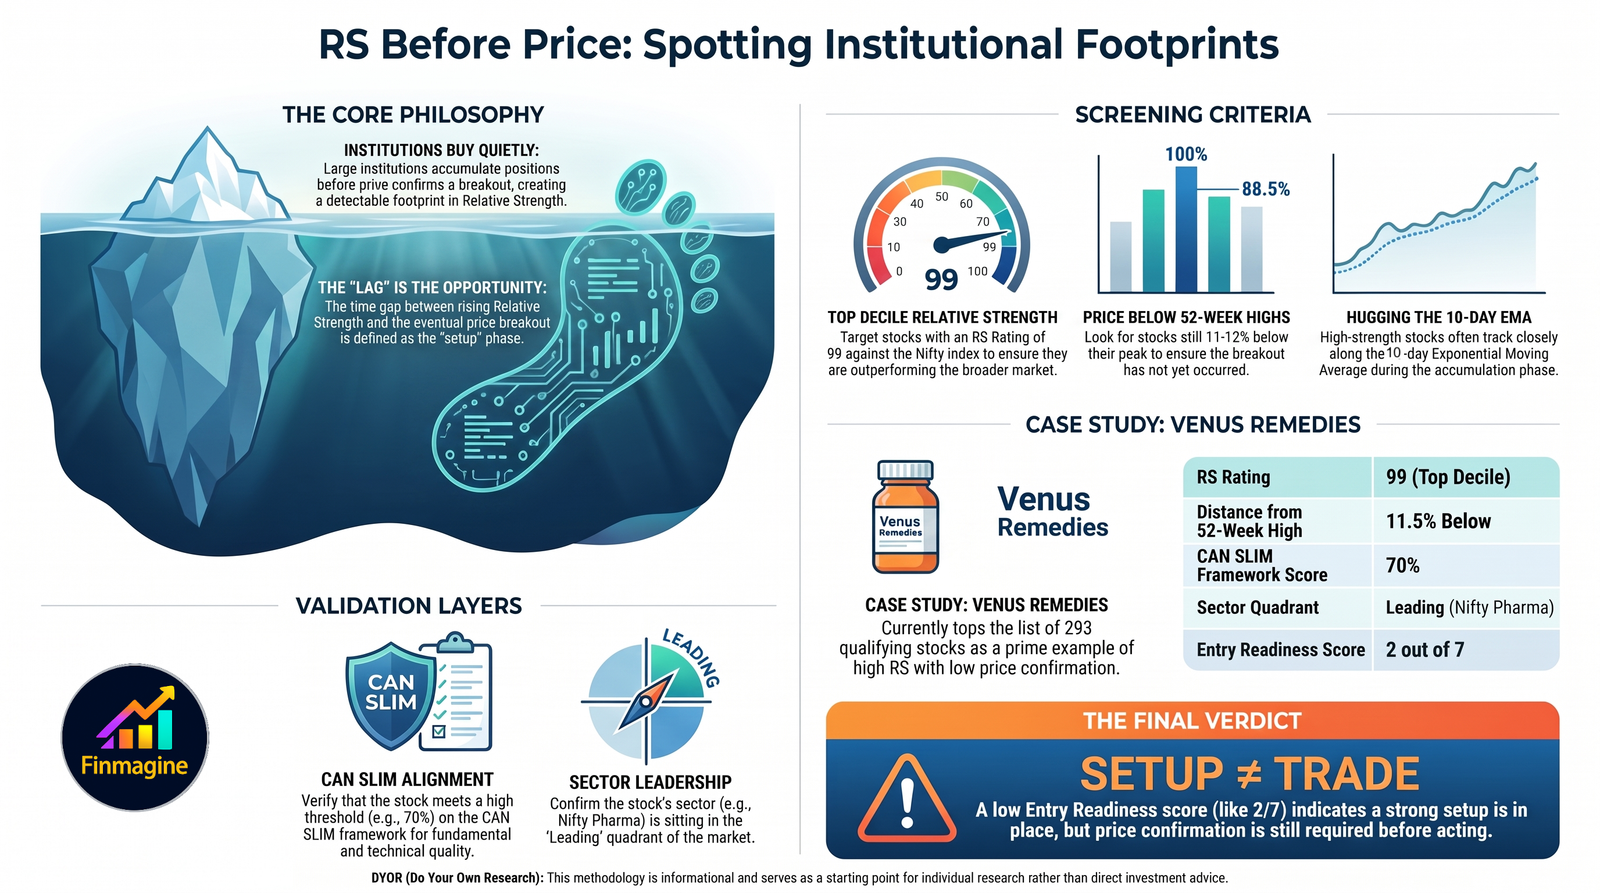
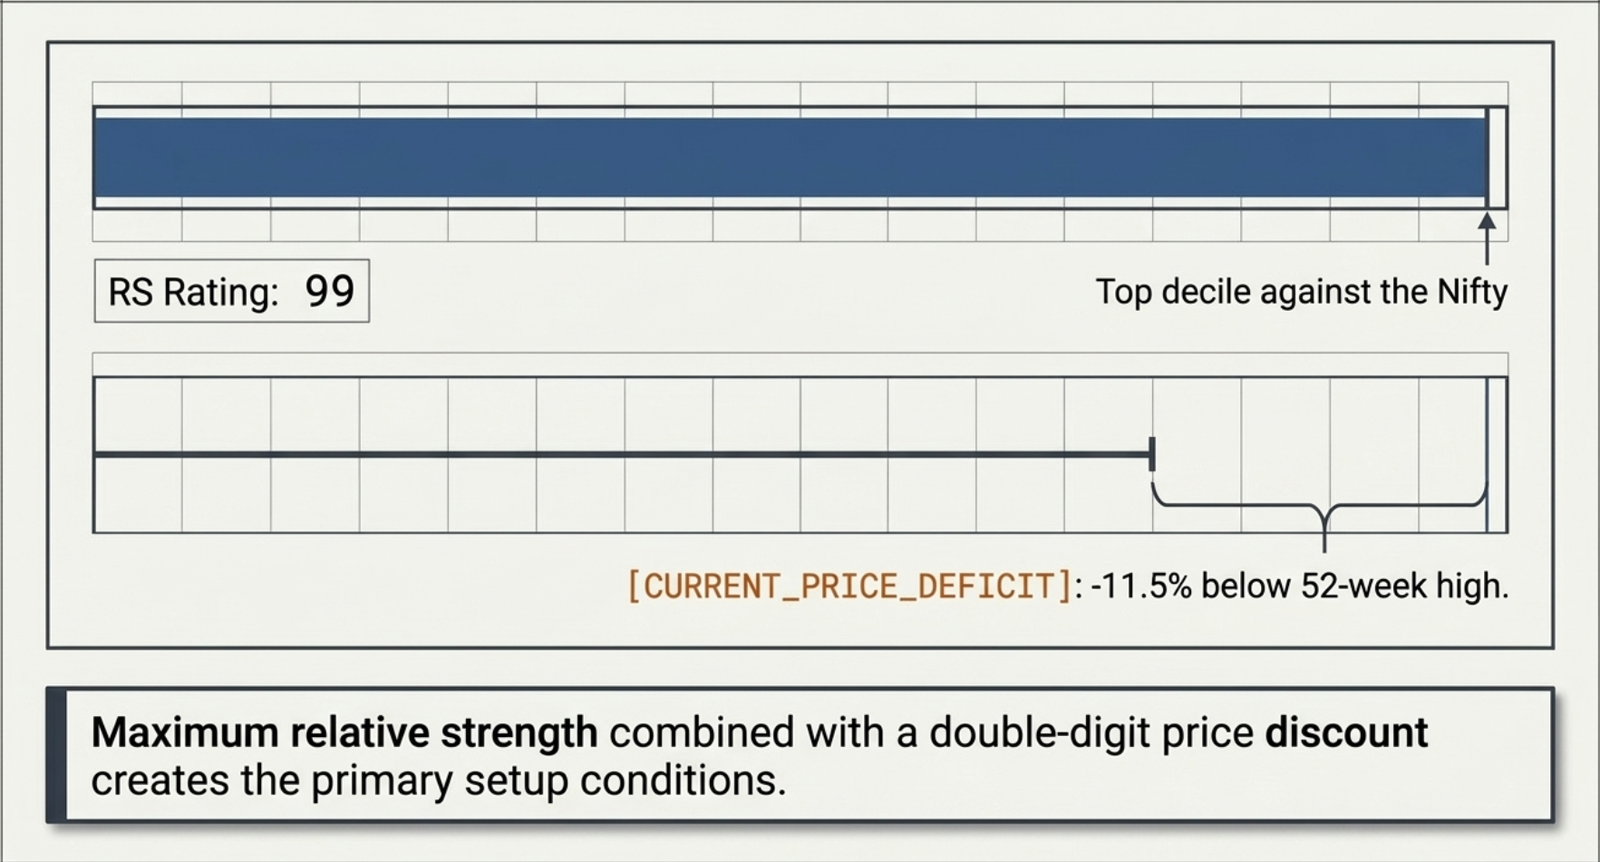
Maximum Relative Strength, Meaningful Price Discount
The setup requires both halves at once: a top-decile RS Rating, and price still meaningfully below its 52-week high.
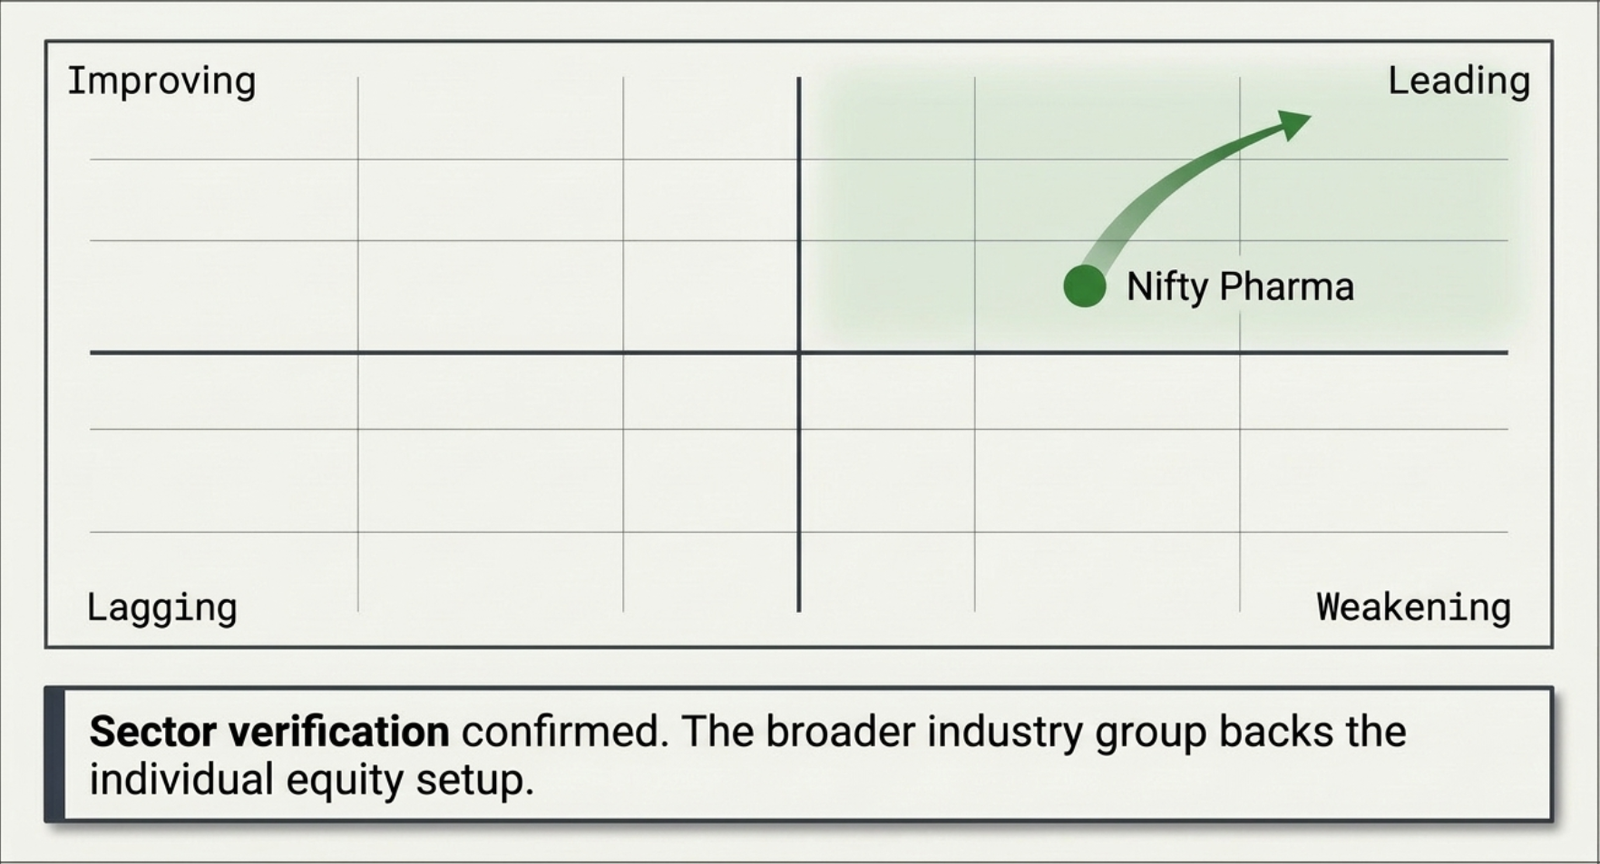
Confirming the Sector
A single stock's RS/price divergence means more when the broader sector backs it up. This is the same RRG check used across the platform.
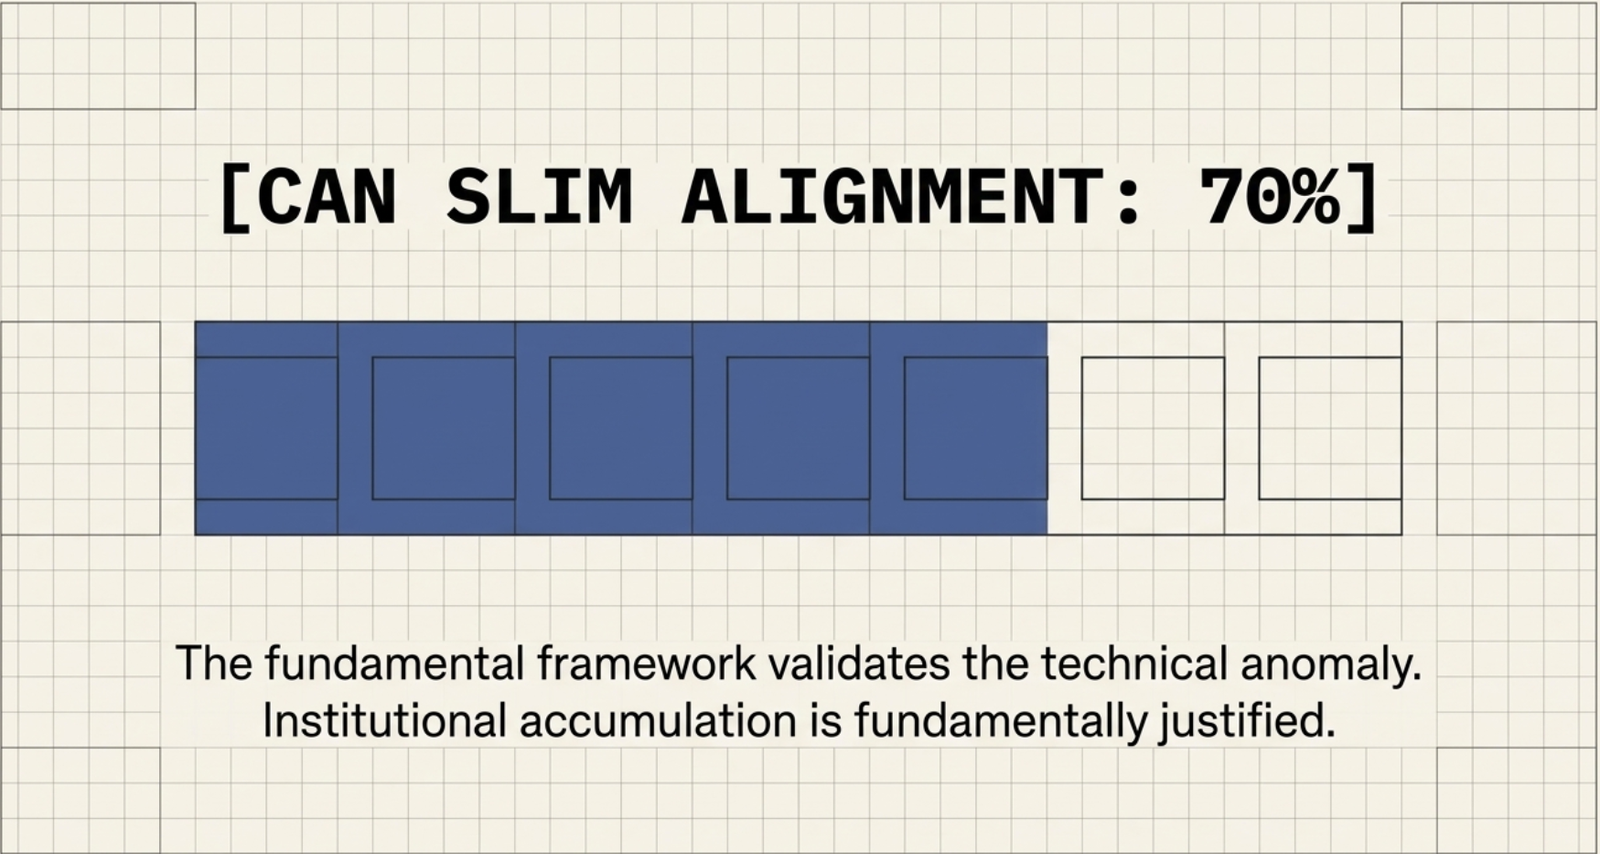
Fundamental Backing
A technical anomaly is worth more when the fundamentals back it up — the CAN SLIM framework is the cross-check.
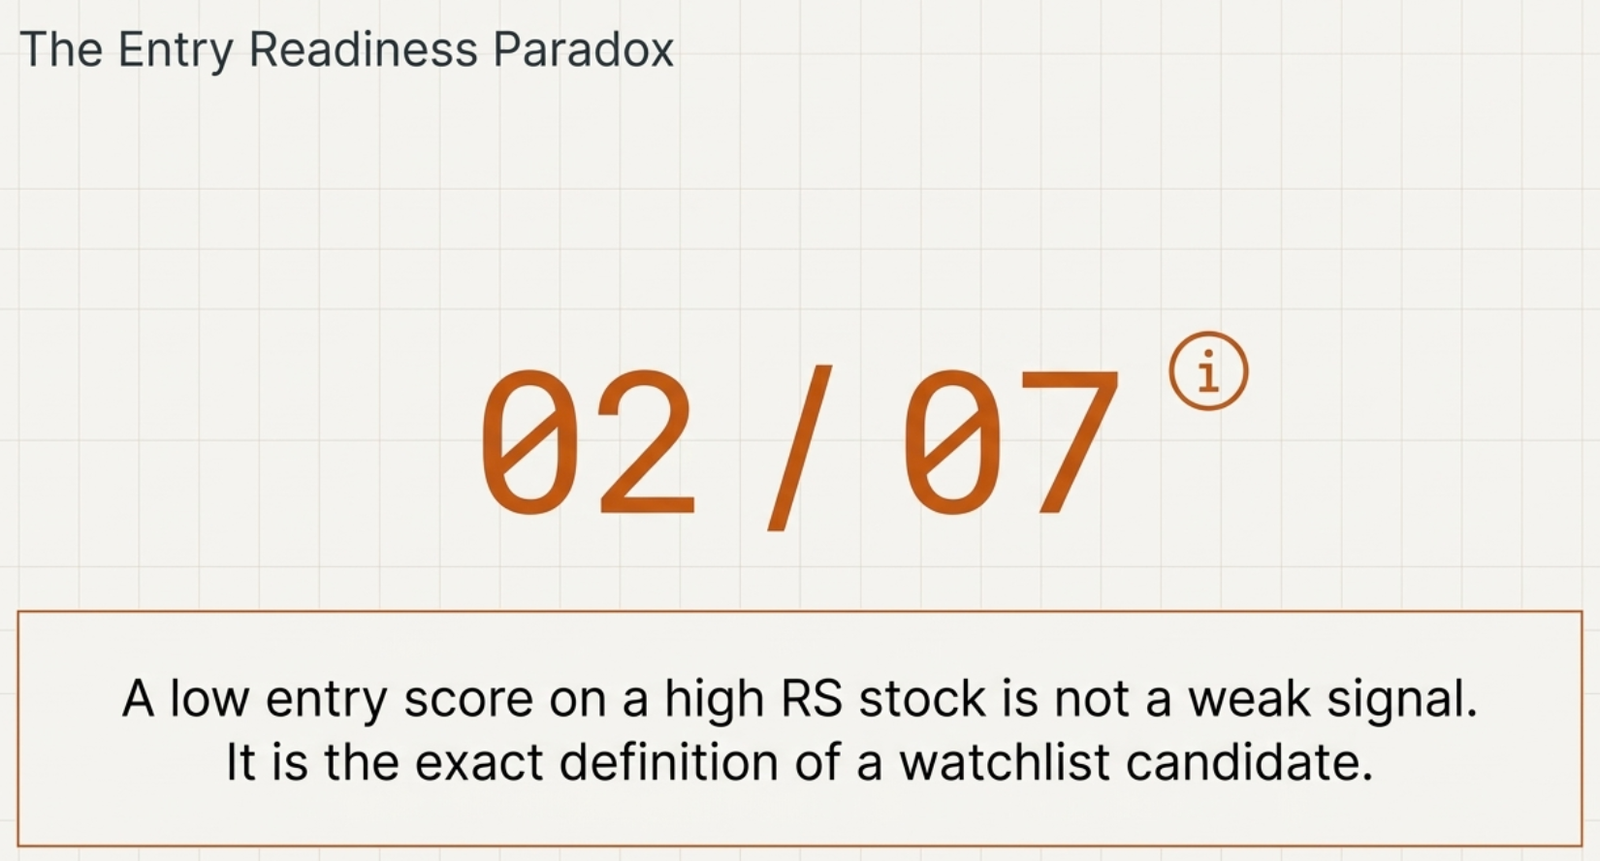
The Entry Readiness Paradox
This is the idea the whole page is built around: a low Entry Readiness score on a high-RS stock isn't a weak signal — it's exactly what a watchlist candidate looks like, before the trade is actually ready.
What's Confirmed, and What's Still Missing
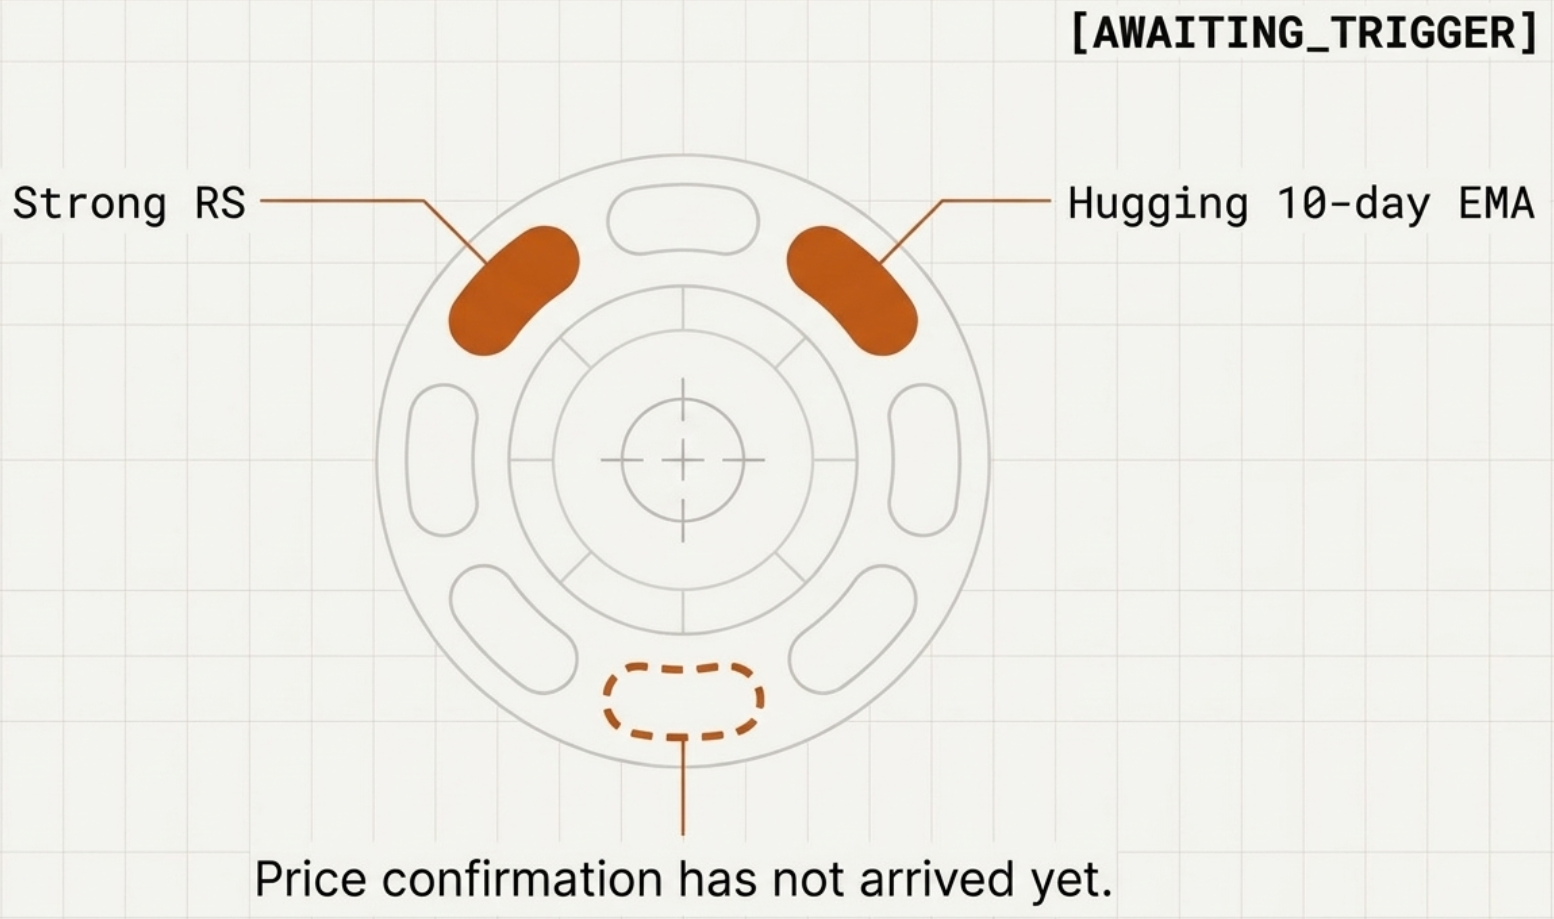
Conceptually, two of the entry-readiness signals are already lit up — strong RS and price hugging the 10-day EMA — while price confirmation itself hasn't arrived yet. (Illustrative diagram — not a literal screenshot of any Finmagine page.)
The Confluence Engine
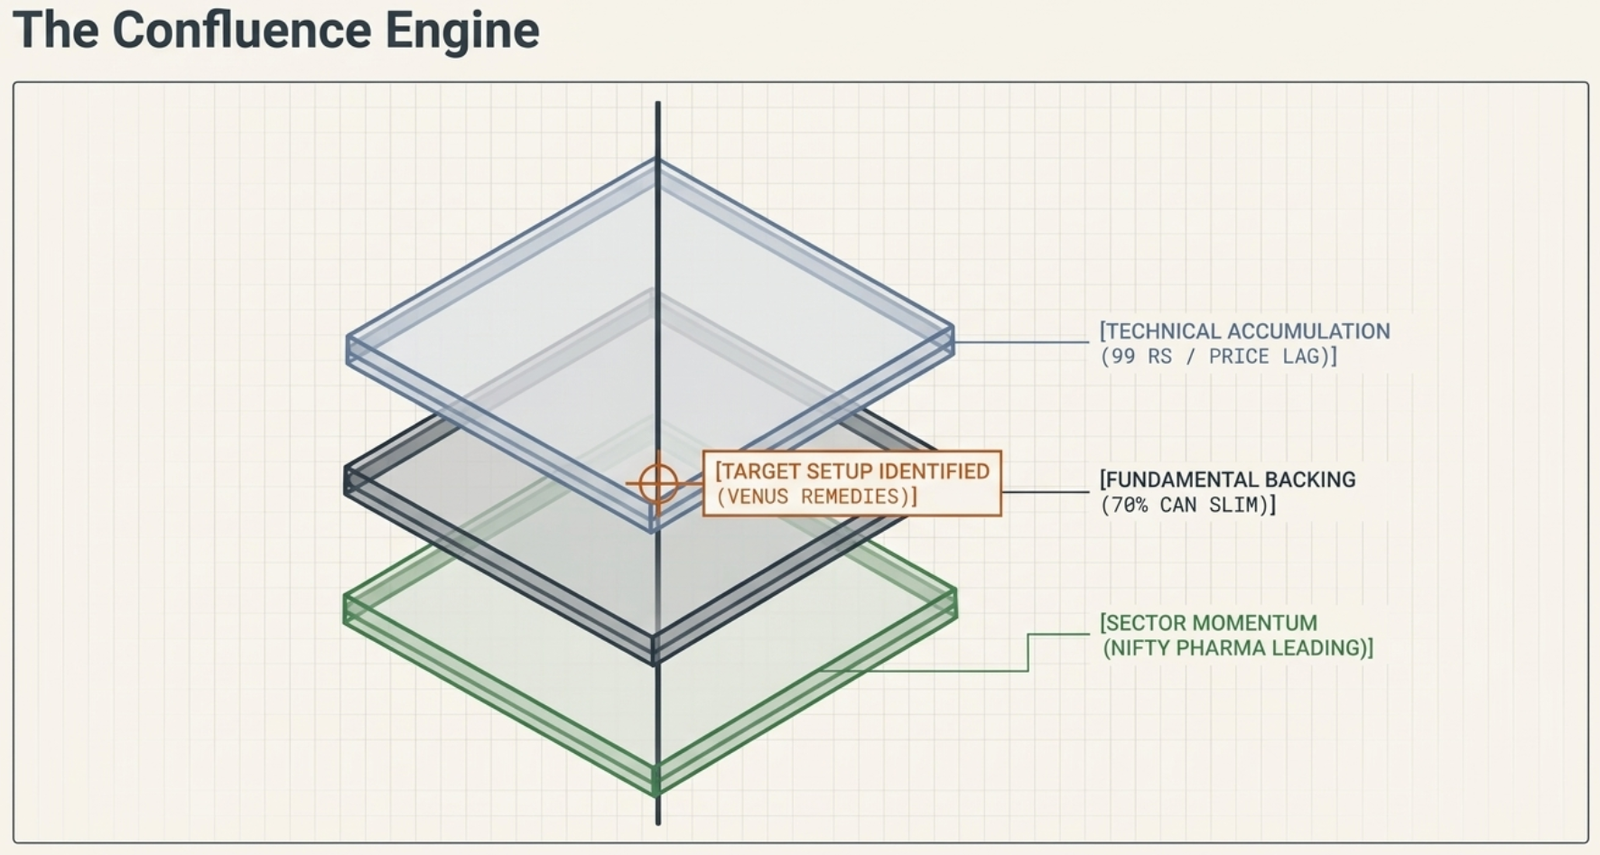
Three layers stacked together — technical accumulation, fundamental backing, and sector momentum — are what identify a genuine target setup.
The Setup vs. The Trade
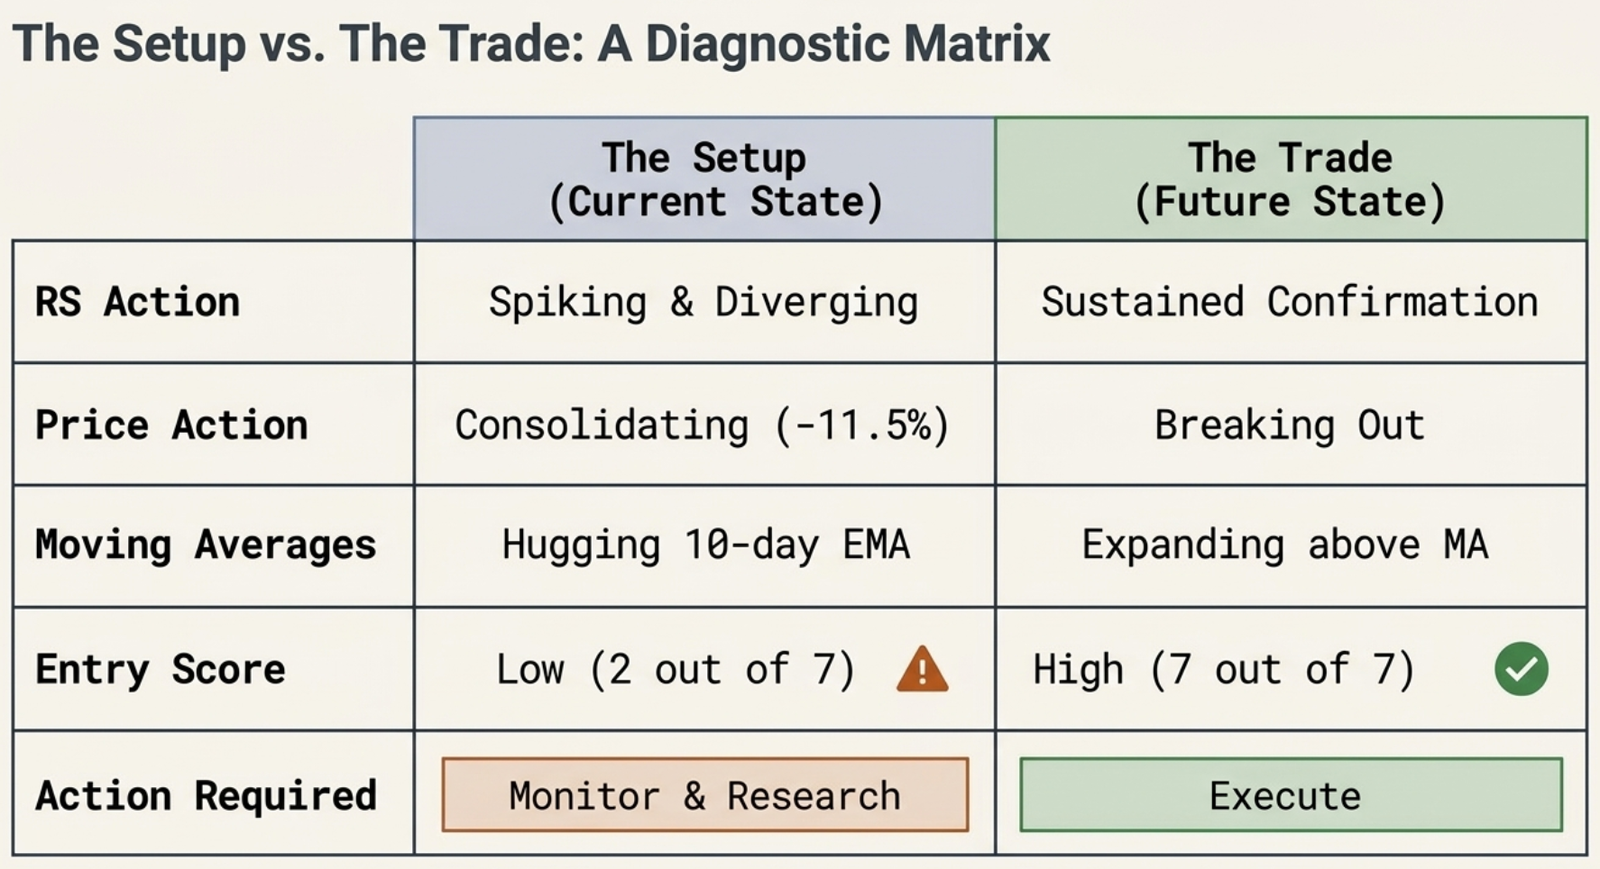
This is the whole page's thesis in one table. A setup and a trade look different on every dimension — and mixing them up is how a watchlist idea gets treated like a buy signal.
The O'Neil CANSLIM Setup
In his landmark book *How to Make Money in Stocks*, William O'Neil identified that the most explosive market leaders begin outperforming the general market weeks or months before their actual price breakout. This outperformance is captured when a stock's Relative Strength line makes a new 52-week high while its price is still in a consolidation pattern (like a cup-with-handle or flat base).
This discrepancy occurs during market corrections. When the index is declining, the future leader holds steady or drops very slightly. Since it is outperforming the index, its relative strength rating surges to new highs. When the market correction finally ends and the index turns up, this stock is already positioned to break out first.
Reading the Scanner Table
This premium dashboard presents a clean, sortable layout to filter candidates:
| Column | What it shows | Notes |
|---|---|---|
| Symbol & Company | The ticker and company name. Clicking opens the stock page. | Includes the **Sector** as a subtitle below the name for immediate context. |
| RS Rating | Percentile relative strength rank (80–99). All stocks here are S-Tier. | A rating of 90 means it outperformed 90% of Nifty 500 stocks over the last 12 months. |
| Price & 52W High | Current price and the trailing 365-day price peak. | — |
| % Below High | Percentage distance the current price must climb to reach its 52W high. | By definition, all stocks here are at least 3% below their 52W high. |
| % From 20 EMA / % From 50 EMA | How far the current price sits above or below its 20-day and 50-day exponential moving averages. | Green means price is above that EMA (short-term support intact), red means below it. Use these alongside % Below High to gauge whether the stock is still in a tight, tradeable base or has drifted too far from its moving averages for a clean entry. |
| MCap | Market capitalization in ₹ Cr. | The scanner filters out illiquid micro-caps by enforcing a minimum ₹500 Cr cutoff. |
| Hold (★) / Watch (●) | Overlays showing if you hold the stock or have it on your watchlist. | Read-only flags mapped directly from your Portfolio trade ledger. |
Strategic Workflow Integration
Do not buy stocks blindly based on scanner results. Integrate the scanner into a top-down workflow:
- Broad Market Check: Look at the Market Breadth Dashboard. Breakouts succeed at a much higher rate when market breadth is expanding.
- Sector Strength Check: Check the Sector RRG. Prioritize stocks belonging to sectors in the *Leading* or *Improving* quadrants. You can identify the sector directly in the subtext under the company name.
- Consolidation Quality: Check the chart to ensure the stock is forming a constructive base (e.g. tight closes, contracting volume on down days) rather than breaking down on heavy volume.
Related Guides
- RS Momentum Scanner — Learn the basics of the 1–99 Relative Strength Rating
- Market Breadth Dashboard — Use market breadth to time your breakouts
- Sector RRG — Track sector rotation to find the strongest groups
Ready to Analyse Indian Stocks Like a Pro?
Finmagine gives you 30+ computed financial ratios, sector benchmarks, FII/DII flows, the Finmagine Score, and AI-powered analysis — all in one place.